Copyright © 1999, American Society for Microbiology. All Rights Reserved.
Evaluation of Mycology Laboratory Proficiency Testing
ANDREW A. REILLY,1,2* IRA F. SALKIN,1,2MICHAEL R. MCGINNIS,3SALLY GROMADZKI,1LESTER PASARELL,3MAGGI KEMNA,1NANCY HIGGINS,1ANDMAX SALFINGER1,4
Wadsworth Center, New York State Department of Health,1and Department of Medicine, Albany Medical College,4 Albany, and School of Public Health, The University at Albany, Rensselaer,2New York, and Center for
Tropical Diseases, Department of Pathology, University of Texas Medical Branch, Galveston, Texas3 Received 16 December 1998/Returned for modification 8 February 1999/Accepted 19 April 1999
Changes over the last decade in overt proficiency testing (OPT) regulations have been ostensibly directed at improving laboratory performance on patient samples. However, the overt (unblinded) format of the tests and regulatory penalties associated with incorrect values allow and encourage laboratorians to take extra precau-tions with OPT analytes. As a result OPT may measure optimal laboratory performance instead of the intended target of typical performance attained during routine patient testing. This study addresses this issue by eval-uating medical mycology OPT and comparing its fungal specimen identification error rates to those obtained in a covert (blinded) proficiency testing (CPT) program. Identifications from 188 laboratories participating in the New York State mycology OPT from 1982 to 1994 were compared with the identifications of the same fungi recovered from patient specimens in 1989 and 1994 as part of the routine procedures of 88 of these labora-tories. The consistency in the identification of OPT specimens was sufficient to make accurate predictions of OPT error rates. However, while the error rates in OPT and CPT were similar forCandida albicans, significant-ly higher error rates were found in CPT forCandida tropicalis,Candida glabrata, and other common pathogenic fungi. These differences may, in part, be due to OPT’s use of ideal organism representatives cultured under op-timum growth conditions. This difference, as well as the organism-dependent error rate differences, reflects the limitations of OPT as a means of assessing the quality of routine laboratory performance in medical mycology.
The New York State Public Health Law requires all clinical laboratories and blood banks conducting tests on specimens collected within New York State to hold a state clinical labo-ratory permit, unless the tests are conducted as an adjunct to a physician’s medical practice (physician office laboratory). In response to a 1964 legislative mandate, the New York State De-partment of Health initiated an overt proficiency testing (OPT) program as one method of monitoring the overall quality of testing performed by state permit-holding clinical facilities. The program, as of 1998, has grown to include almost 1,000 clinical facilities, both within New York State and in over 30 other states. Of these, 188 hold permits in medical mycology to isolate and identify either yeast-like potential pathogens only (limited permit) or all fungi and aerobic actinomycetes (gen-eral permit) which may be recovered from clinical specimens. After learning of widely publicized problems found in the screening of Papanicolaou smears in cytopathology laborato-ries, Congress enacted the Clinical Laboratory Improvement Amendments of 1988 (CLIA ’88). The statute and enabling regulations initially required, in part, that all sites conducting laboratory tests on human specimens must participate in fed-erally approved OPT programs. While the regulatory burden has been lightened over the years, current CLIA ’88 regula-tions require approximately 40% of all federally registered test facilities to participate in one of 20 OPT programs approved by the Health Care Financing Administration. Proficiency testing has gained wide acceptance as a regulatory tool; the mainte-nance of clinical laboratory operating licenses at state and federal levels are chiefly dependent upon successful OPT per-formance.
There have been few investigations of the ability of OPT to evaluate a laboratory’s routine testing capability. Previous studies primarily described the effects of the number and type of test specimens, laboratory personnel qualifications, and test methodology, etc., on proficiency test results (7, 15, 17, 18, 21, 30). This investigation was undertaken to compare the identi-fication of fungi reported by laboratories which participated in the New York State mycology OPT to those reported by these facilities for the same fungi isolated from routine clinical spec-imens that had been obtained during unanticipated surveyor collections (covert proficiency testing [CPT]).
MATERIALS AND METHODS
Laboratories studied.The OPT portion of the study includes all 188 labora-tories holding mycology permits whose test-specific results are stored in the department’s electronic records for tests between September 1989 and May 1994. In order to enhance the assessment of long-term trends, these data were aug-mented with results of semiannual OPT events conducted between January 1982 and September 1989, even though only aggregate, rather than laboratory-spe-cific, electronic records were available from these earlier tests (Table 1).
The CPT portion of the study includes isolates from routine patient specimens and laboratory identifications of them obtained by state surveyors during regular semiannual inspections. The isolates were analyzed by both the New York State Laboratories for Mycology and a reference laboratory. CPT was a double-blinded investigation, in that laboratories did not know which fungal isolates would be selected for confirmatory testing during the on-site inspections. Addi-tionally, during reanalysis both confirmatory laboratories were unaware of the isolates’ sources and original identifications.
OPT.From 1982 to 1991, 10 test specimens were sent twice each year (total of
20 specimens) to each participating laboratory. In the fall of 1991, the content and number of test events were modified to five test specimens shipped four times each year (20 specimens). To comply with CLIA ’88 requirements, the frequency of test events and number of test specimens were altered in the fall of 1993 to five test specimens sent three times each year (15 specimens; Table 1). Prior to OPT, a minimum of three strains of each of the proposed five specimens were obtained from the Laboratories for Mycology culture collection or recent clinical specimens. The morphological features of each mold were evaluated. Physiological characteristics, e.g., temperature optimum and growth on cycloheximide-containing media, etc., were examined through the use of appro-priate supplemental tests (23). The morphologies of all yeasts were studied with yeast grown on cornmeal agar plus Tween 80 in 100-mm-diameter petri dishes
* Corresponding author. Mailing address: Wadsworth Center, Rm. C543, New York State Department of Health, P.O. Box 509, Albany, NY 12201-0509. Phone: (518) 473-3493. Fax: (518) 474-2769. E-mail: [email protected].
2297
on May 15, 2020 by guest
http://jcm.asm.org/
inoculated by the Dalmau or streak-cut methods. Carbohydrate assimilation characteristics were determined by using the API 20C system (Biomerieux-Vitek, Hazelwood, Mo.) and other commercial yeast identification kits. Supplemental physiological characteristics, e.g., nitrate assimilation, urease activity, and tem-perature optimum, etc., were studied with appropriate test media (23). Based upon the results of these tests on each strain, the strains that demonstrated the best morphological and physiologic characteristics were selected for use in the test event.
CPT.The 88 laboratories in the CPT portion of the study were a subset of the
OPT participants selected on the basis of sample availability and the surveyor’s inspection schedules.
Specimens were obtained from 66 laboratories in 1988 and 1989 and 57 laboratories in 1993 and 1994. Isolate availability led to 22 of these 57 not being included among the 1988 and 1989 inspections (Table 1). The collected isolates (nominally three yeasts and two molds or aerobic actinomycetes) were recently recovered from clinical specimens and identified by the laboratory as part of its routine workload, i.e., CPT.
Isolates were immediately shipped to the Laboratories for Mycology by the surveyors where they were accessioned, subcultured, and reidentified by standard methods (23). To independently validate the identifications done by the permit-holding laboratories and Wadsworth Center’s Laboratories of Mycology, addi-tional subcultures of all isolates were prepared and submitted to the Mycology Reference Laboratory at the University of Texas Medical Branch, Galveston. All CPT results refer only to 452 of 466 viable specimens (97%) on which both confirmatory laboratories agreed on the identification.
Statistical methods.The sparseness of available OPT and CPT data necessi-tated pooling results from all participating laboratories. These aggregated data were examined for the possibility of combining test and collection events and again pooled. Because many of the fungi were infrequently seen in either a clinical setting or OPT, the doubly pooled data were coalesced further into four groups of related molds (I to IV) and two groups of yeasts (V and VI). However, the test results for individual organisms were retained for analysis whenever
sufficient data had been collected to make statistical comparisons, i.e., for
As-pergillus fumigatus,Trichophyton tonsurans,Candida albicans,Candida
parapsi-losis,Candida tropicalis,Candida glabrata, andCryptococcus neoformans.
Error rates were estimated by maximum likelihood (11) with truncated Pois-son distributions (22), which account for laboratories’ multiple encounters with the same organism. The resulting error rate parameter estimates, which vary directly with the ease with which an organism or group could be identified, were tested for statistically significant OPT and CPT differences by using a likelihood ratio goodness of fit test (4).
The time trends from the more voluminous historical OPT data were assessed by using logistic regression maximum likelihood estimation of the changes in error rates with respect to time (8). The significance of the rate of change (slope) was assessed with a chi-square test. All programming, which is available upon request, was done in APL (29).
RESULTS
Over 105 laboratories participated in each of the semiannual OPT events between 1982 and 1989. Laboratory participation during the 1989 to 1994 period was stable, with less than 7% turnover in the three or four events per year (data not shown). However, due to the merger of the separate OPT programs operated by the New York City and New York State
Depart-ments of Health, 28 general- and 54 limited-permit laborato-ries joined the program in 1994.
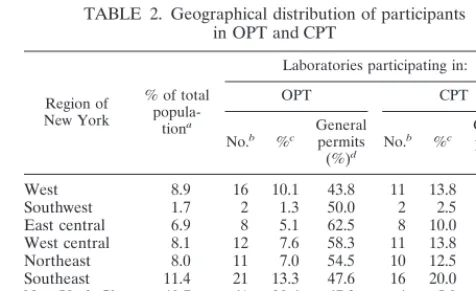
The laboratories participating in the post-1988 OPT and CPT portions of the study were distributed throughout the state in proportion to the size of the populations of each region, except for New York City (Table 2 and Fig. 1). Ap-proximately half (44 to 63%) of the laboratories in each region held general permits. However, since facilities in New York City were not totally integrated into the state OPT program until 1995, there were significantly fewer (P , 0.0001) New York City laboratories that participated in the CPT. CPT sam-ples were collected from fewer non-hospital-based laborato-ries, 16 of 88 (18%), than OPT samples, 49 of 188 (26%), but this difference was not statistically significant (P.0.05).
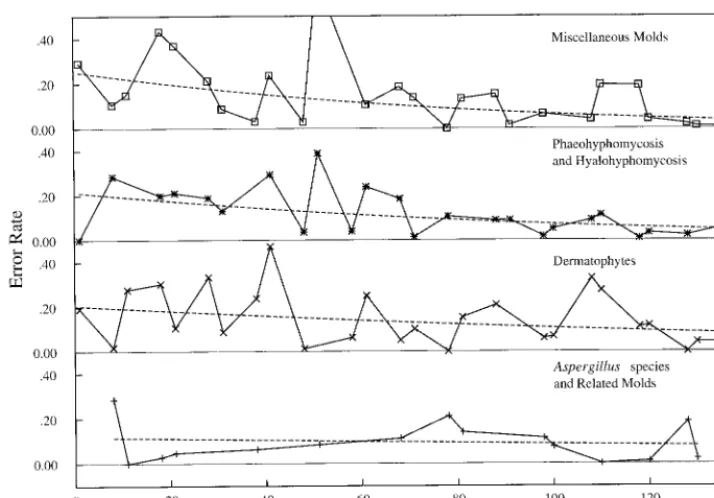
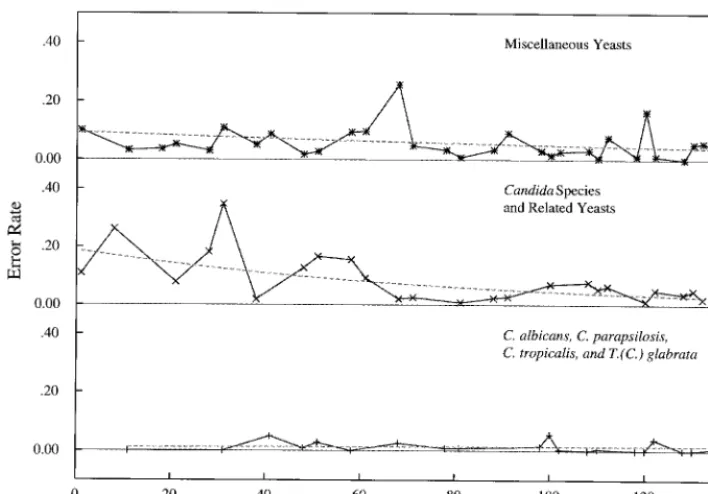
[image:2.612.56.547.84.201.2]The error rates for identifying mold and yeast specimens (Table 3) in OPT events over the combined 1982 to 1994 period are shown in Fig. 2 to 5. Although the identification errors varied considerably among events, logistic regression with respect to time revealed significant longitudinal decreases. This effect was pronounced in the error rates found in the
TABLE 1. Proficiency test event timings for three types of data
OPT CPT
Time
period No. of participantlaboratories Remarks periodTime No. of participantlaboratories Remarks
1982–1987 110–122 Laboratory-specific results not computer-izeda; 10 specimens sent semiannually
1988–1991 108–120 Laboratory-specific results computerized
in 1988b 1988–1989 66
1992–1993 122–131 5 specimens sent quarterly
1994 182–188 5 specimens sent every 4 moc 1993–1994 57 35 laboratories from 1988–1989 CPT
and 22 additional laboratories Total 188 2 OPT periods, before and after 1988
computerization Total 88 2 periods of CPT
aPaper records were not computerized for this study; rather, summary event error rates were used as auxiliary data to estimate longitudinal changes in error rates
prior to 1988 (Fig. 2 to 4).
bComputerized records of laboratory-specific performances permit estimates of organism-specific Poisson error rates after 1988 (Table 4).
cReduction to three events yearly as mandated by CLIA ’88.
TABLE 2. Geographical distribution of participants in OPT and CPT
Region of New York
% of total
popula-tiona
Laboratories participating in:
OPT CPT
No.b %c Generalpermits
(%)d No.
b %c Generalpermits
(%)d
West 8.9 16 10.1 43.8 11 13.8 54.5
Southwest 1.7 2 1.3 50.0 2 2.5 50.0
East central 6.9 8 5.1 62.5 8 10.0 62.5 West central 8.1 12 7.6 58.3 11 13.8 54.5 Northeast 8.0 11 7.0 54.5 10 12.5 50.0 Southeast 11.4 21 13.3 47.6 16 20.0 56.3 New York City 40.7 61 38.6 67.2 4 5.0 100.0 Long Island 14.3 27 17.1 55.6 18 22.5 77.8 Out of statee NA 30 19.0 76.7 8 10.0 100.0
aPercent of New York State population. NA, not applicable.
bNumber of laboratories participating in the mycology proficiency testing
program.
cPercent of laboratories participating in the mycology proficiency testing
pro-gram.
dPercent of laboratories participating in the mycology proficiency testing
program and holding general permits.
eIncludes laboratories participating in the mycology proficiency testing
pro-gram located in 20 states and 1 province of Canada.
on May 15, 2020 by guest
http://jcm.asm.org/
[image:2.612.313.551.510.655.2]identifications of selected mold and yeast test specimens (Fig. 2 and 4). For example, while more than 50% of the participat-ing laboratories could not identifyCunninghamella spp. and about 30% misidentifiedCladophialophora carrionii(syn.
Cla-dosporium carrionii) in 1982, less than 5% of the laboratories holding general permits erroneously identified either of these two molds in 1994. Similarly, 25% or more of the permit-holding laboratories did not appropriately identify Candida rugosa and Candida kruseiwhen first seen as proficiency test specimens in the early 1980s. Less than 2% of the laboratories misidentified these two yeast-like potential pathogens in OPT events in 1993 and 1994, respectively.
Error rates estimates for the OPT and CPT data after Sep-tember 1989 were derived from the number of times labora-tories were tested with a given organism. For example, Table 4 shows that 125 of the 188 permit-holding laboratories were mailed isolates ofHansenula anomalaat least once and that of the 52 laboratories that received the organism in three events, six misidentified it once. The maximum likelihood truncated Poisson error rate estimate is therefore 7.5%. Multiple recov-eries of the same organism, instead of multiple test events, in the CPT portion of this study led to similar data for which the same estimation techniques were employed. Goodness of fit testing for each organism (not shown, except in Table 4) failed to reject the truncated Poisson distribution as an adequate model for the errors.
[image:3.612.55.292.72.239.2]Figures 2 to 5 display initially rapid decreases in error rates that generally tended to stabilize after 1988. A further assess-ment of stability was achieved by utilizing the 1988 to 1994
FIG. 1. Geographical locations of New York State health service areas (Ta-ble 2).
TABLE 3. Identification and grouping of OPT and CPT organisms
Group Type of organism Type of test in which organism appeared
Both OPT and CPTa OPT onlyb CPT onlyc
I Agents of aspergillosis and
close-ly related hyalohyphomycosis Aspergillus fumigatusA. flavus,A. niger (4%), PenicilliumA. glaucusspp.,gr.,AspergillusA. versicolorspp.,gr.,
A. terreus,A. ustusgr.0,
Paecilomy-cesspp.,P. variotii,A. nidulans
II Dermatophytes Trichophyton tonsurans(4%),
Epidermophyton floccosum,
Microsporum canis,
T. rubrum,T. mentagrophytes
Microsporum audouinii,M. gyp-seum,M. nanum, Trichophy-ton terrestre
Microsporum ferrugineum,M. persi-color0,Trichophyton soudanense,
Philophora verrucosum0
III Agents of phaeohyphomycosis
or hyalohyphomycosis Chrysosporiumriumspp.,Exophiliaspp., Cladospo-jeanselmei,Fusariumspp.,
Scopulariopsisspp.,Sporothrix schenckii
Cladosporium carrionii, Exsero-hilum rostratum, Pseudall-escheria boydii, Phialo-phora verrucosa,
Scopulariopsis brumptii,
Wangiella dermatiditis
Acremoniumspp.,Alternariaspp.,
Curvulariaspp.,Neurosporaspp.,
Fonsecaea pedrosoi0,Scytalidium
spp.,Scedosporium apiospermum0,
Scopulariopsis brevicaulis, Exserohi-lum bantiana
IV AllCandidaspecies and closely
related forms Candida albicansC. parapsilosis(6%),(31%),C. tropi-calis(9%),C. glabrata(11%),
C. krusei,C. guilliermondii,
C. lusitaniae,C. rugosa,
C. lipolytica
Candida lambica,C.
paratropi-calis Candidacansandspp.,C. parapsilosisC. famata,C. albi-,
C. humicola,C. kefyr
V Miscellaneous yeast,
basidomy-cetes, and ascomycetes Cryptococcus neoformansBlastoschizomyces capitatus(5%),,
C. albidus,Hansenula anomala,Trichosporon beigelii,
Rhodotorula rubra,R. glutinis,
Saccharomyces cerevisiae
Cryptococcus laurentii,Candida zeylanoides,Geotrichum can-didum,Malassezia pachyder-matis
Rhodotorula pilimanae,Geotrichum
spp.,Candida guilliermondii,
Cryptococcus terreus0,C.
unigut-tulatus0
VI Miscellaneous mold and algae Mucorspp.,Nocardia asteroides,
N. brasiliensis,Prototheca wickerhamii
Chaetomiumspp., Cunningham-ellaspp.,Nocardia otitidiscavia-rum,P. zopfii,Streptomyces
spp.,Syncephalastrumspp.,
Sporobolomyces salmonicolor,
Trichodermaspp., Trichothe-ciumspp.,Ulocladiumspp.
Absidiaspp.0,Auerobasidium
pullu-lans0,Histoplasma capsulatum,
Nocardia caviae,Rhizomucor
spp.0,Rhizopusspp.
aPercentages of some organisms in the CPT samples are shown in parentheses to indicate the degree to which OPT organism selection mimics the frequency of
recovery of these organisms from patient samples.
bOrganisms not observed among the CPT specimens were included in OPT as an educational tool for enhancing the identification capabilities of laboratories. cSome organisms are listed because they were identified only to the genus level by the laboratories. Superscript zeros indicate that the organism was misidentified
in CPT data, suggesting that further education is needed.
on May 15, 2020 by guest
http://jcm.asm.org/
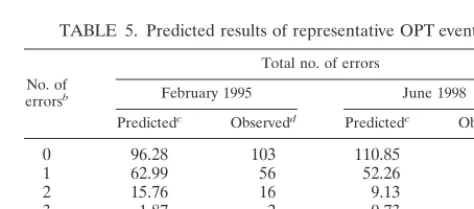
[image:3.612.55.555.359.685.2]OPT results to predict the expected number of errors in post-1994 OPT events, before the results were observed. The pre-dicted and observed numbers of errors are shown in Table 5 for representative 1995 and 1998 events. In the 1995 prediction the organisms listed in Table 4 were used as the test samples. ThePvalues of 0.93 for 1995 and 0.72 for 1998 indicate that the predictions cannot be differentiated statistically from the observed results.
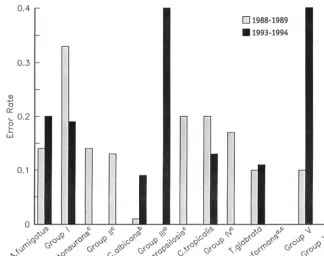
Thirteen organism-specific and grouped error rates estimat-ed from CPT samples collectestimat-ed in 1988 and 1989 were com-pared to those collected in 1993 and 1994. No significant dif-ferences were detected between the two time periods (Fig. 6). Error rates in the identification of the majority of those individual fungi for which sufficient data were collected for comparative analysis were found to be statistically significantly greater in CPT than in OPT (Fig. 7). While none of the
par-FIG. 2. OPT error rates observed in 1982 to 1994 for defined mold groups (Table 3). Dashed lines, associated logistic regression curves.
FIG. 3. OPT error rates for the five individual molds showing the greatest decreases between 1982 and 1994. Symbols indicate the observed percentages of errors committed at each event. Dashed lines, associated logistic regression curves. All decreases were statistically significant (P,0.002).
on May 15, 2020 by guest
http://jcm.asm.org/
[image:4.612.125.482.71.320.2]ticipating laboratories misidentifiedA. fumigatusin OPT spec-imens, greater than 25% (P , 0.002) of the isolates of this clinically significant mold were not correctly identified when recovered from routine clinical specimens (CPT). Similarly, almost all laboratories appropriately identifiedC. parapsilosis, C. tropicalis, andC. glabrata in OPT events, but about 15% (P,0.005,P,0.004, andP,0.005, respectively) of these yeasts were misidentified when isolated as part of routine
workloads. The miscellaneous yeasts placed into group V were also significantly more difficult to identify in CPT than as part of an OPT event (P,0.008).
[image:5.612.123.477.72.319.2]In contrast, there were no differences in the error rates found in OPT and CPT in the identification ofC. albicans (11 versus 10%) andT. tonsurans(10 versus 12%). While there were differences from CPT in the capability of participating laboratories to identify members of groups I to IV (13 to 25
FIG. 4. OPT error rates observed in 1982 to 1994 for defined yeast groups (Table 3). Dashed lines, associated logistic regression curves.
FIG. 5. OPT error rates for the five individual yeasts showing the greatest decreases between 1982 and 1994. Symbols indicate the observed percentages of errors committed at each event. Dashed lines, associated logistic regression curves. All decreases were statistically significant (P,0.007).
on May 15, 2020 by guest
http://jcm.asm.org/
CPT isolates) and group VI (three CPT isolates) when pre-sented in OPT events, small sample sizes prevented these dif-ferences from becoming statistically significant.
DISCUSSION
The inferences drawn from this observational study are in-fluenced by its design, which did not randomly select labora-tories and compare their matched OPT and CPT performance through time. There is therefore a possibility that differential selection biases and participant turnover may have influenced the results. While the 188 OPT participants are a census, the 88 CPT participants were haphazardly selected, except that New York City laboratories were underrepresented. This would be more troubling if there was not a high correlation of laboratory location with regional population size to suggest that urban laboratories continue to be represented in the CPT in other regions of the state. The failure to find differences between the two time periods in which CPT samples were collected is an indicator that the inclusion of 22 new laboratories among the 1993 and 1994 CPT participants did not introduce biases into the estimated error rates. Similarly, the low number of partic-ipating laboratory changes in the OPT data suggests that this contribution to bias was likely to be small. Finally, the maximal OPT turnover was due to the introduction of new laboratories in the last two events, and these have the smallest influence on the error rate estimates, which are largely controlled by labo-ratories with multiple-event organism-specific errors.
Permit holders must identify 80% of test specimens in two of three consecutive OPT test events in order to qualify for and maintain their permits. In contrast, for the purposes of this study, species-specific identification errors were used to com-pare laboratory performances in OPT and CPT. Ideally, pre-cise species-specific error rates would be estimated from a large data pool collected under both testing modes from each laboratory on a single date. The effect of pooling the data, re-quired by the small numbers of samples, can be examined by noting that of the 125 laboratories who participated in at least five OPT events from 1988 to 1994, 79 (63%) had less than 10% misidentifications, 39 (31%) misidentified 10 to 15%, and 7 (6%) had more than 15% misidentifications. Compared to a 10% misidentification rate for the majority of facilities four of the seven with more than 15% errors displayed significantly higher errors (P,0.05). Nevertheless, the distribution of errors
dis-played by all the laboratories is a continuum starting from a minimum of 1.3% and ending at the maximum of 22.4% (data not shown). Since all laboratories were pooled, the degree of the observed differences therefore depends on the inclusion of a few laboratories with noticeably poor performance.
Although it is possible that grouping could obscure differ-ential performance with a particular organism, segregating out such candidates in these data will not identify additional sig-nificant differences due to the small sample sizes. Coalescing the data into six groups, in addition to selected individual organisms, has resulted in detecting differences between CPT and OPT performances only for group V, miscellaneous yeast. In group V the OPT organism most difficult to identify was Geo-trichum candidum, with 38 of 131 (29%) samples misidentified. No confirmed identified isolates of this organism were recov-ered in CPT. The corresponding group V CPT error estimates are therefore presumably smaller than ifG. candidumhad been recovered. Grouping, by retaining a difficult organism in only the OPT part of the comparison, has therefore introduced a bias diminishing the estimated OPT-CPT differences.
[image:6.612.55.551.84.215.2]The significantly decreasing error rates in identification of mold and yeast test specimens found in the longitudinal OPT
TABLE 4. Truncated Poisson parameters estimated from OPT events, 1988 to 1994
Organism Estimated Poissonerror rate Goodnessof fita
Cumulative performance
Total no. of
laboratories (mo/day/yr)Event date
No. of test
eventsb
No. of times misidentifiedc
0 1 2 3
Cryptococcus laurentii 0.061656 0.41 1 18 0 —d — 18 9/14/90
2 105 8 0 — 113 5/20/93
Malassezia pachydermatis 0.175258 1.00 1 97 17 — — 114 2/15/91
Hansenula anomala 0.074587 0.75 1 60 2 — — 62 9/15/89
2 10 1 0 — 11 1/09/92
3 46 6 0 0 52 9/23/93
Candida rugosa 0.140923 0.83 1 4 1 — — 5 1/09/92
2 53 6 1 — 60 0/10/92
Torulopsis candida 0.201835 1.00 1 109 22 — — 131 5/20/93
aPvalues indicating the truncated Poisson distribution fits with historical specific error rates, i.e., values of,0.05 indicate poor agreement with the modeled error rates.
bNumber of test events in which the organism was used from 1988 to 1994, e.g.,C. laurentiiwas used in two test events (18 laboratories received it in 1990 only and
113 laboratories received it in both 1990 and 1993).
cNumber of laboratories misidentifying the organism the stated number of times, e.g., eight laboratories misidentifiedC. laurentiiin one test event, but none of the
laboratories misidentified the organism twice. Of the 244C. laurentiiidentifications eight were incorrect.
d—, no labs were sent the organism the indicated number of times.
TABLE 5. Predicted results of representative OPT eventsa
No. of
errorsb
Total no. of errors
February 1995 June 1998
Predictedc Observedd Predictedc Observedd
0 96.28 103 110.85 125
1 62.99 56 52.26 38
2 15.76 16 9.13 10
3 1.87 2 0.73 0
4 0.10 0 0.03 0
5 0.00 0 0.00 0
aOverall goodness of fit involves combining the organism-specific Poisson
distributions to provide the predicted distribution of total errors. These can be compared to the observed errors by using a chi-square statistic to assess if this
procedure successfully predicts OPT event outcomes (P50.93 and 0.72, each on
5 degrees of freedom, for 1995 and 1998, respectively).
bTotal number of misidentifications in the test event.
cTotal number of laboratories predicted to make the indicated number of
misidentifications in the test event.
dTotal number of laboratories which actually made the indicated number of
misidentifications in the test event.
on May 15, 2020 by guest
http://jcm.asm.org/
[image:6.612.313.550.543.647.2]portion of the study provide evidence that OPT is useful as an educational tool and thereby successfully fulfills one of its goals (25). Coupling this with the low laboratory turnover suggests that the presentation of clinically significant fungi in OPT
events is correlated with improved OPT performance over time. Many of the OPT events were composed of organisms rarely seen in patient samples (Table 3), encouraging partici-pants to enhance their identification capabilities. This
contrib-FIG. 6. Grouped and organism-specific comparison of CPT error rates from 1988 to 1989 and 1993 to 1994 (Table 3). No errors were observed in 1990 data for
some groups (a).C. albicanshad only one error in 81 (1%) specimens from 1988 to 1989 but seven errors in 77 (9%) specimens from 1994 to 1995 (P50.02) (b).
However, the figure displays 13 simultaneous comparisons so an appropriate significance level is calculated by the following equation: 0.05/1350.003. No errors were
[image:7.612.141.466.72.328.2]observed in data for some groups (c).
FIG. 7. Grouped and organism-specific comparison of OPT and combined CPT error rates from 1988 to 1994 (Table 3). For some groups no errors were observed in OPT (a), in CPT (b), or in all data (c).
on May 15, 2020 by guest
http://jcm.asm.org/
uted to more than 95% of the laboratories correctly identifying mold and/or yeast specimens in each of the later OPT events. Error rates for many of the test organisms employed in OPT were found to be so consistent over the later portion of the study period, 1988 to 1994, that 1995 to 1998 event results could be predicted prior to the shipment of test specimens. A control group of laboratories sampled over the same time period but not subjected to OPT is needed to confirm that the improvement was due solely to the state OPT. Although such control laboratories do not exist, participants indicated that greater efforts were expended to correctly identify isolates, particularly after failures in the early 1980s.
Improved OPT performance may or may not indicate that the diagnostic capabilities of participating laboratories si-multaneously improve. The CPT study examined patient specimens from permitted laboratories during two periods of recent performance and found no significant changes in error rates. The differences between the OPT and CPT per-formances, discovered by putting the analysis on an organism-or group-specific basis, corganism-orrespond to the relative difficulty of the identification. Commonly seen and easily identified fungi such asC. albicansandT. tonsuranswere misidentified about 10% of the time under both protocols. The differential mis-identification rates ofA. fumigatus,C. parapsilosis,C. tropicalis, C. glabrata, and group V organisms are disquieting. These differences may, in part, be due to OPT’s use of ideal repre-sentatives monocultured under optimum growth conditions. Alternatively, laboratories have the motivation and opportu-nity to expend greater efforts examining OPT isolates. For example, the 25% higher misidentification rate for CPT iso-lates ofA. fumigatuscould be due to some laboratories’ omit-ting parts of the standard techniques used in the identification of this organism when it is recovered from patient specimens. There are several other ways that laboratories can favorably affect OPT performance. For administration reasons schedules of OPT events are announced at the beginning of each year. This information permits participants to optimize their per-formance by coincidentally scheduling reagent renewals and maintenance activities. Additionally, there is sufficient volume in some test categories’ OPT samples for laboratories to per-form multiple tests and report either the best result or elimi-nate outliers and report an average of the remainder. Finally, the most proficient medical mycology staff may be specifically assigned to process the OPT samples and may spend extra time and care in executing each analysis.
This intensive study of the value of OPT in clinical mycology relies on detailed comparisons to error rates found in blind covert retrotesting, i.e., to laboratory performances achieved on actual patient samples. Previous reports on mycology OPT have described the fungi used as test samples and the relation-ship of the volume of samples processed by laboratories with their OPT performances (3, 10, 12, 13, 31). Published analyses of OPTs in mycobacteriology have discussed the effects of the types of identification methods on the results reported by the participating facilities, as well as described test results over time (33). Investigations in other areas of microbiology (14, 32) have dealt solely with the evaluation of OPT test specimens, internal laboratory quality control monitoring (2), or, as here, comparisons of OPT and blinded specimens (5, 6, 24). Rich-ardson et al. (24) compared OPT results with routine work on patient specimens and found that laboratories performing poorly on OPT lacked effective quality control, used nonstand-ard methods, and failed to follow in-house procedure manuals during analyses.
The selection of the current retrospective design was par-tially motivated by the infeasibility of splitting fungal samples.
However, Black and Dorse (5, 6) report on a bacteriology study that used a simulated blind split sample submission de-sign. This design allowed the examination of performance at all stages of normal specimen handling. Their results revealed that some laboratories were unable to isolate organisms from the test specimens confirmed positive. Additionally, they found correct identifications of mucoidEscherichia colidecreased from 94% under OPT to 47% under CPT, as well as large decreases forYersinia enterocolitica(45%) and streptococcal Lancefield group C (13%). Significant variation was also found depending on whether the isolate was from urine, pus, or feces. Additionally, in contrast to the results of this investigation, the most commonly encountered organisms were among the worst handled. These authors suggested that a laboratory’s OPT ability to identify (lyophylized) bacteria has little to do with its performance on normal patient specimens.
Studies of OPTs in quantitative clinical areas, e.g., clinical chemistry, diagnostic immunology, and hematology, etc., have concentrated on its use in evaluating interlaboratory variations associated with specific diagnostic techniques, establishing grad-ing criteria and reviewgrad-ing personnel qualifications (1, 9, 18–20, 30). Hansen et al. (16) found greater than 50% decreases in correct analyses under CPT for barbiturates, amphetamines, cocaine, codeine, and morphine. The authors speculated that the 13 laboratories under study used a higher minimum re-porting level under CPT than under OPT. Inferences about drug testing sensitivity obtained via OPT were therefore arti-ficially inflated. Sargent et al. (26) submitted 53 blinded spec-imens with known blood lead concentrations to 18 laborato-ries. The samples had concentrations more than 30% higher or lower than the Centers for Disease Control and Prevention threshold of 10mg/dl. With respect to this threshold they es-timated the correct classification rate (95% confidence inter-val) to be in the range of 79 to 95%. OPT of about 100 labo-ratories with similar samples in the New York State Blood Lead Proficiency Testing Program typically leads to more than 97% of samples being correctly classified. In contrast, Schalla et al. (27) found no difference between OPT and CPT in examining the results of split samples sent to 262 participants testing for HIV antibodies.
The results of this and previous studies point to limitations on the effectiveness of evaluating a laboratory’s capability in medical mycology under the OPT paradigm. The scheme man-dated by CLIA ’88 introduces further limitations. Fifteen spec-imens, presuming they were all of a single species whose nom-inal error rate is 0, are sufficient to identify only laboratories with greater than a 25% error rate (atP50.05). However, test events are actually composed of a mixture of specimens of differing difficulties (Table 3), where the average nominal error rate is closer to 10% than to 0. In this case 15 specimens, three events with nominal 10% rates, are sufficient to identify only laboratories with greater than a 40% error rate. Various ad-justments to the scoring scheme further inflate the error rate at which poor performers are identified. For example, the OPT error rates found for Torulopsis candida, Blastoschizomyces capitatus,G. candidum, andCandida lipolyticaexceed 20%, but all laboratories received passing scores under the rule requir-ing specimens with less than 80% correct responses to be declared invalid.
We have considered in detail the open aspect of the CLIA ’88 testing scheme by comparing OPT species-specific results to double-blind covert testing. For easily identified species, such asC. albicans, blinding the testing appears to make little difference. For “difficult” species, such asA. fumigatus, whose nominal error rate in OPT is close to 0, the open testing protocol fails to identify laboratories whose usual error rate in
on May 15, 2020 by guest
http://jcm.asm.org/
the identification of patient specimens exceeds 65%. These results, as well as the cited concordant literature, clearly indi-cate the need for improving proficiency testing schemes for some analytes.
OPT is only one of the tools used to maintain and improve the quality of clinical laboratory services. In addition to labo-ratories’ routine internal quality control practices, they are reg-ularly inspected to check adherence to testing protocols, vali-dation procedures, and schedules for the maintenance and calibration of instrumentation. Additionally, regulators pro-vide consultation services to laboratories actively seeking to improve the quality of their tests, changing testing procedures, or failing OPT. Nevertheless, open testing’s primary impor-tance derives from the CLIA ’88 specification that the issuance and maintenance of state and federal licenses to conduct clin-ical testing depend upon laboratories meeting the specified OPT passing criteria. The CPT portion of this study suggests that improvements to OPT could be achieved by supplement-ing normal open testsupplement-ing with a sentinel system of blind testsupplement-ing with difficult specimens. The obstacles and extra costs associ-ated with submissions and retrospective reanalyses are not insurmountable. One solution is to administer CPTs to sequen-tial participant subsets preferensequen-tially constructed from labora-tories with marginal performances. Even if only a portion of the participants are to be tested, simply announcing the implemen-tation of such a sentinel system is likely to favorably impact performances on routine patient specimens at all laboratories. The data presented suggest that (i) additional studies should be conducted to enhance efficient statistical comparisons of fungal identification error rates between OPT and CPT, (ii) OPT is not an effective mechanism for evaluating the ability of clinical mycology laboratories to identify all medically impor-tant fungi, and (iii) CPT, despite its high costs and adminis-trative problems, should be used on a selective basis to aug-ment OPT to obtain clearer perspectives of the performance of clinical mycology laboratories (25, 28).
ACKNOWLEDGMENTS
This project was supported under a cooperative agreement from the Centers for Disease Control and Prevention through the Association of Schools of Public Health.
Special thanks go to Vishnu Chaturvedi, current director of the New York State Laboratories for Mycology and the Mycology Proficiency Testing Program, for supporting and reviewing the manuscript. Addi-tional thanks go to John Qualia and Teresa Wilson for assisting with database management and computer program development.
REFERENCES
1.Bakken, L. L., K. L. Case, S. M. Callister, N. J. Bourdeau, and R. F. Schell.
1992. Performance of laboratories participating in a proficiency testing
pro-gram for Lyme disease serology. JAMA268:891–895.
2.Bartlett, R. C., M. Mazens-Sullivan, J. Z. Tetreault, S. Lobel, and J. Nivard.
1994. Evolving approaches to management of quality in clinical
microbiol-ogy. Clin. Microbiol. Rev.7:55–88.
3.Bartola, J.1988. The importance of an effective proficiency testing program to the regulation of clinical laboratories. The view from one state. Arch.
Pathol. Lab. Med.112:368–370.
4.Bishop, Y. M. M., S. E. Fienberg, and P. W. Holland.1975. Discrete multi-variate analysis: theory and practice, p. 123–155. MIT Press, Cambridge, Mass.
5.Black, W. A., and S. E. Dorse.1976. A regional quality control program in
microbiology. I. Administrative aspects. Am. J. Clin. Pathol.66:401–406.
6.Black, W. A., and S. E. Dorse.1976. A regional quality control program in microbiology. II. Advantages of simulated clinical specimens. Am. J. Clin.
Pathol.66:407–415.
7.Boone, D. J., H. J. Hansen, T. L. Hearn, D. S. Lewis, and D. Dudley.1982. Laboratory evaluation and assistance efforts: mailed, on-site and blind pro-ficiency testing surveys conducted by the Centers for Disease Control. Am. J.
Public Health72:1364–1368.
8.Cox, D. R.1970. Analysis of binary data, p. 87–94. Methuen & Co., Ltd., London, England.
9.Dayian, G., D. L. Morse, G. D. Schryver, R. W. Stevens, G. S. Birkhead, D. J. White, and K. E. Hechemy.1994. Implementation of a proficiency testing program for Lyme disease in New York State. Arch. Pathol. Lab. Med.
118:501–505.
10. Dolan, C. T.1974. A summary of the 1972 mycology proficiency testing survey
of the College of American Pathologists. Am. J. Clin. Pathol.61:990–993.
11. Edwards, A. W. F.1992. Likelihood: an account of the statistical concept of likelihood and its application to scientific inference, rev. ed. Johns Hopkins University Press, Baltimore, Md.
12. Fuchs, P. C., and C. T. Dolan.1981. Summary and analysis of the mycology proficiency testing survey results of the College of American Pathologists.
Am. J. Clin. Pathol.76:538–543.
13. Griffin, C. W., III, M. A. Mehaffey, E. C. Cook, S. O. Blumer, and P. A. Podeszwik.1986. Relationship between performance in three of the Centers for Disease Control microbiology proficiency testing programs and the num-ber of actual patient specimens tested by participating laboratories. J. Clin.
Microbiol.23:246–250.
14. Griffin, C. W., III., E. C. Cook, and M. A. Mehaffey.1986. Centers for Disease Control performance evaluation program in bacteriology: 1980 to
1985 review. J. Clin. Microbiol.24:1004–1012.
15. Hamlin, W.1992. Proficiency testing as a regulatory device: a CAP
perspec-tive. Clin. Chem.38:1234–1236.
16. Hansen, H. J., S. P. Caudill, and D. J. Boone.1985. Crisis in drug testing.
Results of CDC blind study. JAMA253:2382–2387.
17. Howanitz, P. J.1988. Use of proficiency test performance to determine
clinical laboratory director qualifications. Arch. Pathol. Lab. Med.112:349–
353.
18. Hurst, J., K. Nickel, and L. H. Hilborne.1998. Are physicians’ office labo-ratory results of comparable quality to those produced in other labolabo-ratory
settings? JAMA279:468–471.
19. Jenny, R. W., and K. Y. Jackson.1992. Evaluation of the rigor and appro-priateness of CLIA ’88 toxicology proficiency testing standards. Clin. Chem.
38:496–500.
20. Jenny, R. W., and K. Y. Jackson.1993. Proficiency test performance as a predictor of accuracy of routine patient testing for theophylline. Clin. Chem.
39:76–81.
21. Luntz, M. E., B. M. Castleberry, and K. James.1992. Laboratory staff qualifications and accuracy of proficiency test results. Arch. Pathol. Lab.
Med.116:820–824.
22. Matsunawa, T.1986. Poisson distribution, p. 20–25.InS. Kotz and N. L. Johnson (ed.), Encyclopedia of statistical science, vol. 7. John Wiley & Sons, New York, N.Y.
23. Merz, W. G., and G. D. Roberts.1995. Detection and recovery of fungi from
clinical specimens, p. 709–722.InP. R. Murray, E. J. Baron, M. A. Pfaller,
F. C. Tenover, and R. H. Yolken (ed.), Manual of clinical microbiology, 6th ed. ASM Press, Washington, D.C.
24. Richardson, H., D. Wood, J. Whitby, R. Lannigan, and C. Fleming.1996. Quality improvement of diagnostic microbiology through a peer-group pro-ficiency assessment program. A 20-year experience in Ontario. The
Micro-biology Committee. Arch. Pathol. Lab. Med.120:445–455.
25. Salkin, I. F., R. J. Limberger, D. Stasik.1997. Commentary on the objectives
and efficacy of proficiency testing in microbiology. J. Clin. Microbiol.35:
1921–1923.
26. Sargent, J. D., L. Johnson, and S. Roda.1996. Disparities in clinical labo-ratory performance for blood lead analysis. Arch. Pediatr. Adolesc. Med.
150:609–614.
27. Schalla, W. O., S. O. Blumer, R. N. Taylor, H. W. Muir, J. S. Hancock, E. E. Gaunt, S. K. Seilkop, S. S. Huges, D. A. Holzworth, and T. L. Hearn.1995. HIV blind performance evaluation: a method for assessing HIV-antibody
testing performance, p. 409.InJ. M. Krolak, A. O’Connor, and P. Thompson
(ed.), Institute on critical issues in health laboratory practice: frontiers in laboratory practice research. U.S. Department of Health and Human Ser-vices, Public Health Service, Centers for Disease Control and Prevention, Atlanta, Ga.
28. Shahangian, S. 1998. Proficiency testing in laboratory medicine. Arch.
Pathol. Lab. Med.122:15–30.
29. STSC, Inc.1991. APL*PLUS II system for Unix, version 4. STSC, Inc., Rockville, Md.
30. Stull, T. M., T. L. Hearn, J. S. Hancock, J. H. Handsfield, and C. L. Collins.
1998. Variation in proficiency testing performance by testing site. JAMA
279:463–467.
31. Wilson, M. E., Y. C. Faur, S. Schaefler, I. Weitzman, M. H. Weisburd, and M. Schaeffer.1977. Proficiency testing in clinical microbiology: the New
York City program. Mt. Sinai J. Med.44:142–163.
32. Woods, G. L., and J. A. Bryan.1994. Detection ofChlamydia trachomatisby direct fluorescent antibody staining. Results of the College of American Pathologists proficiency testing program, 1986–1992. Arch. Pathol. Lab.
Med.118:483–488.
33. Woods, G. L., T. A. Long, and F. G. Witebsky.1996. Mycobacterial testing in clinical laboratories that participate in the College of American Pathologists mycobacteriology surveys—changes in practices based on responses to 1992,
1993, and 1995 questionnaires. Arch. Pathol. Lab. Med.120:429–435.