Response Surface Methodology For optimisation of hot
air drying of water yam slices
Aneke, N.A.G., Mbah, G.O. and Edeani, N. J*.
Department Of Chemical Engineering,
Enugu State University Of Science And Technology Enugu. [email protected] Corresponding author: [email protected]
DOI: 10.29322/IJSRP.8.8.2018.p8030 http://dx.doi.org/10.29322/IJSRP.8.8.2018.p8030
Abstract
: Response surface methodology was used to investigate the effects of temperature, thickness and time on the drying ofwater yam slices and to determine the optimised condition for hot air drying. The predominant falling rate drying regime was observed. Experiments were performed at air temperature of 60oC, 70oC and 80oC, slice thickness of 4, 6 and 8mm and drying times of 60, 165 and 270minutes. Based on response surface and desirability functions, the optimum conditions for water yam drying were: air temperature70OC, 74.9OC, slice thickness 6mm, 6.6mm and drying time 165minutes, 116.1minutes for untreated and treated water yam respectively. At this point, the predicted responses for drying rate were 0.000345kg/m2s, 0.000358kg/m2s respectively.
Keywords: water yam, temperature, slice thickness, drying time, hot air drying, optimisation.
1.0 INTRODUCTION
Water yam is the most economically important yam species which serve as a staple food for millions of people in tropical and subtropical countries. It is a crop with potential for increased consumer demand due to its low sugar content necessary for diabetic patients (Oluwole et al, 2017). In Nigeria, Water yam (D. alata) is another important species of the dioscoreacea family grown in some parts of Nigeria for its large roots with fine edible white fleshes. It seems unnoticed when compared to other varieties of yam and is often regarded as food for the poor (Hoover, 2000). According to Baah, 2009 water yam contains high level of Total Dietary Fibre (TDF) which makes it suitable for management of pile, constipation and diabetes. It is also rich in Vitamin C, beta carotene, vitamin E, calcium, potassium, magnesium, copper and antioxidants. These nutrients are known to play vital role in general body upkeep as well as immune functioning, wound healing, suppression of blood sugar, bone growth and anti-ageing. Dried water yam slices are used as an excellent source of starch, which provides calorific energy, suitable for producing weaning foods. Processed water yam flour and slices have a high market price internationally than cassava slices (Baah, 2009). They provide protein three times more superior than the one of cassava and sweet potato. Processing of the tubers into a more stable product will increase shelf life and availability, and enhance its utilization. One potential problem in processing of water yam into chips is the discolouration and darkening of the product. This has been attributed to enzymic browning reactions as a result of the presence of water soluble phenolic substances in yam (Akubor, 2013). Pretreatment methods such as blanching, sulphating and dripping into oil have contributed to the improved mass and heat transfer as well as product characteristics (colour, texture, vitamin retention, etc) of food (Kaymak-Ertekin,2002, Taiwo et al, 2002)
Drying is a complex process accompanied by physical and structural changes. There is a continuous change in the dimensions of differently shaped food particulates during drying as a result of water removal and internal collapse of the particulates (Senadeera et al., 2005). The drying process is the use of products with low water activity, thereby inhibiting the production of microbial reproduction and enzyme activity, and can give the flavor of a good product to achieve long-term storage, easy to transport, easy to consumer spending. (Aboltins,and Upitis, 2011) Optimisation is required to ensure rapid processing while maintaining optimum product quality. Response surface methodology is a powerful tool for optimizing of many engineering applications probably because of its high efficiency, simplicity, and comprehensive theory. It can save a lot of time and can build models accurately and quickly in an optimization design (Nazghelichi et al, 2011). It has been frequently used in the optimisation of food processes(Varnalis et al, 2004,Wani et al, 2008). The aim of this study was :(a)to investigate drying behaviour of water yam (b) to study the effect of independent variable on the dependent variable and (c) optimization of the water yam drying in a hot air dryer.
2. MATERIALS AND METHODS
2.2 Experimental procedure: The samples were peeled with a stainless knife and cut into chips of different thickness of 4mm, 6mm and 8mm using vernier caliper. The sliced samples was pretreated by soaking for 5 min in 0.5% sodium metabisulphite (Na2S2O5) solution..There were treated and untreated samples for each. The initial moisture content was determined according to
official method (AOAC, 2004). The chips were loaded into the hot air dryer for drying process. Steady state of temperatures was achieved in the dryer before the chips were loaded. The drying process was performed at 600C, 700C and 800C. The samples were removed from the dryer and weighed manually at 30 minutes interval to monitor moisture loss. Drying process was truncated when two consecutive sample weights remained constant. The experiments were replicated.
[image:2.595.34.561.259.554.2]2.3: Experimental design matrix: The experiment was designed using Response surface methodology (RSM) of design expert software 11. Central Composite Design (CCD), face center, tool was used in the design process. Temperature, thickness and time were the considered factors while moisture content and drying rate were the expected responses of the study. The design matrix for the experiments is shown in Table 1. The RSM was used to analyze the responses. The ANOVA and graphical analyses of the drying were carried out. The mathematical models in terms of coded were obtained. The models in terms of coded factors were used to make predictions about the response for given levels of each factor. The high levels of the factors were coded as +1 and the low levels of the factors were coded as -1. Optimum drying parameters were also obtained, and the results were validated using percentage deviation.
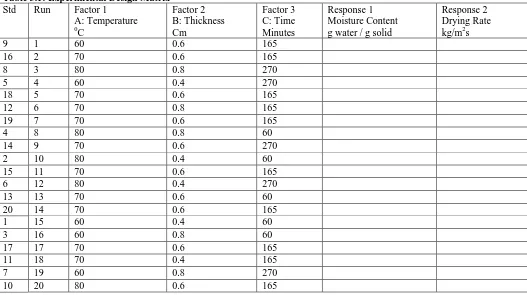
Table 3.1: Experimental Design Matrix Std Run Factor 1
A: Temperature
0
C
Factor 2 B: Thickness Cm
Factor 3 C: Time Minutes
Response 1 Moisture Content g water / g solid
Response 2 Drying Rate kg/m2s
9 1 60 0.6 165
16 2 70 0.6 165
8 3 80 0.8 270
5 4 60 0.4 270
18 5 70 0.6 165
12 6 70 0.8 165
19 7 70 0.6 165
4 8 80 0.8 60
14 9 70 0.6 270
2 10 80 0.4 60
15 11 70 0.6 165
6 12 80 0.4 270
13 13 70 0.6 60
20 14 70 0.6 165
1 15 60 0.4 60
3 16 60 0.8 60
17 17 70 0.6 165
11 18 70 0.4 165
7 19 60 0.8 270
10 20 80 0.6 165
2.4 Effective moisture diffusivity
The simplified equation of Fick’s law of moisture diffusion was adapted to determine the effective moisture diffusion from the samples during drying. It is simplified according to Srikiatden and Roberts, (2005) which is represented thus:
𝑀𝑅=𝑀𝑜−𝑀𝑒𝑀−𝑀𝑜 = 𝑛82∑(2𝑛−11 )2 𝑒𝑥𝑝
(−2𝑛−1)2𝜋2𝐷𝑒𝑓𝑓𝑡
412 − − − − − − − − −2.1
Where Deff is the moisture diffusivity (m2/s), t is the drying time (s), l is the half of the slab thickness (m), MR= dimensionless moisture ratio, Mi = instantaneous moisture content (g water/g solid), Me =equilibrium moisture content (g water/ g solid), Mo = initial moisture content (g water/ g solid). However, due to continuous fluctuation of relative humidity of the drying air in the dryer, equation 5 is simplified in equation 6 according to Dimente and Munro, (1993) and Goyal et al., (2007).
𝑀𝑅=𝑀𝑜𝑀𝑖= 𝑛82∑(2𝑛−11 )2 𝑒𝑥𝑝
(−2𝑛−1)2𝜋2𝐷𝑒𝑓𝑓𝑡
k =𝐷𝑒𝑓𝑓𝑡412 − − − − − − − − − − − − − − − −2.3
Where k is the slope. The model that best described the drying behaviour of the samples was used to evaluate the moisture diffusivity of the samples.
3 RESULTS AND DISCUSSION
3.1 Proximate analysis of water yam
[image:3.595.32.511.250.433.2]The proximate analyses of the water yam are presented in Table (3.1). Proximate analysis was used to characterize each of the samples in terms of moisture, ash, lipid, fiber, protein and carbohydrate contents. Table shows the characteristics of the raw samples with moisture content having the highest percentage in all the cases. Table presents also the proximate analyses (at drying temperature of 600C,700C and 800C) of the treated and untreated food samples respectively. The moisture content reduced drastically with corresponding increase in percentage of the carbohydrate. The application of heat caused the evaporation of water from the samples. This observation is in agreement with previous findings (Kared and Lund (2003), Velic et al., 2007. It was also revealed that the reductions of moisture content were relatively higher in the treated samples compared to the untreated samples. Table 3.2: Proximate analysis for treated and untreated water yam
Sample Moisture
(%)
Ash (%)
Lipid (%) Fiber (%) Protein (%)
Carbohydrate (%)
Raw Water Yam 76.34 1.83 2.86 2.70 1.93 12.77
Treated Water yam @ 600C
4.55 1.60 2.50 2.55 1.76 87.04
Untreated Water yam @ 600C
3.90 1.50 2.40 2.50 1.70 88.00
Treated Water yam @ 700C
3.70 1.30 2.35 2.55 1.60 88.50
Untreated Water yam @ 700C
3.20 1.20 2.25 2.18 1.50 89.67
Treated Water yam @ 800C
2.80 1.25 2.15 2.18 1.48 90.14
Untreated Water yam @ 800C
2.20 0.77 2.05 1.49 1.43 92.06
3.2 Moisture Contents of the samples
[image:3.595.37.419.607.761.2]The results of the moisture content versus time of the treated samples at various temperatures and thickness are presented in Figures 3.1-3.6. From the graphs, moisture content decreases with time in an exponential manner. The graphical results revealed that moisture content continued to decrease till the equilibrium point. The final moisture content of each of the sample represent moisture equilibrium between the sample and drying air under dryer conditions, beyond which any changes in the mass of sample could not occur (Akipnar and Toraman 2013). Moisture content at equilibrium usually decreases with increases in temperature (Barbosa-Canovas and Juliano, 2007). The results gotten are in agreement with the observation of many researches (Doymaz 2005, Togrul and Pehlivan 2004). The result from the study indicated that samples pretreated with sodium metabisulphite dried faster than the untreated samples. Again, the treated samples showed high degree of lightness. This implies that sodium metabisulphite pretreatment results in some degree of bleaching or prevention of enzymatic browning of the chips. A similar situation was reported by Buckman et al., (2015).
Fig. 3.1: Moisture Content versus Time,Untreated Water Yam at 60 0C y = 1.735e-0.01x
R² = 0.951
y = 1.003e-0.01x R² = 0.950
y = 1.159e-0.01x R² = 0.919
0 0.2 0.4 0.6 0.8 1 1.2 1.4
0 50 100 150 200 250 300 350
M
oi
st
ur
e c
ont
ent
(g
w
at
er
/g
so
lid
Time (minutes)
Fig. 3.2: Moisture Content versus Time, Untreated Water Yam at 70 0C
[image:4.595.34.380.49.549.2]Fig. 3.3: Moisture Content versus Time, Untreated Water Yam at 80 0C
[image:4.595.37.375.559.682.2]Fig. 3.4: Moisture Content versus Time, treated Water Yam at 60 0C
Fig. 3.5: Moisture Content versus Time, treated Water Yam at 70 0C y = 1.694e-0.01x
R² = 0.960
y = 1.120e-0.01x R² = 0.906
y = 0.778e-0.01x R² = 0.971
0 0.2 0.4 0.6 0.8 1 1.2 1.4
0 50 100 150 200 250 300
M oi st ur e c ont ent (g w at er /g so lid Time (minutes) 0.4 cm 0.6 cm 0.8 cm Expon. (0.4 cm ) Expon. (0.6 cm ) Expon. (0.8 cm )
y = 7.464e-0.01x R² = 0.846 y = 3.939e-0.01x
R² = 0.919
y = 3.697e-0.01x R² = 0.951
0 1 2 3 4 5
0 100 200 300
M oi st ur e c ont ent (g w at er /g so lid Time (minutes) 0.4 cm 0.6 cm 0.8 cm
Expon. (0.4 cm ) Expon. (0.6 cm ) Expon. (0.8 cm )
y = 1.984e-0.01x R² = 0.946 y = 1.561e-0.01x
R² = 0.917 y = 1.304e-0.01x R² = 0.940
0 0.5 1 1.5
0 100 200 300 400
M oi st ur e c ont ent (g w at er /g so lid Time (minutes) 0.4 cm 0.6 cm 0.8 cm
Expon. (0.4 cm ) Expon. (0.6 cm ) Expon. (0.8 cm )
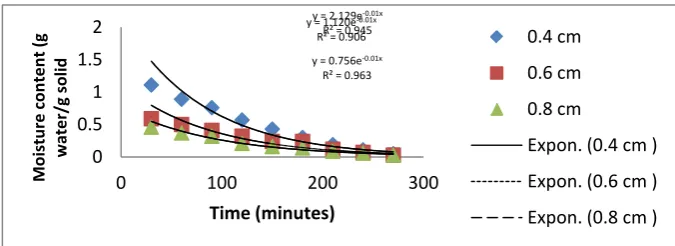
y = 2.129e-0.01x R² = 0.945 y = 1.120e-0.01x R² = 0.906 y = 0.756e-0.01x
R² = 0.963
0 0.5 1 1.5 2
0 100 200 300
M oi st ur e c ont ent (g w at er /g so lid Time (minutes) 0.4 cm 0.6 cm 0.8 cm
Fig. 3.6: Moisture Content versus Time, treated Water Yam at 80 0C
3.3 Relationship between Moisture Ratio and Drying Time
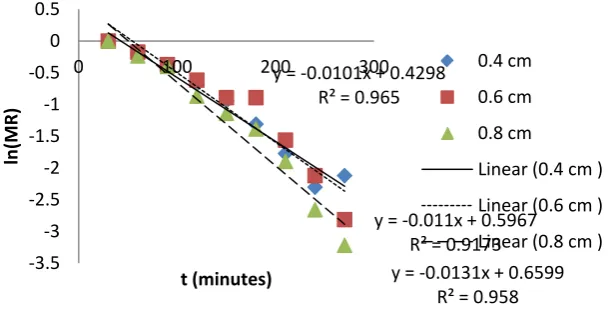
[image:5.595.51.341.303.441.2]The graphs of ln(MR) versus time of the food samples are presented in Figures 3.7-3.12. For each sample, graphs were plotted at various temperatures (60 0C, 70 0C, 80 0C) and sample thickness (0.4cm, 0.6cm and 0.8cm). To attain linear graphs, the data involving dry basis moisture content versus time were transformed to ln(MR) versus time (Akipnar and Toraman, 2013).
Fig. 3.7: ln (MR) versus Time of Untreated Water Yam at 60 0C
Fig. 3.8: ln(MR) versus Time of Untreated Water Yam at 70 0C y = 6.974e-0.02x
R² = 0.824 y = 2.552e-0.01x R² = 0.912 y = 2.587e-0.01x
R² = 0.982
0 1 2 3 4
0 100 200 300
M
oi
st
ur
e c
ont
ent
(g
w
at
er
/g
so
lid
Time (minutes)
0.4 cm 0.6 cm 0.8 cm
Expon. (0.4 cm ) Expon. (0.6 cm ) Expon. (0.8 cm )
y = -0.0101x + 0.4298 R² = 0.965
y = -0.011x + 0.5967 R² = 0.9173 y = -0.0131x + 0.6599
R² = 0.958 -3.5
-3 -2.5 -2 -1.5 -1 -0.5 0 0.5
0 100 200 300
ln
(MR)
t (minutes)
0.4 cm 0.6 cm 0.8 cm Linear (0.4 cm ) Linear (0.6 cm ) Linear (0.8 cm ) y = -0.0123x + 0.6281
R² = 0.9526
y = -0.0104x + 0.5327 R² = 0.9603
y = -0.0102x + 0.5426 R² = 0.9334 -4
-3 -2 -1 0 1
0 100 200 300
ln
(MR)
t (minutes)
[image:5.595.50.355.501.656.2]Fig. 3.9: ln(MR) versus Time of Untreated Water Yam at 80 0C
Fig. 3.10: ln(MR) versus Time of treated Water Yam at 60 0C
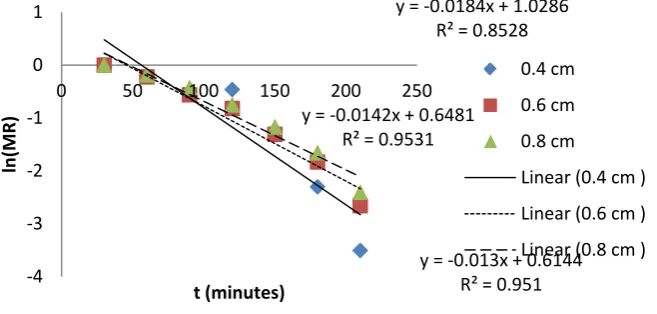
Fig. 3.11: ln(MR) versus Time of treated Water Yam at 70 0C
y = -0.0184x + 1.0286 R² = 0.8528
y = -0.0142x + 0.6481 R² = 0.9531
y = -0.013x + 0.6144 R² = 0.951 -4
-3 -2 -1 0 1
0 50 100 150 200 250
ln
(MR)
t (minutes)
0.4 cm 0.6 cm 0.8 cm Linear (0.4 cm ) Linear (0.6 cm ) Linear (0.8 cm )
y = -0.0085x + 0.4179 R² = 0.9649
y = -0.011x + 0.5891 R² = 0.9448
y = -0.0096x + 0.5343 R² = 0.939 -3
-2.5 -2 -1.5 -1 -0.5 0 0.5
0 100 200 300
ln
(MR)
t (minutes)
0.4 cm 0.6 cm 0.8 cm Linear (0.4 cm ) Linear (0.6 cm ) Linear (0.8 cm )
y = -0.012x + 0.6243 R² = 0.9536
y = -0.011x + 0.5967 R² = 0.9173
y = -0.0104x + 0.4628 R² = 0.9794 -3.5
-3 -2.5 -2 -1.5 -1 -0.5 0 0.5
0 100 200 300
ln
(MR)
t (minutes)
[image:6.595.49.393.467.622.2]Fig. 3.12: ln(MR) versus Time of treated Water Yam at 80 0C
3.4: Effective Moisture Diffusivity for untreated and treated water yam
[image:7.595.32.570.367.504.2]Experimental diffusivities was determined by plotting experimental drying data in terms of In MR against time (minutes).The effective diffusivity was calculated using the method of slopes. Effective moisture diffusivity depends on the moisture content and increases with decrease in moisture content. The values of effective diffusivity for hot air drying of wateryam ranges from 1.1 x 10⁻⁹ to 9.23 x 10⁻¹⁰. This is similar to other crops like apricot, agape and figs (Mahmutoglu et al, 1995, Babalis and Belessiotis 2004).
Table 3.3: Effective moisture diffusivity for untreated and treated water yam
Sample Temperature Effective Moisture Diffusivity X 10-10 m2/s Untreated water
yam (K) 333 Thickness, 0.4cm Thickness, 0.6cm Thickness, 0.8cm
333 3.32 6.32 0.11
343 2.73 6.68 0.14
353 4.97 8.26 0.14
Treated Water Yam 333 2.29 6.68 0.10
343 3.24 6.68 0.11
353 5.97 9.23 0.11
3.5: RSM Results of the Samples
The results of the Response Surface Methodology (RSM) are presented in Tables (3.3-3.4). Each of the Tables presents experimental data of moisture content and drying rate obtained at various drying conditions (factors) of temperature, thickness and time. Unlike data of one factor at a time, the RSM results show the effects of the interaction of the considered factors on the responses. Tables (3.3) present the data for the treated food samples, while those of the untreated samples are shown in Tables (3.4). The variations of drying rate of the treated and untreated samples can be attributed to structural adjustment of the compositions of the treated samples.
Table 3.4: RSM Results for the Untreated Water Yam Std Run Factor 1
A: Temperature
0
C
Factor 2 B: Thickness Cm
Factor 3 C: Time minutes
Response 1 Moisture Content g water / g solid
Response 2 Drying Rate kg/m2s
9 1 60 0.6 165 0.12 0.000345
16 2 70 0.6 165 0.13 0.000343
8 3 80 0.8 270 0.01 0.000623
5 4 60 0.4 270 0.04 0.000314
18 5 70 0.6 165 0.13 0.000343
y = -0.0221x + 1.305 R² = 0.7958
y = -0.0152x + 0.809 R² = 0.9166
y = -0.0102x + 0.3957 R² = 0.9811 -5
-4 -3 -2 -1 0 1
0 50 100 150 200 250
ln
(MR)
t (minutes)
[image:7.595.29.572.685.788.2]12 6 70 0.8 165 0.07 0.000443
19 7 70 0.6 165 0.13 0.000343
4 8 80 0.8 60 1.66 0.000682
14 9 70 0.6 270 0.03 0.000282
2 10 80 0.4 60 2.11 0.000265
15 11 70 0.6 165 0.13 0.000343
6 12 80 0.4 270 0.02 0.000177
13 13 70 0.6 60 0.5 0.000439
20 14 70 0.6 165 0.13 0.000343
1 15 60 0.4 60 0.64 0.000566
3 16 60 0.8 60 0.49 0.000439
17 17 70 0.6 165 0.13 0.000343
11 18 70 0.4 165 0.24 0.000321
7 19 60 0.8 270 0.04 0.000331
[image:8.595.33.565.179.593.2]10 20 80 0.6 165 0.34 0.000423
Table 3.5: RSM Results for the Treated Water Yam Std Run Factor 1
A: Temperature
0
C
Factor 2 B: Thickness Cm
Factor 3 C: Time minutes
Response 1 Moisture Content g water / g solid
Response 2 Drying Rate kg/m2s
9 1 60 0.6 165 0.15 0.000309
16 2 70 0.6 165 0.13 0.000374
8 3 80 0.8 270 0.06 0.000319
5 4 60 0.4 270 0.11 0.000308
18 5 70 0.6 165 0.13 0.000374
12 6 70 0.8 165 0.09 0.000353
19 7 70 0.6 165 0.13 0.000374
4 8 80 0.8 60 1.34 0.000341
14 9 70 0.6 270 0.03 0.000318
2 10 80 0.4 60 1.91 0.000106
15 11 70 0.6 165 0.13 0.000374
6 12 80 0.4 270 0.02 0.000152
13 13 70 0.6 60 0.5 0.000439
20 14 70 0.6 165 0.13 0.000374
1 15 60 0.4 60 0.79 0.000439
3 16 60 0.8 60 0.51 0.000444
17 17 70 0.6 165 0.13 0.000374
11 18 70 0.4 165 0.24 0.000384
7 19 60 0.8 270 0.05 0.000306
10 20 80 0.6 165 0.14 0.000312
3.6: Graphical Results of the RSM
The 3-D plots of the drying plots of drying rate versus the considered factors of temperature, thickness and time in Figures 3.13 and Figures 3.14 for the untreated and treated water yam respectively.
(a) (b) (c)
Fig 3.13:Profile of response surface and contour plots for drying rate versus (a) temperature and thickness (b) temperature and time (c) thickness and time of the untreated water yam.
(a) (b)
(c)
[image:9.595.33.565.236.467.2]Fig 3.13:Profile of response surface and contour plots for drying rate versus (a) temperature and thickness (b) temperature and time (c) thickness and time of the treated water yam
Table 3.6: ANOVA for Drying Rate of Untreated Water Yam
Source Sum of Squares df Mean Square F-value p-value
Model 2.757E-07 9 3.064E-08 60.78 < 0.0001 Significant
A-Temperature 3.063E-09 1 3.063E-09 6.08 0.0334
B-Thickness 7.656E-08 1 7.656E-08 151.90 < 0.0001
C-Time 4.409E-08 1 4.409E-08 87.47 < 0.0001
AB 1.183E-07 1 1.183E-07 234.79 < 0.0001
AC 5.671E-09 1 5.671E-09 11.25 0.0073
BC 3.741E-09 1 3.741E-09 7.42 0.0214
A² 3.413E-09 1 3.413E-09 6.77 0.0264
B² 3.036E-09 1 3.036E-09 6.02 0.0340
C² 3.782E-10 1 3.782E-10 0.7504 0.4067
Residual 5.040E-09 10 5.040E-10
Lack of Fit 5.040E-09 5 1.008E-09
Pure Error 0.0000 5 0.0000
Cor Total 2.808E-07 19
Std. Dev. 0.0000 R² 0.9820
Mean 0.0004 Adjusted R² 0.9659
C.V. % 5.83 Predicted R² 0.7701
Adeq Precision 31.3573
[image:9.595.33.569.560.782.2]The Model F-value of 60.78 implies the model is significant. There is only a 0.01% chance that an F-value this large could occur due to noise. P-values less than 0.0500 indicate model terms are significant. In this case A, B, C, AB, AC, BC, A², B² are significant model terms. The Predicted R² of 0.7701 is in reasonable agreement with the Adjusted R² of 0.9659; the difference is less than 0.2. Adeq Precision measures the signal to noise ratio. A ratio greater than 4 is desirable. The ratio of 31.357 indicates an adequate signal. This model can be used to navigate the design space.
Table 3.7: ANOVA for Drying Rate of treated Water Yam
Source Sum of Squares df Mean Square F-value p-value
Model 1.167E-07 9 1.297E-08 7.35 0.0022 Significant
A-Temperature 3.318E-08 1 3.318E-08 18.80 0.0015
B-Thickness 1.399E-08 1 1.399E-08 7.93 0.0183
C-Time 1.340E-08 1 1.340E-08 7.59 0.0203
AB 1.990E-08 1 1.990E-08 11.28 0.0073
AC 1.073E-08 1 1.073E-08 6.08 0.0333
BC 7.031E-10 1 7.031E-10 0.3984 0.5420
A² 1.208E-08 1 1.208E-08 6.84 0.0258
B² 1.882E-10 1 1.882E-10 0.1067 0.7507
C² 8.205E-12 1 8.205E-12 0.0046 0.9470
Residual 1.765E-08 10 1.765E-09
Lack of Fit 1.765E-08 5 3.529E-09
Pure Error 0.0000 5 0.0000
Cor Total 1.344E-07 19
Std. Dev. 0.0000 R² 0.8687
Mean 0.0003 Adjusted R² 0.7505
Adeq Precision 9.7024
The Model F-value of 7.35 implies the model is significant. There is only a 0.22% chance that an F-value this large could occur due to noise. P-values less than 0.0500 indicate model terms are significant. In this case A, B, C, AB, AC, A² are significant model terms Adeq Precision measures the signal to noise ratio. A ratio greater than 4 is desirable. The ratio of 9.702 indicates an adequate signal. This model can be used to navigate the design space.
3.7: Final Equation in Terms of Coded Factors
Mathematical models (with significant model terms) of the drying rates as function of temperature (A), thickness (B) and time (C) are expressed in Equations (4.1) – (4.20). . In all the sample models, the highest power of the variables is two, indicating that quadratic model is adequate for the description of the drying rate with respect to temperature, thickness and time. It was also observed that there were interactions of the factors in the drying process. The positive signs in the models indicate synergetic effects, while the negative signs show antagonistic effects of the factors. The equation in terms of coded factors can be used to make predictions about the response for given levels of each factor.
Untreated Water Yam
Drying Rate = +0.0003 + 0.0000A + 0.0001B - 0.0001C + 0.0001AB + 0.0000AC + 0.0000BC + 0.0000A2
+ 0.0000B2 (3.1)
Treated Water Yam
Drying Rate = +0.0004 - 0.0001A + 0.0000B - 0.0000C + 0.0000AB + 0.0000AC - 0.0001A2
(3.2) 3.8: Optimum Parameters of the Drying Rates
The optimum parameters of temperature, thickness and time with corresponding drying rates of the samples are shown in Table 3.8
Samples Optimum Temperature 0C Optimum Thickness
Cm
Optimum Time minutes
Optimum Drying Rate kg/m2s
Untreated Water Yam 70.0 0.60 165.0 0.000345
Treated Water Yam 74.9 0.66 116.1 0.000358
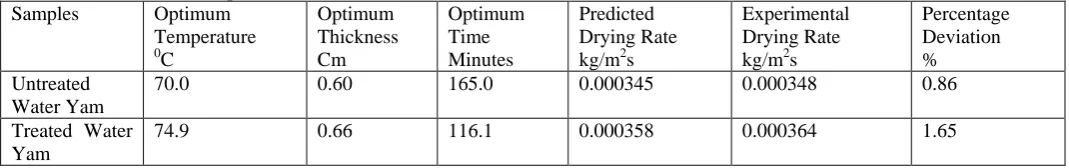
3.9: Validation of the Results
[image:10.595.31.566.504.588.2]The validation of the results is presented in Table 3.8. The model of the drying rate was validated by considering the percentage deviation of the predicted data from the experimental data. In all the samples, percentage deviation is less than 5%, which confirm that the models are adequate for the description of the drying process.
Table 3.8: Validation of Optimum Results Samples Optimum
Temperature
0
C
Optimum Thickness Cm
Optimum Time Minutes
Predicted Drying Rate kg/m2s
Experimental Drying Rate kg/m2s
Percentage Deviation % Untreated
Water Yam
70.0 0.60 165.0 0.000345 0.000348 0.86
Treated Water Yam
74.9 0.66 116.1 0.000358 0.000364 1.65
CONCLUSION
Response surface analysis was effectively used to determine the effect of temperature, drying time and slice thickness on drying rate. The air temperature of 70oC, slice thickness of 6mm and drying time of 165minutes was proposed as the optimum independent variable for un treated water yam, while 74.9OC,6.6mm and 116.1minutes for treated water yam. At this optimum condition, the predicted response for drying rate was 0.000345kg/m2s and 0.000358kg/m2s for untreated and treated water yam respectively.
REFERENCES
Akubor P.I., (2013) Effect of Ascorbic Acid and Citric Acid Treatments on the Functional and Sensory Prosperities of Yam Flour. International Journal of Agricultural Policy and Research 1:4.
AOAC (2004). Association of Official Analytical Chemistry. Official Method of Analysis 14th ed. Washington D.C.
Baah, F.D., (2009). Characterization of Water Yam (dioscorea alata) for Existing and Potential Food Products. A Thesis Submitted to the Department of Food Science and Technology, Kwame Nkruma University of Science and Technology, pp 1-4.
Babalis S.J., and Belessiotis V.G. (2004). Influence of the Drying Conditions on teh Drying Constants and Moisture Diffusivity, During the Thin-Layer Drying of Figs. Journal of Food Engineering, 65, 449 – 458.
Barbosa-Conovas G.V. and Juliano P., (2007). Desorption Phenomena in Food Dehydration Processes. In Water Activity in Foods. Fundamentals and Applications. Blackwell Publishing Professional, Ames, Towa, U.S.A.
Buckman E.S., Plahar W.A., Oduro I.N., and Carey E.E., (2015). Effects of Sodium Metasulphite and Blanching Pretreatments on the Quality Characteristics of Yam Bean Flour. British Journal of Applied Science and Technology 6 (2): 130 – 144.
Dimente L.M. and Munro P.A., (1993). Mathematical Modelling of Convection Drying of Green Table Olives. Biosystems Engineering, 98:47-53.
Doymas I. (2004). Convective Air Drying Characteristics of Thin Layer Carrots. Journal of Food Engineering, 61:359 – 364.
Doymaz I., (2005) Sundrying of Figs: An Experimental Study. Journal of Food Engineering 71, 403 – 407.
Goyal R.K., Kingsley A.R.P., Manikatan M.R., Ilyas S.M., (2007). Mathematical Modelling of Thin-Layer Drying Kinetics of Plum in a Tunnel Dryer. Jounrla of Food Engineering, 76: 176 – 180.
Hoover, R. (2001). Composition, Molecular Structure and Physio-Chemical Properties of Tuber and Root Starches. Carbohydrate Polymers 45: 253 – 267.
Karel, M., and Lund D. D., (2003). Physical Principles of Food Preservation New York: Marcel.
Kaymak-Ertekin F. (2002). Drying and Rehydrating Kinetics of Green and Red Peppers. Journal of Food Science. 67 (1): 168-175.
Mahmutoylu T., Pala M., and Unal M., (1995). Mathematical Modelling of Moisture, volume and Temperature Changes During Drying of Pretreated Apricots. Journal of Food Processing and Preservation, 19, 467 – 490.
Nazghelichi T., Aghbashlo M., and Kianmehr M.H., (2011) Optimization of an Artificial Neural Network Topology using Coupled Response Surface Methodology and Genetic Algorithm for Fluided Bed Drying. Computer and Electronic in Agriculture, 75 (1): 84 – 91.
Oluwole, O., Alagbe G., Alagbe O., Ibidapo O., Ibekwe D. and Owolabi S., (2017). A Comparative Quality Evaluation of White Yam and Water Yam Chips as African Fries. Advances in Nutrition and Food Science. Vol. 2, Issue 1, pp. 1-5.
Senadeera W., Bhandan, B.R., Young G., and Wijesingle B.(2005) Modelling Dimensional Shrinkage of Shaped Foods in Fluidized Bed Drying. Journal Food Processing and Preservation 29:109-119.
Srikiatden J., and Roberts J.S. (2005). Moisture Loss Kinetics of Apple During Convective Hot Air and Isothermal Drying. International Journal of Food Properities 8: 493 – 512.
Taiwo K.A., Angersbach A. And Knorr D. (2002). Influence of High Electric Field Pulses and Osmotic Dehydration on the Rehydration Characteristics of Apple Slices at Different Temperatures. Journal Food Engineering 52 (2): 185-192.
Varnalis A.I., Brennan J.G., Macdougall D. B., and Gilmour S.G., (2004). Optimization of High Temperature Puffing of Potato Cubes using response Surface Methodology. Journal of Food Engineering 61 (1): 153 – 163.
Velic D., Bilic M., Tomas S., Planinic M., Bucic-Kojic A., and Aladic K., (2007). Study of the Drying Kinetics of Granny Smith Apple in Tray Drier. Agric Conspec Science Vol. 72 (4) pp. 326.