Correlation Between EABR and CAEP In
Subjects With Auditory Brainstem Implant.
Ranjith Rajeswaran
1a, Yetisurya Sasikumar*, Jennifer Ramesh*, Pachaiappan C*, Mohan
Kameswaran**
1a
, *MERF Institute of Speech and Hearing (P) Ltd, Chennai. **Madras ENT Research Foundation (P) Ltd, Chennai.
DOI: 10.29322/IJSRP.9.12.2019.p96111 http://dx.doi.org/10.29322/IJSRP.9.12.2019.p96111
DECLARATION
1aThis published work named “Correlation Between EABR and CAEP in Subjects with Auditory Brainstem Implant” is
part of Ph.D. Thesis of THE TAMIL NADU Dr. M.G.R MEDICAL UNIVERSITY.
Correspondence Author:
Ranjith Rajeswaran1a
Principal/ Chief Audiologist,
ISSN 2250-3153
ABSTRACT
The auditory brainstem implants are designed for use in adults with Neurofibromatosis II in order to
restore the hearing and assist them in being able to hear all the sounds in the environment. Recently, the ABI has
also been indicated for use in children with congenital inner ear malformations who would not benefit from hearing
aids or cochlear implantation is not feasible due to anomalous cochlea. The ABI’s have been recognized as an
effective treatment option in children to reinstate the hearing. During the post-operative follow up procedures it is
important to evaluate the integrity and functional outcome of the device. Out of all the objective measures used the
eABR and CAEP were evaluated in this particular study to establish a relationship between the two measures in
children with ABI. Prior to the eABR and CAEP measurements, IFT’s were measured to check the electrode
integrity. The electrodes were categorized into six groups based on the position. Single biphasic pulses were used to
stimulate and the number of peaks observed and the dynamics in the peak amplitude were measured. It was
observed that the mean amplitude of first peak, second peak and third peak was 0.54µv, 0.21 µv and 0.34 µv
respectively. Amplitude of first peak was observed to be larger than second and third peak. The amplitude of eABR
in ABI is also dependent upon the etiology, placement of the electrode, type of stimuli used, noise level etc. The
latencies of CAEP obtained in this study were prolonged compared to age matched children with normal hearing,
yet the latency of P1 was smaller in children with longer duration of implant use compared to children with shorter
duration of implant use. Presence of both eABR and CAEP complements each other to predict the auditory and
non-auditory electrodes and the both eABR and CAEP warrants that the stimulated electrodes is on the cochlear
nucleus, since the end of the auditory pathway is the primary auditory cortex.
KEYWORDS: Auditory brainstem implant, Cortical auditory evoked potential, Auditory brainstem implant.
INTRODUCTION
ABI is a prosthesis that is evolved out of cochlear implant technology that provides electrical stimulation to the Cochlear Nucleus bypassing the cochlea and the auditory nerve. The ABI is designed for patients with bilateral auditory nerve lesions that
occur mainly in bilateral VS (Vestibular
Schwanoma), a main characteristic of NF2
(Kalamardies et al., 2001; Sanna et al., 2012; Shannon et al., 1993). For significant number of
patients, an ABI assists them to perceive ambient sounds, improves lip reading, gives sound awareness, and helps them in voice control. Factors that plays a major role in outcomes commonly spoken in the previous studies comprises size of the
tumor, duration of deafness, pre-implant
radiosurgery,
Placement of the electrode, anatomy, severity of damage to the brainstem due removal of the tumor, and the number of activated channels on the
implant. House and Hitselberger described the first case of a NF2-patient that received a single channel ball electrode on the VCN at the time of tumor removal in 1979 (Hitselberger et al., 1984; Edgerton et al., 1982).
Indications for ABI:
ossification of cochlea. Inner ear anomalies comprises the main group. ABI is not required in all cochleovestibular malformations.
Sennaroglu et al (2009) divided the indications as definite and probable indications. Definite indicators include Michel aplasia (complete labyrinthine aplasia where cochlea, vestibule and
vestibular aqueduct is a absent), Cochlear aplasia (complete absence of cochlea), Cochlear nerve aplasia (complete absence of cochlear nerve) whereas, probable indicators include hypoplastic cochlea, common cavity and incomplete partition type 1, incomplete partition type 11, hypoplastic nerve etc. If sufficient amount of neural tissue cannot be followed into the cochlear space, an ABI may be indicated.
Use of objective measures in ABI
Auditory Brainstem Response:
The auditory brainstem response (ABR) measurement is an objective way to test the hearing system and is used for two main purposes; to estimate hearing thresholds and to determine retrocochlear pathologies (Arlinger, 2007). This technique can also be utilized as a tool to examine if the stimulation from a CI or an ABI reaches brainstem structures. In the first 10ms after a click stimuli is presented to the ear, a number of small waves can be recorded from the scalp. The principle behind recording ABR is that stimuli are presented to one or both ears and scalp electrodes detect changes in voltage from the skin. An sound amplifier is necessary because the amplitude of the obtained recorded signal is extremely low. A computer is used for digital signal processing, filtering to take out the unwanted frequencies, and for averaging data so that the ABR-response can be seperated from noise.
Electric Evoked Auditory Brainstem Response
As an alternative to stimulating the ear with an acoustic stimulus, stimulation can be performed via the CI or ABI; Electrical Evoked Auditory Brainstem Responses (eABR). The obtained waveforms are significantly similar as those of acoustic ABR when activated via a CI; however, the initial first wave are not present and the latencies are significantly shorter.
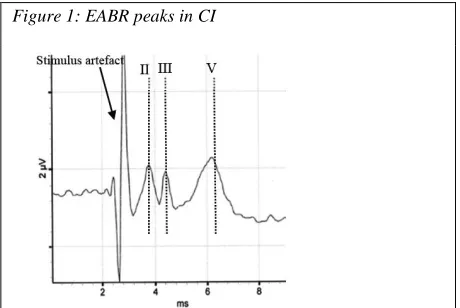
[image:3.612.318.548.94.248.2]
Figure 1: EABR peaks in CI
Figure 1.4: shows EABR 11 111 and V peak in CI
When activating through CI, wave I is absent because the implant activation occurs in the cochlea where wave I is generated and this wave is commonly shaded by the stimulation artifact (Abbas & Brown, 1988; Cinar et al., 2011; Gordon et al., 2007; Firszt et al., 2002). When stimulating via an ABI, waves I and II are missing because stimulation occurs at the CN (Frohne et al., 2000; Herrmann et al., 2015; Nevison et al., 2002). Waveform shapes are also considerably different when stimulating via the ABI.
One explanation may be that the stimulation occurs at one of the possible generators of wave III, and because waves III, IV, and V are thought to have multiple generators; however, this presently remains unclear.
ISSN 2250-3153
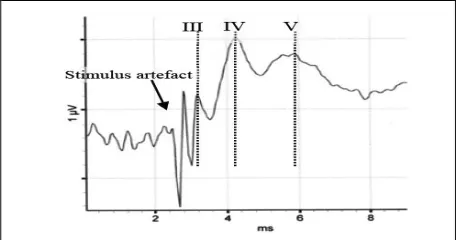
Figure 1.5: depicts 111 1V and V peak in ABI
Cortical auditory evoked potentials
Children born with congenital deafness or who are pre-lingually are faced with an auditory system that does not experience any auditory input. The central auditory system depends on this sensory input to mature and develop normally and if disrupted, normal developmental processes are altered. The maturation of the central auditory system is not fully complete until age 12 and in some cases even into the teenage years (Kral & Tillein, 2006). With implants, some aspects of the auditory cortex can be restored with electrical stimulation of the auditory nerve. Thus prosthetic devices can provide deaf children with new auditory inputs, instead of a system that would otherwise be deprived of auditory stimulation (Kral &Tillein, 2006).
The effectiveness of the implants on the maturing central auditory system can be determined by objective measures such as CAEP. CAEPs are a useful objective tool because they can measure the maturational processes for auditory cortical function, since the P1 latency varies as a function of
chronological age. P1 latency reflects the
accumulated sum of delays in synaptic propagation through the peripheral and central auditory pathway (Sharma et al. 2002). With these objective measurements, CAEPs can determine how the central auditory system is developing with electrical stimulation from the implants.
Cortical auditory evoked potentials (CAEPs) reflect the function of the auditory thalamo-cortical pathways and the auditory cortex, and so are a window to the 'auditory brain'. They are a valuable prognosticator for predicting long-term outcomes in both cochlear and brainstem implantees. By profiling the aided CAEPs in children with ABIs its efficacy
can be assessed and thereby helps in evaluating ABI outcomes.
The objective measures like eABR plays a cardinal role in predicting the proper placement of electrodes. The absence of an eABR was not associated with absence of auditory sensation elicited by electrodes in the section of the array stimulated. Therefore the presence of an eABR was considered a good sign, but the absence of an eABR was not of any assistance in identifying non-auditory electrodes (O’ Driscoll et al., 2011). Thus there is a need for CAEP measure to validate whether the electrical signals are reaching in the higher auditory centers.
NEED:
To establish a relationship between
Electrically Evoked Auditory Brainstem Response and Aided Cortical Auditory Evoked Potentials in subjects with Auditory Brainstem Implant.
AIM OF THE STUDY:
The aim of the study was to correlate electrically evoked auditory brainstem responses (eABR) and cortical auditory evoked potentials (CAEP) in Auditory Brainstem Implants.
Intra operative eABR measurements
Colleti et al (2000) studied the use of e ABR in intra operative positioning of the ABI electrode array and in making decision regarding a CI or an ABI in patients with Acoustic Neuroma in the aim of hearing restoration following a surgical removal of Acoustic Neuroma. The results revealed that the intra operative e ABRs were a good predictor for positioning for ABI electrode array. The responses obtained were reliable after repositioning of the device.
Post-operative eABR measurements
Maria Valeria et.al, (2012) reported
outcomes in 3 out of 4 children with cochlear and 8th
nerve aplasia that free field thresholds with warble tones varied from very soft auditory sensation of 70dBHL at 250 Hz to a pure tone average of 45dBHL.
Sennaroglu et al 2009 described the results of 11 children in the age range from 2.5 to 5.0 years with inner ear malformations including sever stenosis of the cochlear aperture and aplasia of the cochlear nerve underwent ABI. Auditory performance of 6 children revealed that they gained basic audiologic functions and were able to recognize and discriminate sounds and could identify environmental sounds also by three months after ABI. They typically improved in their closed-set speech perception scores performance. It was concluded that, ABI was a better option for hearing restoration in children with Inner ear malformations that are contraindications to Cochlear Implant surgery. Patients with additional malformations slowed progress, but ABI also helps them in their everyday life.
Maturation of cortical potentials
The central auditory system depends on this sensory input to mature and develop normally, and if disrupted, normal developmental processes are altered. The maturation of the central auditory system is not fully complete until age 12 and in some cases even into the teenage years (Kral & Tillein, 2006).
With the implants, some aspects of the auditory cortex can be restored with electrical stimulation of the auditory nerve. The prosthetic devices can provide deaf children with new auditory inputs, instead of a system that would otherwise be deprived of auditory stimulation (Kral & Tillein, 2006). To determine the effectiveness of the implant on the maturing central auditory system, objective measures such as CAEPs can be used. CAEPs are a useful objective tool because they can measure the maturational processes for auditory cortical function, since the P1 latency varies as a function of chronological age (Sharma et al., 2002).
Kameshwaran M et.al (2013) reported that CAEP can be successfully recorded in ABI and CAEP profiling can be an objective method of analyzing the optimal placement and function of the ABI electrodes on the brainstem. Thus CAEP is an efficient adjunct to electrically evoked auditory brainstem (eABR) for testing ABIs. When stimulated via the ABI, CAEP may reflect re-organization of higher auditory centers and hence a good prognosticator for long- term assessment of ABI performance.
METHODOLOGY
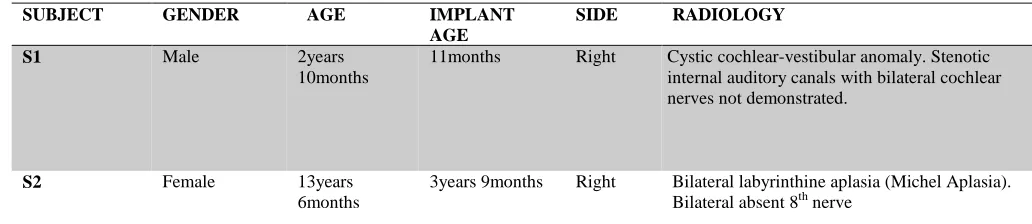
[image:5.612.37.553.554.666.2]Participants included eleven children with auditory brainstem implants. The demographic data of the subjects are listed in the Table 1.
Table 1
SUBJECT GENDER AGE IMPLANT AGE
SIDE RADIOLOGY
S1 Male 2years
10months
11months Right Cystic cochlear-vestibular anomaly. Stenotic internal auditory canals with bilateral cochlear nerves not demonstrated.
S2 Female 13years
6months
ISSN 2250-3153
S3 Male 4years
2months
1year 10months Right 8th nerve is not visualized bilaterally. Bilateral internal auditory canal are of reduced caliber. The bony canal for the cochlear nerve is also of very small caliber.
S4 Male 11years
3months
7years Right Hypoplastic right eighth nerve-vestibular component. Left cochlear nerve is absent/ grossly hypoplastic.
S5 Female 7 years 2years 2months Right Complete absence of cochlea, semicircular canal, utricle and saccule s/o Bilateral Michel’s aplasia.
S6 Female 6years
2months
1year 4months Right Hypoplastic vestibule with malformed/deformed bilateral posterior semicircular canals. Bilateral IAC stenosis with absent 7th and 8th nerve complexes.
S7 Female 5years
5months
1year 9months Right Cochlear nerve and vestibular nerve are non visualized, hypoplastic on either sides. Bilateral internal auditory canal are stenosed.
S8 Male 6years 8months
2years Right Malformed cochlea on both sides with severely dysplastic cochlear nerve on the right side and absent cochlear nerve on the left.
S9 Female 4years
11months
1year 5months Right Bilateral Michel’s aplasia and absent right cochlear, superior vestibular and left vestibulocochlear nerves.
S10 Male 3years
3months
1year 3months Right Cochlear nerve and vesibular nerve are non visualized, hypoplastic on either sides.
S11 Male 6years
3months
1year 4months Right Bilateral internal auditory canal stenosis with absent 7th and
8th nerve complexes.
eABR recordings was performed using GSI Audera EP system connected to the laptop with the Audera software version 2.7.5 installed. The EP system was connected to the pre amplifier using a connecting cable. Electrodes were connected to the pre amplifier. Positive electrode was placed on the vertex (Cz), Ground electrode on the upper forehead (Fz) and Negative on the contralateral mastoid (C7). A single channel recording setup was established. A trigger cable was connected between the EP system and the diagnostic interface box (dIB II) used for stimulation. The dIB II was connected to a laptop with Maestro software version 4.1.2 to control and manipulate the stimulus parameters. The stimulus was delivered to the implant via a cable with a transmitting telecoil, connected to dIB II. The telecoil was placed over the receiver stimulator of the implant during stimulation.
Impedance Field Telemetry (IFT):
Before recording eABR and measuring psychophysical levels, IFT was performed to check the integrity of the electrode array. A telemetry coil was connected to the dIB II which was placed over
the receiver stimulator to deliver the stimulus to the internal implant. The IFT enables measurement of voltages at intra cochlear electrodes of the Med- EL implant during stimulation. The measured results show the impedance of individual intra electrodes, ground path impedance, integrity and coupling between the implant and dIB coil are indicated.
Recording
Single biphasic pulses were used to stimulate. The onset of the stimulus coincided with the onset of the trigger pulse to the evoked potential system. The amplitude of stimulation was expressed in current unit (cu) that can range from 0-1200cu. These units as defined by the manufacturer relate to the amount of current delivered. 1cu is equivalent to 1µv (Med EL limited). Following IFT, an eABR trial was recorded at 0cu for all the electrodes and was considered as a baseline recording. This recording was used to understand the dynamics of the stimulus artifact. The initial level of stimulation was started at 100cu. The stimulus level was manipulated from 100 – 500cu depending on the appearance or absence of responses.
Table 2 eABR stimulus and Recording Parameters
S.NO STIMULUS RECORDING
1. Electrical stimulus- Biphasic pulses through the implant
Responses recorded using surface electrodes.
2. Pulse duration 30-65µs Time window: 10ms
3. Polarity: negative initial phase Filter: 30Hz-3000Hz
4 Rate : 34pps Gain: 100000
5. Number of sweeps:1500 Artifact rejection level: 50µv
Number of peaks observed and the dynamics in the amplitude of the peaks were measured and calculated during each interval of recording. Electrodes in which observable eABR responses was obtained were considered as “Predicted Auditory Electrodes”, and the other electrodes in which no observable eABR responses were considered “Predicted Non Auditory Electrode”. Non auditory sensations caused by the stimulation were carefully observed.
ABI Electrode Category
ABI electrode is with 12 active electrodes and one reference electrode. The electrodes from one to six forms the medial electrodes and 7-12 form the lateral electrode parts of the cochlear nucleus complex (CNC). The electrode complex was categorized into six groups G1 (medial electrodes), G2 (lateral electrodes), G3(all electrodes), G1a(medial superior),
G1b (medial inferior), G2a (lateral superior), G2b (lateral inferior).
CAEP Measurement
A nal Hear lab system (Frye electronics) was used for the procedure. The subject was seated comfortably on a chair with a loudspeaker approximately at a distance of 1meter from his/her head (in the two hearing centers respectively) with the loudspeaker placed at 0dB azimuth. Silent cartoons were played to keep the client on position. The state of the child was often monitored by the audiologist as the test progressed to ensure that the electrodes are in place and also to check for the alertness of the child. Cotton applicator and electrode gel was used to prepare the electrode sites. Electrode impedance was checked. 2 kohm impedance was maintained between the active and the ground and also between the reference and the ground. The
electro encephalography (EEG) activity was
ISSN 2250-3153
The Hear lab system uses an automatic statistical detection procedure which does not necessitate a subjective response interpretation from the operator (Carter, Golding, Dillon & Seymour 2010). This system generated significance level (p-level) was used to determine whether or not a response was present and to determine the end of the test run. CAEP was judged to be present if the p-value reached the level of p<o.o5. One hundred accepted epochs were elected as a higher number of epochs that makes data collection with this age group clinically not feasible in a restricted measurement time. Speech stimuli (/m/, /g/, /t/) were presented and recorded at 75 and 65dBSPL. Cortical recognition of these speech stimuli does not essentially signify detection of frequency cues, but rather (mainly) a detection of transient or onset (Burkard, Eggermont and Don 2007).
RESULTS AND DISCUSSION:
eABR was recorded in all the eleven subjects by grouping the electrodes as G1, G2 and G3. G1- Medial Electrodes (EL1 to EL6), G2 Lateral Electrodes (EL 7 to EL12) and G3- All Electrodes (EL1 to EL12). In all the three groups CAEP waveforms was also recorded. A clear biphasic stimulus artifact was consistently observed within the first 0.72msec from the start of recording. In the Martin O’ Driscoll (2011) study also reported the presence of a biphasic stimulus artifact at 0.76msec from the start of the recording.
Morphology and Latency of Electrically Evoked Auditory Brainstem Response
eABR findings in G1 (Medial Electrodes):
Medial electrodes from EL1 to EL 6 were stimulated using bi-phasic electrical stimuli. The waveform morphology can be expressed in terms of number of peaks present. It varied between one peak, two peaks and three peaks ie; P1, P2 and P3 respectively. Among the eleven subjects first peak (P1) could be obtained in four subjects (S2, S3, S4, S5). First (P1), second peak (P2) and third (P3) peak could be recorded only in one subject (S3). Peaks could not be recorded in the other six subjects. In one subject (S1) eABR could not be recorded since the
electrodes were disabled due to presence of non-auditory sensation observed during programming.
The average latency of the first peak was recorded at 1.38ms, second and third peaks at 1.71ms and 3.37ms respectively. Inter peak latencies were found to be variable compared to conventional acoustic auditory brainstem responses, no inferences could be made since all the three peaks were obtained in a single subject (S3). It was observed that the mean amplitude of first peak, second peak and third peak was 0.54µv, 0.21 µv and 0.34 µv respectively.
eABR findings in G2 (Lateral Electrodes):
Lateral electrodes from EL7 to EL 12 were stimulated using bi-phasic electrical stimuli. First peak (P1) could be recorded in five subjects, first (P3) and second peak (P3) could be obtained in one subject. In this group third peak (P3) was not obtained and no peaks could be recorded in the other six among the total eleven subjects. The average latency of first peak was obtained at 1.1ms and second peak at 2.5ms. The mean amplitude of first peak was 0.28µv and second peak was 0.23 µv.
Colletti (2001) described eABR
morphology for three of the children as being either two or three positive peaks with latencies between 1.0ms and 3.0msecs. The three peaks were equated to wave III, IV and V of an acoustically evoked ABR and their origins attributed to the cochlear nucleus, superior olive and lateral lemniscus, respectively. When comparing the children’s response to those from adults, P1 is analogous to the Acoustic ABR wave III. P2 is likely to be equivalent to acoustic ABR wave IV and P3 would equate to acoustic ABR wave V (Frohne et al. 2000).
eABR findings in G3 (All Electrodes)
Martin O,Driscoll (2009) studied the morphology of eABR in subjects with Auditory Brainstem Implant, he also recorded three different morphology based on the emergence of the peaks. He noticed the latency of P1 at 1.53ms, latency of P2 at 2.34 and latency of P3 to be around 3.65ms. The latency obtained in our study is more or less similar to the latencies obtained by O,Driscoll et al 1996. However in the present study electrodes EL1 to EL6 were stimulated simultaneously, whereas O’Driscol (1996) stimulated electrodes sequentially.
The amplitude of each waveform were measured as the fall from the peak to the following trough; if the peak was observed to be overriding a later peak then
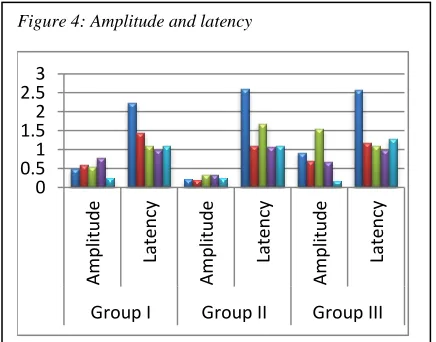
the amplitude was measured as the rise from the preceding trough to the peak (Martin O Driscoll 2011). It was observed that the mean amplitude of first peak, second peak and third peak was 0.54µv, 0.21 µv and 0.34 µv respectively. Amplitude of first peak was observed to be larger than second and third peak. Martin O’ Driscoll (2011) studied the amplitude of eABR peaks in subjects with Auditory Brain Stem Implant and the average amplitude was recorded as for first peak ranging 0.60 µv to 0.90µv, second peak 1.2 µv to 1.88 µv and third peak 2.04 µv to3.00 µv. The amplitude obtained in this study was comparatively less from the Martin O’ Driscoll (2011) study. However the amplitude of eABR in ABI is also dependent upon the etiology, placement of the electrode, type of stimuli used, noise level etc.
eABR amplitude and latency across the groups
The amplitude of medial electrodes was higher compared to the lateral electrodes. This could be due
to the positioning of electrode during the surgery, it is hypothesized that when the electrodes stimulate the cochlear nucleus it will elicit good action potentials, compared to electrodes that do not or partially stimulating the nucleus. The evidences from O’Driscol (2009), Senaragolu (2011) and Colletti (2012) also confirms the hypothesis. In this study the electrodes on the lateral part of the electrode pad might have had less contact compared to the medial electrodes. The ongoing study at our center on the case by case comparison of the surgical, audiological and outcome may shed some light on strengthening the hypothesis.
There was no significant latency difference across the three group oelectrodes. Martin O’ Driscol (2009) has explained the amplitude growth function of eABR, that the amplitude of eABR increased when the stimulus were increased. He also explained that the noise level during the procedure could also contaminate the responses.
Aided Cortical Evoked Potentials
Aided Cortical Auditory Evoked Potential by stimulating G1 (Medial Electrodes):
P1 could be obtained at both 65dBSPL and 75dBSPL for /t/ stimulus. P1 was present for seven subjects when presented at 75dBSPL. P1 was present for both 65dBSPL and 75dBSPL for five subjects. The average latency of P1 for 75dBHL was 159.5ms
[image:9.612.74.288.247.424.2]Figure 3: Three peak wave morphology in eABR
Figure 3: shows the three peaks (P1, P2 & P3) recorded in eABR while stimulating the medial electrodes in S3.
[image:9.612.323.541.255.426.2]36
Figure 4: Amplitude and latency
Figure 5.2 shows the amplitude and latency of P1 across G1 G2 and G3 in five subjects.
0 0.51 1.52 2.53
Am
p
litu
d
e
La
ten
cy
Am
p
litu
d
e
La
ten
cy
Am
p
litu
d
e
La
ten
cy
ISSN 2250-3153
with average amplitude of 3.95µv. The significant value was <0.005. At 65dBHL P1 was recorded at 171.6ms with the average amplitude of 3.25µv with a significance value <0.005. In one subject (S1) CAEP could not be recorded since the electrodes were disabled due to presence of non-auditory sensation observed during programming. Mean implant age was 2.3years “time in sound” and mean chronological was 5years 11months. Kameswaran M et.al (2013) studied aided CAEP in Auditory Brainstem Implants and recorded P1 morphology for three subjects recorded at 100-150ms. The results obtained were comparable with the present study.
Aided Cortical Auditory Evoked Potential by stimulating G2 (Lateral electrodes):
P1 could be obtained at both 65dBSPL and 75dBSPL for /t/ stimulus. P1 was present for two subjects (S2 and S5) when presented at 75dBSPL with an average latency of 216ms. And the average amplitude was recorded around 6.1µv. The significance value of was <0.005. P1 was present for both 65dBSPL and 75dBSPL for only one subject. The average latency of P1 for 65dBHL was recorded at 255ms with an average amplitude of 4.6 µv and the significance value was <0.005. Peaks could not be obtained in the other nine subjects.
The latencies obtained in this study were prolonged compared to age matched children with normal hearing, yet the latency of P1 was smaller in children with longer duration of implant use compared to children with shorter duration of implant use. Sharma et al. (2002) and Ponton et al. (1996) examined P1 latencies of cortical auditory evoked potentials in children with Cochlear Implant. Both the studies revealed the latency of P1 was prolonged in children with cochlear implant compared to age matched children with normal hearing. However the latency of P1 was smaller in children with longer duration of implant use compared to children with shorter duration of implant use. These findings are in consonance with our findings. Sharma et al 2002 also found that the latency of P1 decreased rapidly within the first 6 months after the activation of the external sound processor, except for children implanted at very late age.
Aided Cortical Auditory Evoked Potential by stimulating G3 (All Electrodes)
P1 could be recorded at 75dBSPL and 65dBHL for /t/ stimulus for seven subjects among the total eleven subjects (S1, S2, S3, S4, S5, S7 and S8). Peaks could not be obtained for the other four
subjects. The mean amplitude of P1 for 75dBHL was 2.8µv and mean latency was 165ms with a P value <0.005. Among this seven subjects P1 for both 75dBHL and 65dBHL could be obtained only in five subjects. The mean amplitude of P1 for 65dBHL was 2.3µv and mean latency was 183ms with a P value <0.005.
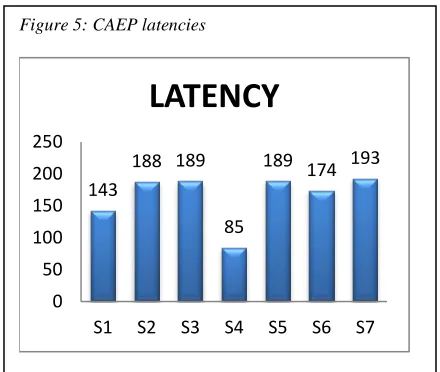
CAEP latencies across the subjects in G3:
Aided CAEP P1 waveform could be obtained in seven subjects among the eleven subjects. The latencies of the peaks ranged from 85-200 ms. In one subject (S4) the latency was observed to be similar to that in normal hearing children ie; 85ms. The implant age of this particular subject is the highest among the eleven subjects ie; seven years. Kameswaran M et.al (2013) studied aided CAEP in Auditory Brainstem Implants and recorded P1 morphology for three subjects recorded at 100-150ms. In his study he also found that the latency of aided CAEP reduced with respect to the duration of the implant use this is in consonance with our findings.
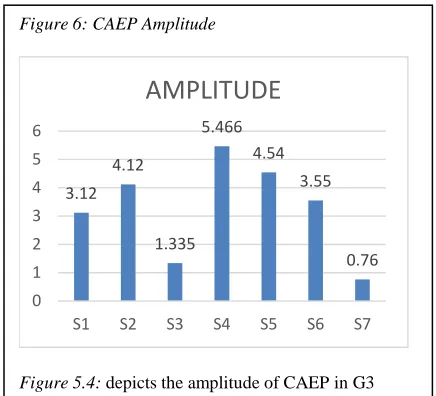
CAEP amplitude across the subjects in G3
The amplitude of the aided cortical
[image:10.612.322.542.197.383.2]potentials in the seven among the eleven subjects was between 0.75-6µv. The highest amplitude was obtained in S4 who has the highest implant age (7yrs) among the subjects.
Figure 5: CAEP latencies
Figure 6: depicts the latencies of CAEP across the seven subjects
143
188 189
85
189 174 193
0 50 100 150 200 250
S1 S2 S3 S4 S5 S6 S7
In one subject the eABR and CAEP were measured by stimulating the electrodes more categorically, in the Medial group of electrodes the EL2 and EL5 were considered as superior and EL3 and EL6 were considered as inferior with respect to the positioning. And in the Lateral group of electrodes the EL7 and EL10 were considered as superior and EL 8 and EL11 were considered as inferior.
Two peaks (P1 & P2) could be recorded in medial superior electrodes (EL 2 & 5), the amplitude of first peak (P1) was 0.27µv and the latency was1.21ms and second peak (P2) was recorded at the latency of 2.37ms with an amplitude of 0.16µv. No peaks could be recorded in medial inferior electrodes (EL 3 & 6) even after increasing the stimulation level. Single peak (P1) was recorded in lateral superior electrodes (EL 7 & 10) with an amplitude of
0.82µv at the latency of 1.04ms. In the lateral inferior electrodes (EL 8 & 11) single peak (P1) was recorded with an amplitude of 0.33µv at the latency of 1.00ms.
P1 of the Cortical Auditory Evoked Potentials could be recorded in all the sub categories of electrodes. In the medial inferior electrodes (EL 3 & 6) P1 was recoded at the latency of 173ms with an amplitude of 1.5µv and the significance value was <0.005. Though no eABR peaks were recorded in the medial inferior electrodes, P1 of aided CAEP could be recorded. The absence of eABR and the presence of CAEP could be due to insufficient stimulation.
In the medial superior electrodes (EL 2 & 5) P1 was obtained at an amplitude of 1.78µv with the latency of 166ms and the significance value was <0.005. There is no difference in amplitude of P1 in
Aided CAEP for both inferior and superior electrodes in the medial group. Latency of P1 obtained in the lateral superior electrodes (EL 7 & 10) was 165ms with the amplitude of 4.04 µv and the significance value p was <0.005. In the lateral inferior electrodes (EL 8 & 11) P1 was recorded at the latency of 181ms with the amplitude of 1.92µv and the significance value was <0.005. Though no statistical correlation or significance could be made for the single subject the data obtained shows that relationship between the morphology of eABR and CAEP was good. In this subject the presence of eABR also confirms the presence of CAEP. There was no study in the literature that compared the correlation of the morphology of eABR and Aided CAEP in ABI.
RELATIONSHIP BETWEEN eABR AND CAEP MEDIAL ELECTRODES (EL 1 to EL6)
eABR was present in four subjects among the eleven subjects who participated in the study. In all the four subjects were eABR was elicited also yielded good CAEP. Only one subject had the lateral electrodes switched-on. All the medial electrodes were switched-off due the presence of non-auditory sensation.
LATERAL ELECTRODES (EL to EL12)
eABR was present in four subjects among the eleven subjects. Among the four subjects in whom eABR was recorded, two subjects also showed good CAEP. In other two subjects the CAEP was absent.
ALL ELECTRODES (ALL ELECTRODES)
eABR could be recorded in five subjects among the eleven. And CAEP was recorded in seven subjects among the total eleven subjects who participated in the study. Out of seven subjects were CAEP was recorded, eABR could not be recorded on two subjects.
[image:11.612.70.288.302.500.2]eABR and CAEP could be recorded in most of the subjects, in subjects were CAEP and eABR could not be recorded have to be examined in detail with respect to the etiology, surgical and behavioral responses. eABR morphology, latency and amplitude were in consonance with O,Driscol (2011) study . Presence of CAEP and absence of eABR could also be explained due to the fact that the auditory brainstem response is a test of neural synchrony. To record ABR either elicited electrically or acoustically the neural firing has to be in synchrony with the stimulus onset, failing which the action potentials could not be recorded. Unlike eABR, recording Late Latency Response especially CAEP does not require synchronous firing. For the same purpose, CAEP is also included in the test battery for differential
Figure 6: CAEP Amplitude
Figure 5.4: depicts the amplitude of CAEP in G3 3.12
4.12
1.335 5.466
4.54 3.55
0.76
0 1 2 3 4 5 6
S1 S2 S3 S4 S5 S6 S7
ISSN 2250-3153
diagnosis of Auditory Neuropathy Spectrum
Disorder.
eABR poses technical challenges while recording by stimulating the brainstem. The responses amplitude of eABR is higher than the acoustical ABR, so the device that is used to measure eABR should have a high saturation pre amplifier, but still sometimes it is very difficult to pick the appropriate peaks due to high noise levels. Presence of eABR confirms that the electrode is on the cochlear nucleus, but absence of eABR do not warrant that the electrode stimulated is not on the cochlear nucleus O.Driscoll (2009).
However it is important to note that presence of both eABR and CAEP warrants that the stimulated electrodes is on the cochlear nucleus, since the end of the auditory pathway is the primary auditory cortex.
CONCLUSION:
Auditory Brainstem Implant by passes cochlea and stimulate the cochlear nucleus directly, thereby restoring the auditory sensation. eABR plays a cardinal role in predicting the electrode positioning intra operatively and postoperative programing. It is the most frequently used electrophysiological test in children and adult with Auditory Brainstem Implants. Intra-operative eABR objectively identifies the correct location of the electrodes with respect to the cochlear nucleus and also confirms optimal implant function. eABR thresholds can be used as a guide to program the mapping levels in the ABI at the time of switch on. After switch-on, eABR thresholds can be used as a guide to program the mapping levels in the ABI. eABR is a time consuming procedure. Factors during testing like muscle artifacts, EEG interference, and electrical interface mismatch may affect eABR wave- forms, resulting in inconclusive recordings. More over the morphology of brainstem stimulated eABR is not well defined, since there is a high variability within and across the subjects and electrodes tested. Etiology and tissue damage during the surgery can also be an important factor affecting eABR.
The study includes another
electrophysiological measure to complement the eABR findings and to predict the auditory and non-auditory electrodes. Cortical Auditory Evoked Potentials were employed to measure the responses by stimulating the electrodes in the brainstem.
In this study all the subjects were implanted with MedEl Auditory Brainstem Implant, which had 12 active surface electrodes placed on the pad called the electrode pad. The electrodes were grouped based on the location in the Brainstem. Electrode one to electrode six were grouped as medial electrodes,
electrodes from seven to twelve were grouped as lateral electrodes. Both eABR and CAEP were
performed by stimulating both the groups
independently and also by stimulating all the electrodes.
Morphology of eABR was described based on the number of peaks. Three peaks were recorded in this study, but all the three peaks were not present for all the subjects. Most of the subjects had single peak (P1) eABR, two subjects had two peaks (P2) and one subject had all the three peaks (P3). Average latency of peaks was 1.38ms, 1.71ms and 3.37ms for P1, P2 and P3 respectively. CAEP were recorded in most of the subjects in all the groups. In general the medial electrodes yielded more eABR and CAEP compared to the lateral electrodes. CAEP’s were recorded at both 65dBSPL and 75dBSPL. Amplitude of P1 of CAEP was larger at 75dbSPL compared to 65dBSPL stimulation level.
In few subjects both eABR and CAEP were not recorded. It is evident from this study that eABR and CAEP were recorded reliably from both the group of electrodes. Presence of both eABR and CAEP complements each other to predict the auditory and non-auditory electrodes.
REFERENCES
Ata, L. S. (2013). Auditory Brainstem
Implantation in Children. Otorhinolaryngol, 80-91.
Castillo, B. H. (2011). Pediatric Sensorineural Hearing Loss, Part 1: Practical Aspects for
Neuroradiologists. American Society of
Neuroradiology.
Colletti L.(2007)Beneficial auditory and cognitive eff
ects of auditory brainstem implantation in children.
Acta Otolaryngol.
Colletti, V. (2006). Auditory outcomes in tumor vs nontumor patients fitted with auditory brainstem
implants. Advances in otorhynolaryngology, 167-185.
Colletti, V., & Shannon, R. V. (2005). Open Set Speech Perception with Auditory Brainstem Implant.
The American Laryngological, Rhinological and Otological Society.
D E Hitselberger, W. E. (1993). Auditory Brainstem
Implant: Issues in surgical implantation .
F B Simmons, C. J. (1964). Electrical stimulation of acoustical nerve and inferior colliculus. Archives of Otolaryngology, 559-67.
Kuchta, J. (2007). Twenty five years of auditory
brainstem implants:perspectives,. Acta
Neurochirurgica Supplement, 443-449.
Levent Sennaroglu, t. C.-P. (2011). Auditory Brainstem Implantation in Children and Non-Neurofibrom atosis Type 2 Patients : A Consensus Statement. Otology & Neurotology.
M O' Driscoll, D. R. (2011). Brainstem Responses Evoked by stimulation of the Mature Cochlear
Nucleus with an Auditory Brainstem Implant . Ear &
Hearing , 286-299.
Marc S. Schwartz, S. R. (2008). Auditory Brainstem Implants. The Journal of the American Society for Experimental NeuroTherapeutics, 128-136.
Martin O' Driscoll, W. E. (2011). Brainstem Responses Evoked by stimulation with an Auditory Brainstem Implants in childen with Cochlear Nerve Aplasia or Hypoplasia . Ear & Hearing , 300-312.
Petrovic, M. (2011). Using cortical auditory evoked potentials (CAEP) as the outcome measure of cortical maturation, is there an optimal age to implant deaf children to provide better auditory development? .
University of Western Ontario: School of Communication Sciences and Disorders .
Rafael da Costa Monsanto, A. G. (2014). Auditory Brainstem Implants in Children: Results Based on a
Review of the Literature. The Journal of
International Advanced Otology.
Raghunandhan Sampathkumar, M. K. (2013). Clinical study of aided cortical auditory evoked potentials in pediatric auditory brainstem implantees.
Journal of Hearing Science.
Robert Behr, V. C.-D. (2014). New Outcomes With Auditory Brainstem Implants in NF2 Patient. Otology & Neurotology.
Singh, V. (2015). Hearing in India: All aspects.
Otolaryngology online Journal.
V Colletti, F. F. (2001). Hearing habilitation with auditory brainstem implantation in two children with
cochlear nerve aplasia. International Journal of
Pediatric Otorhinolaryngology , 99-111.
V Colletti, V. M. (2004). Cochlear Implant Failure: Is
an auditory brainstem implant the answer? Acta
Otolaryngology, 353-400.
Varsha M. Joshi, D. •. (2012). CT and MR Imaging of the Inner Ear and Brain in Children with Con-
genital Sensorineural Hearing Loss. RadioGraphics.
CORRESPONDENCE AUTHOR
1aRanjith Rajeswaran, Principal
MERF Institute of Speech Hearing Pvt ltd Madras Ent Research Foundation Pvt ltd Contact No: 9940016610
Email address: [email protected].