Construction of Fare Meter Using Pic
Microcontroller
Sogbaike C.O1*, Sogbaike A.S2, Oguchi .E,3 Ahoro .O.4 , Edafeadhe Godspower5
1*4 Delta State Polytechnic, Otefe-Oghara, Delta State 2 Benson Idahosa University, Benin City, Edo State
3University of Benin, Benin City, Edo State
5Department of Mechanical Engineering, School of Engineering, Delta State polytechnic, Otefe
DOI: 10.29322/IJSRP.8.12.2018.p84109 http://dx.doi.org/10.29322/IJSRP.8.12.2018.p84109
Abstract- Fares are usually calculated according to a combination of distance and waiting time, and are measured by a fare meter. This solves the arbitrary charging of passengers boarding taxi and different point. The fare meter consist of speed sensor, microcontroller (PIC 16F86A), power supply unit, display unit and input buttons to set the amount per unit distance. The speed sensor picks up signal from the rotating gear wheel which is interfaced with the microcontroller to compute the corresponding distance. The multiplication unit of cost per meters is (NAIRA) N 1.50 per meter, this provides the fare rate.
Index Terms- fare meter, microcontroller ,measured distance, rotating gear.
I. INTRODUCTION
ublic transportation is one of the most demanded basic needs of a developing city/town (MD et.al 2016). Accurately qualifying the taxi fares is a hard problem for drivers and passengers. Insufficiency of taxi stations, not specified price of taxi lines, getting on between stations and not calculated movement amount, cause difference in the prices (Assadifard et.al 2014 ; Emmanuel, 2015) . Hence the use taximeter systems that can help decrease the problems. A taximeter is a device that is used in taxis to record and show the fare payable for the journey (Md. T., 2005). A taximeter can only be activated to start recording the fare at certain times. If the taxi has been hailed or obtained from a taxi rank, the taximeter can only be turned on when the person enters the taxi. If the taxi has been booked, the taximeter can only be turned on when the person has been notified that the taxi has arrived or at the specific time that the person booked the taxi for (for example 8am). Regardless of how the taxi has been hired, the taximeter must be turned off when the taxi has arrived at the destination and before asking for payment. Nigeria is among the country in Africa that has no effective transport law or policy governing fare rate per unit distance (Draft policy 2010). Fare meter innovation is designed to provide an articulate solution that will calculate the actual cost of journey within Nigeria. Virtually all developed countries have transport laws or policies in place and if Nigeria can look towards this direction, it will rescue the citizens from these reports of abusive and unscrupulous drivers preying on both local and foreign travelers by adopting fare meter system.
In most road particularly airport and seaport in Nigeria, transport accomplice (conductors) has been alleged, charging grossly bloated fares from foreigners, luggage and travelers whom they picked up at the arrival/exit areas in Nigeria (Oguchi 2016). It has been decided that fare meter for vehicles and taxis help passengers pay fare price along with the assurance that they will not become a victim of fare deceit. Place, Time, Fuel Consumption, Additional Charge, Date (holiday), Traffic Hour and Cost of Fuel are methods used to measure fare or cost of transportation (Julio and Ximena 2015) . All fare meter design from literature uses either of these to compute fare. There exist several papers on taxi fare meter designs.
MD. et.al (2016) designed and developed a fare meter for the BRACU university in Bangladesh that consist of several components which includes Arduino board, GSM module, GPS shield, GPS antenna, Bluetooth, Display, and Power supply. The fare meter computes fare with both distances covered and waiting time. The system design specification required that any speed below 10km/h is considered a waiting time and is combined with distance to generate the fare. The GPS device in their design helped to determine be distance covered with the help of longitude and latitude data computed with Haversine formular for great distance calculation in a sphere. The GSM module help transmit the location of the taxi for monitoring and security. The Bluetooth device serves as an interface between the arduino board and the android developed application to constantly keep update of the distance and computing the fare rate which is then sent back to the display via the Bluetooth meaning the communication of the Bluetooth is bidirectional to ensure effective update on the current distance covered and corresponding fare.
Emmanuel (2015), designed and developed a Real Time Taxi Monitoring and Passenger Inventory System. The system incorporated a seat sensor that counts the number of passengers entering the taxi, computes and sends the corresponding distance covered to the company through a GSM/GPS/GPRS modem with antennae. However this system did not consider wait time as done in MD. et.al (2016).
Julio & Ximena (2015) improved on the use of GPS which obtains longitude and latitude to compute distance covered. They place a maximum speed of 40 km/h for taxi and divided the city into three squares with each sides of 1km each. The computation of the fare is done with an interval of 20km distance and the value is summed up to give the fare upon completion of the distance or
trip. And innovative step is that the GPS device is somewhat hidden from the taxi driver so as to avoid manipulation.
Assadifard et.al (2014) in a paper titled Taximeter Design Based on Digital Image Processing Approach solved a nagging problem where a passenger drops off thus computing the fare becomes an issue because of lack of recognition as to who dropped and who didn’t. The paper introduced the use of four cameras for face recognition process coupled with four buttons to instantly compute the fare based on the image gotten from the camera. The system incorporated GPS as a device for distance computation and fare is calculated after every 300 meters distance moved. Also the city map system added to the system provides the shorted route analysis computation using Dijkstra Algorithm to reduce distance to destination.
Md. T. I (2005) designed a fare meter using PIC 16F84A microcontroller with four (4) seven segment displays which shows the fare and the corresponding distance covered. In their design the minimum and maximum distance a taxi can move was not expressly stated. Also the distance sensor was not described raising a suggestion that it could be from the car analog odometer device. The odometer operated by a pair of gears from the speedometer shaft. Its motion was carried through the gears to the kilometer number rings. Then by multiplying the traveled distance and unit price per kilometer, total amount of fare is calculated. Tejaswi et.al (2016) improve on accuracy of the fare-o-meter and provide notification facility on GSM mobile phone.
This proposed work is an attempt to design a taxi-meter that uses the GPS to determine an accurate taxi fare based on the distance traversed and this information can be transmitted to a remote server using GSM modem. The purpose of this system provides the following features: Shortest path from source to destination, Accurate fare based on the distance traversed, Real time tracking, Time to time updates through SMS with the help of GSM module. The use of Taximeter in Nigeria is still at it infancy thus the challenges that comes with none usage is enormous ranging from unscrupulous fare rate from conductors and taxi drivers, the use of abusive language on passenger over dispute of fare, lack of proper documentation of taxis resulting in tendencies to steal from passenger etc. the introduction of taximeter will to a certain extent curb all these challenges.
II. DESIGN
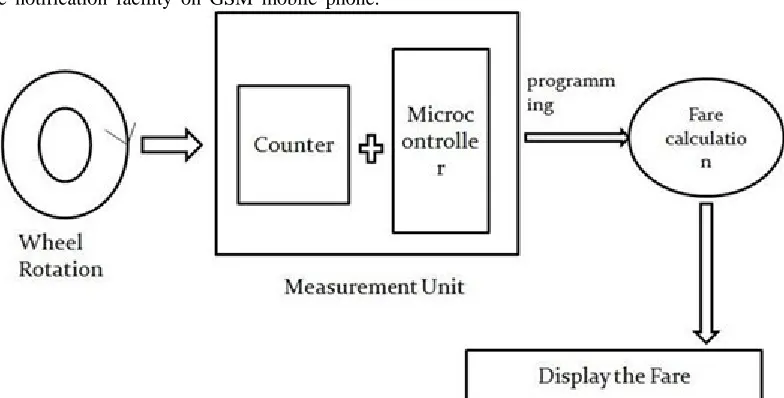
[image:2.612.109.501.352.551.2]The fare meter design intended to measure the cost of fare through the measure distance covered on the basis of a signal delivered to transducer, it calculates and displays on LED screen the fare to be paid on a journey based on the calculated distance of the journey is shown in figure 1.
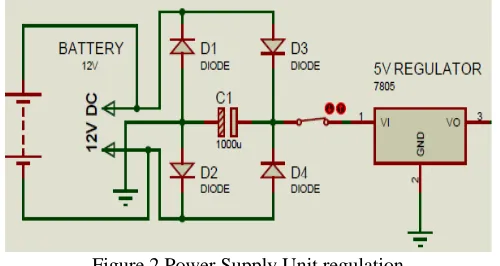
Figure 2 Power Supply Unit regulation Figure 2 shows the process of power regulation and
rectification. The supply voltage from a car battery is +12 v. the required voltage is +5 voltage which is obtained when a full wave rectification process is combined with a voltage regulator LM 7805
Filter Capacitor
The 1000µf/25V capacitor is used to filter the ripple levels present in the rectified voltage. The values of the capacitor used with a 50Hz supply may range from 100µf to 30,000µf depending on the load current and the degree of smoothening required. In selecting capacitors, the ripple voltage required is 10% of the peak value. The selection of this capacitor is based on the following calculation.
For a charged capacitor, Q = CV = It Thus, 𝐼𝐼𝐿𝐿 = CV/t
Thus C = 𝐼𝐼𝐿𝐿*t/𝑉𝑉𝑟𝑟𝑟𝑟𝑟𝑟𝑟𝑟𝑟𝑟𝑟𝑟 T = T =1/f
For full wave rectifier, the frequency of the rectified DC output is 2X the supply frequency = 100Hz
T = 1/100 =0.01s
𝑉𝑉𝑟𝑟𝑟𝑟𝑟𝑟𝑟𝑟𝑟𝑟𝑟𝑟(peak) = (𝑉𝑉𝑟𝑟𝑟𝑟𝑝𝑝𝑝𝑝−𝑉𝑉𝑑𝑑𝑑𝑑) 𝑉𝑉𝑑𝑑𝑑𝑑 = 𝑉𝑉𝑜𝑜
𝑉𝑉0 = 𝑉𝑉𝑟𝑟𝑖𝑖√2
𝑉𝑉𝑟𝑟𝑖𝑖 = 24 – 𝑉𝑉𝑑𝑑
𝑉𝑉𝑑𝑑 being total diode drop = 0.7*2 =1.4
𝑉𝑉𝑟𝑟𝑖𝑖 = 12 - 1.2 = 10.8V
𝑉𝑉𝑑𝑑𝑑𝑑 = 𝑉𝑉0 = 𝑉𝑉𝑟𝑟𝑖𝑖√2
𝑉𝑉0 = 10.8 * 1.414 = 15.27V
𝑉𝑉𝑟𝑟𝑟𝑟𝑝𝑝𝑝𝑝= 2𝑉𝑉𝑚𝑚𝑝𝑝𝑚𝑚 Where 𝑉𝑉𝑚𝑚𝑝𝑝𝑚𝑚 = 2𝑉𝑉𝑟𝑟.𝑚𝑚.𝑠𝑠 Therefore,
2𝑉𝑉𝑚𝑚 = 2 x √2 x 𝑉𝑉𝑟𝑟.𝑚𝑚.𝑠𝑠
𝑉𝑉𝑟𝑟.𝑚𝑚.𝑠𝑠 = 21.6V
𝑉𝑉𝑟𝑟𝑟𝑟𝑝𝑝𝑝𝑝= 2 x √2 x 21.6 = 43.20V
𝑉𝑉𝑑𝑑𝑑𝑑 = 0.6366 x 𝑉𝑉𝑟𝑟𝑟𝑟𝑝𝑝𝑝𝑝= 0.637 x 61.0 = 27.5V
𝑉𝑉𝑟𝑟𝑟𝑟𝑟𝑟𝑟𝑟𝑟𝑟𝑟𝑟 = 𝑉𝑉𝑟𝑟𝑟𝑟𝑝𝑝𝑝𝑝 - 𝑉𝑉𝑑𝑑𝑑𝑑 = 43.20 – 27.5 = 15.7V Therefore, 𝑉𝑉𝑟𝑟𝑟𝑟𝑟𝑟𝑟𝑟𝑟𝑟𝑟𝑟 = 2 x 15.7 = 31.40V 10% ripple = 10/100 x 31.40 = 3.14V
From C = 𝐼𝐼𝐿𝐿*t/𝑉𝑉𝑟𝑟𝑟𝑟𝑟𝑟𝑟𝑟𝑟𝑟𝑟𝑟 with 𝐼𝐼𝐿𝐿 – total load on the controllerµ C = (0.01 x 0.28A)/ 3.14V
C = 891µ𝐹𝐹 (1000µ𝐹𝐹 was used as preferred value)
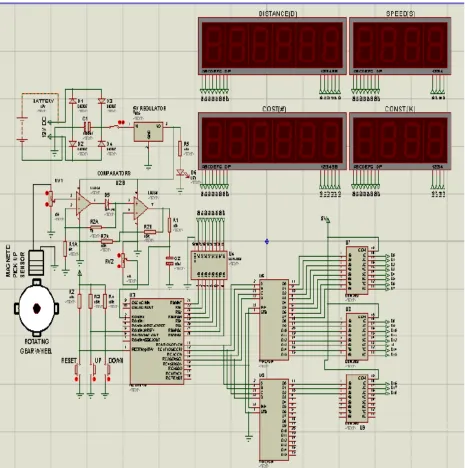
Figure 3 circuit diagram of fare meter with digital display
2.2 WORKING PRINCIPLE OF FARE METER
III. RESULTS
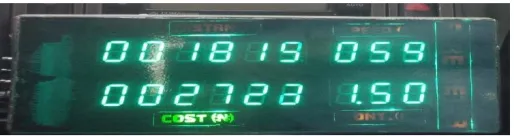
[image:5.612.40.297.198.266.2]The fare meter display unit has a display unit with dimension of 280 mm by 120 mm. The distance and time rate of fare meter is set, including the initial distance interval and the initial time interval, and local tax rate per unit distance (N 1.50 PER 100 METERS) as shown in figure 4. The minimum mileage the fair meter can accommodate is 500 miles and limitless maximum. The fair meter was able to withstand vibration due to motion of the vehicle. Display switching frequency and the scan rate of the fare meter are 960 Hz & 0.0014167 seconds respectively translate into increase in operational speed of the fare meter
Figure 4 fare meter display
IV. CONCLUSION
A lot of people travel using the taxi daily. And a lot of them are overcharged by the taxi driver. Development of a smart yet cost effective fare meter can accurately measure the distance and also can give solution to the fare payment difficulties. The fare-meter uses the rotating wheel of the gear sensor to determine the distance and is computed with a constant unit of amount in naira(N) to determine the fare. This is much better than the taxi driver randomly stating prices for greedy gain.
REFERENCES
[1] Draft national transportation policy August 2010. Federal government of Nigeria pp 1-60 kyg.nigeriagovernance.org/attachment/organization/act/262_draft
[2] Emmanuel K., (2015) Developing a Real Time Taxi Monitoring and Passenger Inventory System in Zimbabwe. Midlands State University, Zimbabwe university thesis pp 1- 47
[3] Julio. S. and Ximena L. A , (2015) GPS Assistance taximeter suited to the characteristics Of a City 7th Latin American Workshop On Communications Arequipa, Peru Published on CEUR-WS: http://ceur-ws.org/Vol-1538/ [4] MD. T. H., Benazir M and Tanvir A, (2016) Bracu Bat GPS Based Taxi
Fare Meter BRAC Bangladesh University Thesis pp 1-96
[5] M. J. Assadifard, M. Javanmard, and M. H. Moazzam (2014) Taximeter Design Based on Digital Image Processing Approach International Journal of Information and Electronics Engineering, (4) 6, pp 409 – 412
[6] Md. T. I (2005) design and fabrication of fare meter of taxicab using microcontroller Proceedings of the International Conference on Mechanical Engineering (ICME) Dhaka, Bangladesh pp 1-5
[7] Oguchi .E. (2016) design and construct an automated fare meter using microcontroller based digital speedometer technology university of Benin. Thesis pp 1-68
[8] Tejaswi .B, Komal .J., and Kamini J,(2016) GPS and GSM Based Smart Taximeter National Conference on “Internet of Things: Towards a Smart Future” & “Recent Trends in Electronics & Communication” (IOTTSF-2016) In Association With Novateur Publication pp 1-5 https://www.ijiert.org/admin/papers/1456761465_IOTTSF-2016.pdf
AUTHORS
First Author – Sogbaike C.O, Delta State Polytechnic,
Otefe-Oghara, Delta State , [email protected]
Second Author – Sogbaike A.S, Benson Idahosa University,
Benin City, Edo State
Third Author – Oguchi .E, University of Benin, Benin City,
Edo State
Fourth Author – Ahoro .O, Delta State Polytechnic,
Otefe-Oghara, Delta State
Fifth Author – Edafeadhe Godspower, Department of