QUALITY OF CAPITAL EXPENDITURE
PROGRAM ON REGIONAL WORKING UNIT
Jovan Febriantoko1; Febrianty2
PalComTech Polytechnic
[email protected], [email protected]
DOI: 10.29322/IJSRP.8.3.2018.p7553 http://dx.doi.org/10.29322/IJSRP.8.3.2018.p7553
Abstract: This study discussed the quality of capital expenditure program of the Regional Working Unit (RWU) in Wonogiri
District in 2010 until 2011. Data analysis method used quantitative and qualitative analysis with Value ForMoney (VFM) and Business Model Canvas (BMC) measurement approach. VFM analysis of this study showed that the efficient capital expenditure program was 81% and very efficient at 19%. Capital expenditure program that run effectively of 88% and run quite effectively of 12%. Based on the BMC approach, RWU's capital expenditure program in Wonogiri Regency had met the criteria set out in nine blocks of BMC. Inhibiting factors founded in this study were lack of human resources, database that had not been accurate, and no performance audit.
Keyword: VFM,BMC, capital expenditure, Public Sector Accounting
INTRODUCTION
Waste of funds, leakage of public funds, and inefficiency programs occur in local financial management. The performance budgeting system requires planning to implement the budget in an orderly, regulatory, economical, efficient, effective, transparent and accountable manner as outlined in programs and activities. Due to these problems, the implementation of Government Regulation no. 105 of 2000 as the standard for the evaluation of local government financial performance towards the achievement of targets and realization of the program and policy both in the components of income, expenditure components, and financing components to be a weak position. Assessment of the success of Regional Government Budget (RGB) as an accountability assesment of local financial management is more emphasized on the achievement of targets so less attention to how the budgeting process undertaken from the planning stage to the assessment stage, and whether the achievement of budget realization has been held economically, efficiently and effectively (Fatimatuzzahra, 2009).
Government Regulation No. 58 of 2005 provides rules on the assessment of work performance with benchmarks, performance indicators, and targets to be achieved. The final results of performance assessment are performance outcomes that are formulated in terms of economic, efficiency, and effectiveness(Asak, Yasa, & Astika, 2016). Economics and efficiency are closely related to the implementation of programs and activities, while the effectiveness associated with the implementation of pre-defined programs.
Weaknesses in the current assessment or performance measurement because it is only based on the targets and realization to know inputs, outputs, and outcomes, it is necessary to consider other ways as a comparison material to measure the performance of local government, especially on the financial aspect. (Fryer, Antony, & Ogden, 2009). One way that can be considered for performance assessment, from the budget planning stage to the budget execution stage is the concept of budget effectiveness. Effectiveness is related to the relationship between expected results and actual results achieved. Effectiveness is the relationship between output and purpose (Mahmudi, 2011). The greater the contribution of output to the achievement of objectives, the more effective the organization, program or activity (Williamson & Zeng, 2009). The economy has a focus on input and efficiency that is related to the output of the program or process, then effectiveness has a focus on the outcomes achieved. An organization, program or activity is considered effective if the results output can meet the expected goals, or can be said spending wisely(Grimsey & Lewis, 2005). The effectiveness of a program and its activities means that the use of the budget must fit the targets and goals set for the wider public interest (Park, 2010).
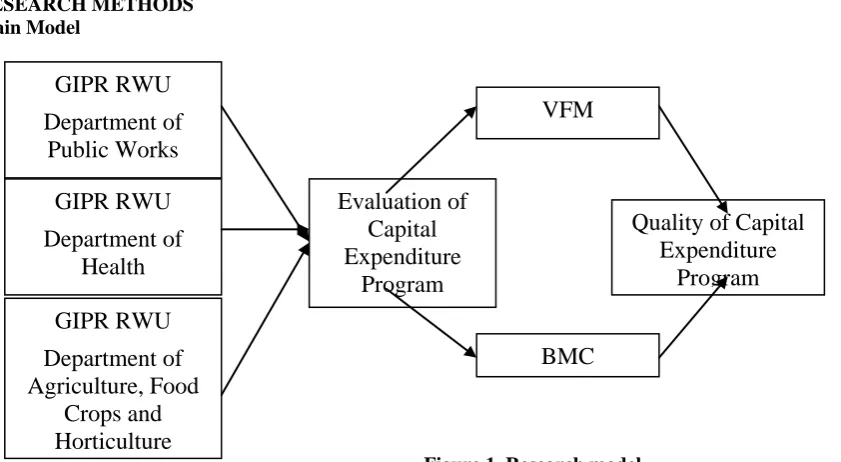
This research evaluated the quality of Capital Expenditure Program of Public Works Department, Department of Agriculture, Food Crops and Horticulture and Wonogiri Regency Health Office by using VFM approach. This purpose of this study was to determine the economics, efficiency, and effectiveness of capital expenditure on the Department of Public Works, Department of Agriculture, Food Crops and Horticulture and Wonogiri Regency Health Office and problems faced in efforts to achieve good performance.
Capital expenditures in Local Government represent budget expenditures for the acquisition of fixed assets and other assets that provide benefits over one accounting period Therefore, to know whether a spending can be included as a capital expenditure or not, it is necessary to know the definition of fixed assets or other assets and fixed assets capitalization criteria.
Output is a performance benchmark by-product (goods or services) generated from the program or activity in accordance with the input used; c). Outcome is a performance benchmark based on the level of success achieved based on the level of output program or activities that have been implemented (Williamson & Zeng, 2009). Measurement of performance and development of performance indicators that have been implemented will be continued in activities that can be referred to as performance evaluation. Implementation of performance evaluation shall be guided by agreed and determined measures and indicators (Micheli & Mari, 2014). Performance evaluation is also a feedback process for past performance that is useful for improving productivity in the future (Paarlberg & Lavigna, 2010). The quality of decision making is influenced by efficient financial management. Efficiency in financial management improves the quality of decisions taken and can improve the financial performance of local governments.
Khomsiyah, (2015) in the research described regional capital expenditure, effectiveness, and management efficiency and regional financial independence in East Java Province in 2013 and analyzed the influence of regional capital expenditure, effectiveness, and efficiency of management and local financial independence on the economic growth of the East Java Province in 2013. The results showed that capital expenditures had no significant effect on economic growth. The effectiveness of regional financial management had a significant effect on economic growth. The efficiency of regional financial management had a significant effect on economic growth. Regional independence had a significant effect on economic growth. So in the study concluded that the effectiveness and efficiency of management, local financial independence had a significant influence on economic growth. While capital expenditures had no significant effect on the economic growth of a region.
The research of Hafidh (2015) Research Hafidh (2015) aimed to determine the effect of regional financial ratios on public capital expenditures for economic growth. This research was quantitative descriptive. The study used RGB and PDRB data of City and Regency of DIY in the period of 2006-2011. The results of this study indicated that all regions still had a very low level of regional independence (KD). The level of regional efficiency (EFD) described the value of the category which was less good. The regional effectiveness variables showed a fairly effective ratio because all regions were able to exceed the predetermined revenue target. The study also found that the three regional financial ratios showed positive and significant results, but R2 was only 0.38. Based on figures obtained earlier, the regional financial performance proportioned from locally-generated revenue (LGR) had no effect on public capital expenditure. Capital expenditures affected PDRB positively and significantly. Thus, the regional performance model expressed in the region's financial ratios was only able to explain the change in the GRDP variable by 35%.
[image:2.595.49.470.403.634.2]RESEARCH METHODS Main Model
Figure 1. Research model
The type of data in this study used primary and secondary data. Primary data in the form of data taken directly, while the secondary data in the form of data was in the form of documents (Hox & Boeije, 2005).
Data Analysis Method
Value For Money (VFM)
Data analysis in this research using Quantitative and qualitative approach by using VFM performance. Measurement of VFM as follows: (Mahmudi, 2011)
a. Economy
Data analysis in this research using quantitative and qualitative approach by using VFM performance. Measurement of VFM is as follows: (Mahmudi, 2011)
Economic = Input / Input Price (Rp)
GIPR RWU
Department of
Public Works
GIPR RWU
Department of
Health
GIPR RWU
Department of
Agriculture, Food
Crops and
Horticulture
Evaluation of
Capital
Expenditure
Program
Quality of Capital
Expenditure
Program
VFM
b. Efficiency
Efficiency is the relationship between input and output in which goods and services purchased by the organization are used to achieve a certain output (Dian Merini, 2013). Mathematically the measurement of the efficiency ratio is as follows: (Mahmudi, 2011)
Efficiency = Output / Input .
C . Effectiveness
The effectiveness ratio is the relationship between the output and the defined goal (Mardiasmo, 2002). Effectiveness is measured by how far the level of output, the organization's policies and procedures achieve its stated objectives. For the formula to measure the effectiveness ratio: (Mahmudi, 2011)
[image:3.595.129.465.214.416.2]Effectiveness = Outcome / Output
Table 1. Performance Measurement Percentage
Performance Value Information
Value of Economic Performance: > 100 %
85 % to100 % 65 % to 84 % < 65 %
Economic Fairly Economic
Less Economic Not Economic Value of Efficiency Performance:
< 90 % 90 % to 99 % 100 %
> 100 %
Very Efficient Efficient Fairly Efficient
Not Efficient Value Performance Effectiveness:
≥ 100 % 85 % to 100 % 65 % to 84 %
≤ 65 %
Effective Fairly Effective
Less Effective Not Effective Source : (Mahmudi, 2011)
Business Model Canvas (BMC)
BMC is a business model concept developed by Alexander Osterwalder and Yves Pigneur. BMC is a strategy tool used to describe a business model and project a rationale on how organizations create, deliver, and capture value (Hanshaw & Osterwalder, 2016). BMC was previously called Business Model Generation (Osterwalder & Pigneur, 2010). BMC transforms complex business concepts to simplify through a canvas sheet of planning with nine interlocking key blocks that aim to map out strategies for building business that is competitive and successful in the future (Frick & Ali, 2013). The advantages of using BMC is to thoroughly know the strengths and shortcomings of the organization, the needs and profit analysis is performed quickly, it can map the organization to know the weakness since the early and understand the strength of the organization from the right point of view, and able to systematically describe an organization for the retrieval decisions toward more strategic management (Joyce & Paquin, 2016). The scheme of BMC in public organizations is illustrated as follows:
Main Service Provider
Key Programs Value Propositions
Public Relationship Public Segments
8
7
2
4
1
Key Resources Channels
6 3
Cost Structure Program Impact to Community
9 5
Source:(Hanshaw & Osterwalder, 2016)
Figure 2. BMC dalam Organisasi Publik
Based on the above table can illustrate the correlation between blocks. Each block has an association with another block based on the sequence of numbers in the image above. Explanation on the assessment of each block indicator is described as follows: (Hanshaw & Osterwalder, 2016)
1. Public Segments
[image:3.595.79.505.551.675.2]- What impact can the community provide? - What problems are we solving?
- What services can be provided for the community? - What is the needs of the community that can be fulfilled? 3. Channel
-Through what channels does the community segment want to achieve? - How do we achieve it?
- How are our channels integrated? -Which is the best?
- Which is the most cost-effective?
- How to integrate them with user routines? 4. Public Relationship
- What kind of relationship is expected of the community that needs to be built and maintained? - Which community has established a relationship?
- How is society integrated with the given service model? - How much does it cost?
5. Program Impact to Community
- Fourth digital keys by key performance indicator standards: - Cost per transaction,
- User satisfaction, - Level of refinement, - Digital takeup. 6. Key Resources
- What main activities are needed in the value proposition? - How is the distribution of services to the public?
- How is the relationship with the community? - What are the key performance indicators of service? 7. Key Programs
- What main activities are needed in the value proposition? - How is the distribution of services to the public?
- How is the relationship with the community? - What are the key performance indicators of service? 8. Main Service Provider
- Who are the key partners?
- Who are the key service providers?
- What are the main resources that can be obtained from partners? - What are the main activities undertaken by partners?
9. Cost Structure
- What is the most important cost in the service? - What are the most expensive key resources? - Which main activities are the most expensive?
[image:4.595.99.566.577.788.2]RESULTS AND DISCUSSION Quantitative Analysis
Table 2. Performance of Capital Expenditure Program of Public Work Department of Wonogiri Regency With VFM
RWU Program Value Pecentage Category
Year 2010 Department
of Public Work
Office administration service program
Economic 101.57% Very economic Efficiency 98.45% Efficient Effectivenes
s 100% Effective
Improvement of facilities and infrastructure of apparatus program
Economy 107.37% Very economic Efficient 93.14% efficient Effective
100% Effective
Road and bridge development program
Economy 103.78% Very economic Efficient 96.36% Efficient Effective 90% Fairly Effective Turap/talud/bronjong
development program
development program Efficient 93.97% Efficient Effective 93.33% Fairly Effective Year 2011
Office administration service program
Economy 102.36% Very economic Efficient 97.69% Efficient Effective 100% Effective Improvement of
facilities and infrastructure of apparatus program
Economy 100.75% Very economic Efficient 99.26% Efficient Effective
100% Effective
Road and bridge development program
Economy 103.88% Very economic Efficient 96.26% Efficient Effective 95% Fairly effective Rural infrastructure
development program
[image:5.595.69.565.51.249.2]Economy 100% Very economic Efficient 100% Very efficient Effective 100% Effective Source : processed data, 2017
Table 3. Performance of Capital Expenditure Program of Agriculture Department of Wonogiri Regency With VFM
RWU Program Value Percentage Category
Department of
Agriculture
Year 2010 Specific Allocation
Fund (SAF) Program in agriculture
Economy 103.71% Very economic Efficient 96.42% Efficient Effective 100% Effective BPLM Distribution
Facility Program
Economy 101.69% Very economic Efficient 98.34% efficient Effective 100% Effective
Year 2011 Office administration
service program
Economy 113.95% Very economic Efficient 87.75% Very Efficient Effective 100% Effective Improvement of
facilities and infrastructure of apparatus program
Economy 100.84% Very economic Efficient 99.17% Efficient Effective
100% Effective
[image:5.595.88.567.276.472.2]Source : Processed data, 2017
Table 4. Performance of Capital Expenditure Program of Public Health Department of Wonogiri Regency With VFM
RWU Program Value Percentage Category
Department of Public Health
Office administration service program
Economy 114,85% Very economic Efficient 87,07% Very Efficient Effective 100% effective Improvement of facilities
and infrastructure of health service
Economy 101,94 % Very economic Efficient 93,14% efficient Effective 100% effective Office administration
service program
Economy 102,78% Very economic Efficient 97,29% Efficient Effective 100% effective Improvement of facilities
and infrastructure of apparatus program
Economy 105,23% Very Economic Efficient 95,03% Efficient Effective 100% effective Source : Processed data, 2017
Source: processed data, 2017
Figure 3. Percentage of Capital Expenditure Program Efficiency
Source: processed data, 2017
[image:6.595.91.456.294.508.2]Figure 4. Percentage of Capital Expenditure Program Effectiveness
Figure 3. shows the percentage of efficiency and effectiveness level of capital expenditure on RWU. Description of the percentage in the diagram shows that the capital expenditure program of RWU in Wonogiri Regency runs with efficient category of 81% and highly efficient category by 19%. Related to the effectiveness of capital expenditure program implementation of RWU in Wonogiri of 12% in the fairly effective category and 88% in the effective category.
Qualitative Analysis
Performance Accountability of RWU Capital Expenditure Budget in Wonogiri Regency
BMC is used to evaluate the quality of capital expenditure programs. Based on indicators on the 9 blocks in BMC, the quality of RWU's capital expenditure program in Wonogiri Regency can be briefly grouped into 9 BMC blocks described as following figure.
Table 5. BMC Analysis Main Service
Provider
Key Programs Value Propositions Public Relationship Public Segments - Contractor
- Consultant
- Infrastructure development - Development of
SAF
- Health services
- Improvement of infrastructure - Food
independence - Adequate health
facilities.
- Government
Instance Performance Report (GIPR)
- Budget
Transparency
- Musrenbang
Community of Wonogiri
Regency
Key Resources Channels
Efficient
Very Efficient
Effective
Fairly
[image:6.595.60.538.657.778.2]- Human Resources (employee)
- Financial Resources (RGB)
- Physical Resources (Tools)
- Activities - Projects
- Technical guidance - Socialization - Community service
Cost Structure Program Impact to Community
- Cost of procurement of goods and services
- Operational costs
- Implementation of vision and mission - Implementation of community service
Source: processed data, 2017
Analysis of GIPR RWU in Wonogiri Regency with BMC approach is described as follows: 1. Public Segment
The community segment blocks focus on identifying targeted community groups as targeted capital expenditure programs which aimed to serve the community. The community of Wonogiri Regency is from the lower, middle to upper class and consist of various age groups. Wonogiri Regency Government hopes that the capital expenditure program that has been implemented can give a positive impact on the entire community of Wonogiri Regency.
2. Value Propositions
Value proposition is used to identify the needs of the Wonogiri Regency community, to know the capability of the Wonogiri regency government in the implementation of the program, then how can the local government improves the performance and provide services that affect the life of the community.
The values that can be found in the value proposition block are as follows: a. Improvement of infrastructure
b. Food independence c. Adequate health facilities. 3. Channel
Channel is a medium to reach the community. In an effort to reach the community, the government of Wonogiri Regency has the following media:
a. Activities b. Projects
c. Technical guidance d. Socialization e. Community service
The above media can make capital expenditure program which implemented by Wonogiri regency in accordance with what impact expected by society.
4. Public Relation
In this research, public relations block focuses on the pattern of government relations with the community. The form of government relations with the community varies. The form of relationship with the community as follows:
a. Deliberation of Planning and Development (Musrenbang) b. LAKIP
c. Budget Transparency
The relationship with the community is not only limited to the delivery of public aspirations to the government, but also the delivery of government accountability to the community which is the principle of openness in the implementation of local government. The relationship between the community and the government takes place when there is conformity between the goals set by the implemented programs.
5. Program Impact to Community
The quality of the capital expenditure program in this block is determined by the program's ability to project future events. Capital expenditure program is expected to accommodate the needs of the community in Wonogiri regency in the future.
The form of the quality of capital expenditure program in Wonogiri Regency can be seen from the performance indicators that have been dressed with the vision and mission of the Regional Government and the implementation of services for the community.
6. Key Resources
The analysis undertaken in this block can be determined through the ability to predict the human resources, financial resources and physical resources required, in addition, the ability of the Wonogiri Regency Government to utilize various resources in the appropriate time and amounts is also assessed as strength in this element.
The human resource in this block is competent employees. Financial resource is the funding of programs derived from RGB and physical resource is the availability of equipment and other physical resources that support the implementation of programs and activities.
7. Key Programs
community. The Wonogiri Regency Government's capital expenditure program has been referring to infrastructure development, SAF development, and health services.
8. Main Service Provider
This block is focused on Wonogiri Regency Government partners and their role in providing the needed resources. Wonogiri Regency Government in running the capital expenditure program, in cooperation with service provider partners through a process of procurement of goods and services that are transparently informed to the public. The main service provider partners of the Government of Wonogiri Regency are contractor and consultant which funded by the RGB that in accordance with the budget ceiling and the agreed Estimate Price which has been agreed.
9. Cost Structure
The last block is the Cost Structure. This block focuses on the costs that emerge from the execution of activities. In the capital expenditure program in the Government of Wonogiri Regency that appears in the spending program is the cost of procurement of goods and services and operational costs.
Based on the analysis of nine blocks BMC can be described that RWU in Wonogiri Regency is able to meet the criteria which set out in BMC.
Problems in Achieving the Quality of Capital Expenditure Program of Wonogiri Regency RWU The obstacles found in RWU in Wonogiri Regency are outlined below.
1. Available Human Resources have not been able to accommodate the needs in serving the community. 2. RGB is not fully able to finance the proposed program.
3. The absence of local regulations on the implementation of minimum service standards. 4. Unclear information systems to support program activities
5. Performance audit has not been implemented as a material evaluation of local government performance and the achievements obtained.
CONCLUSION
The conclusions of this research are:
1. Based on the VFM Approach, the capital expenditure program in RWU in Wonogiri Regency in 2010 and 2011 outlined in accordance with the targeted previously.
2. The quality of RWU's capital expenditure program in Wonogiri Regency in 2010. and 2011 was in accordance with what is planned based on BMC evaluation.
3. There are some obstacles in the implementation of capital expenditure program, the obstacles are: a. Lack of human resources support that support the implementation of activities.
b. Unavailability of accurate and valid data base
c. The absence of a clear information system and a good performance audit to produce maximum program quality
The limitations of this study are :
1. This research only took the object of research at Department of Public Works, Department of Agriculture, Food Crops and Horticulre , Department of Health in Wonogiri.
2. This research only analyzed how the quality of capital expenditure program in Department of Public Works, Department of Agriculture, Food Crops and Horticulture and Department of Health in Wonogiri Regency based on VFM and BMC approach
Based on the limitations of the above, the suggestions given by researchers are as follows:
1. Future research is expected to do the research with broader research objects and use more developed methods.
2. Future research is expected to analyze not only the quality of capital expenditure programs but on the expenditure of Local Government in depth and comprehensive.
REFERENCES
Asak, P. R. A., Yasa, G. W., & Astika, B. I. P. (2016). Kemampuan Asimetri Informasi, Ketidakpastian Lingkungan, Budget Emphasis, dan Kapasitas Individu sebagai Variabel Moderasi terhadap Partisipasi Anggaran pada Budgetary Slack. E-Jurnal Economy Dan Bisnis Universitas Udayana, 5(2), 219–228. Retrieved from http://id.portalgaruda.org/index.php?ref=browse&mod=viewarticle&article=411679
Dian Merini. (2013). Analisa Efficiency Pengeluaran Pemerintah Sektor Publik di Kawasan Asia Tenggara: Aplikasi Data Envelopment Analysis. Working Paper Universitas Brawijaya, 1–31.
Erol, A., Mercan, M., & Yergin, H. (2015). The Measurement of Socio-Political and Economical Sensitivities: The Case of Hakkari. Procedia Economics and Finance, 23(October 2014), 1471–1475. https://doi.org/10.1016/S2212-5671(15)00410-4 Fatimatuzzahra, F. (2009). Analisis Rasio Keuangan SKPD untuk Mevalue Kinerja Pemda dalam Pengelolaan Keuangan
Daerah Studi Kasus Pada Pemda Kabupaten Majalengka. Universitas Widyatana. Retrieved from http://repository.widyatama.ac.id/xmlui/handle/123456789/6264
Frick, J., & Ali, M. M. (2013). Business model canvas as tool for SME. IFIP Advances in Information and Communication Technology, 415, 142–149. https://doi.org/10.1007/978-3-642-41263-9_18
Management, 22(6), 478–498. https://doi.org/10.1108/09513550910982850
Grimsey, D., & Lewis, M. K. (2005). Are Public Private Partnerships value for money?: Evaluating alternative approaches and comparing academic and practitioner views. Accounting Forum. https://doi.org/10.1016/j.accfor.2005.01.001
Hafidh, A. A. (2015). Analisis Rasio Keuangan Daerah dalam Mempengaruhi Belanja Modal Publik bagi Pertumbuhan Economy. Humaniora, 18(2).
Hanshaw, N., & Osterwalder, A. (2016). The Business Model Canvas. Strategyzer. https://doi.org/10.1017/CBO9781107415324.004
Hox, J. J., & Boeije, H. R. (2005). Data Collection, Primary vs. Secondary. In Encyclopedia of Social Measurement (pp. 593– 599). https://doi.org/10.1016/B0-12-369398-5/00041-4
Joyce, A., & Paquin, R. L. (2016). The triple layered business model canvas: A tool to design more sustainable business models. Journal of Cleaner Production, 135, 1474–1486. https://doi.org/10.1016/j.jclepro.2016.06.067
Khomsiyah, L. (2015). Analisis Pengaruh Belanja Modal, Efektivitas dan Efficiency Manajemen Serta Kemandirian Keuangan Daerah Terhadap Pertumbuhan Economy (Suatu Telaah Empirik Kabupaten/Kota Provinsi Jawa Timur). Universitas Jember.
Mahmudi. (2011). Akuntansi Sektor Publik. Yogyakarta: UII Press.
Mardiasmo. (2002). Elaborasi Reformasi Akuntansi Sektor Publik: Telaah Kritis Terhadap Upaya Aktualisasi Kebutuhan Sistem Akuntansi Keuangan Pemerintah Daerah. Journal Akuntansi & Auditing Indonesia, 6(1), 63–82.
Micheli, P., & Mari, L. (2014). The theory and practice of performance measurement. Management Accounting Research, 25(2), 147–156. https://doi.org/10.1016/j.mar.2013.07.005
Oluwatobi, S. O., & Ogunrinola, O. I. (2011). Government Expenditure on Human Capital Development: Implications for Economic Growth in Nigeria. Journal of Sustainable Development, 4(3), 72–81. https://doi.org/10.5539/jsd.v4n3p72 Osterwalder, A., & Pigneur, Y. (2010). Business Model Generation: A Handbook for Visionaries, Game Changers, and
Challengers. A handbook for visionaries, game changers, and challengers. https://doi.org/10.1523/JNEUROSCI.0307-10.2010
Paarlberg, L. E. ., & Lavigna, B. . (2010). Transformational leadership and public service motivation: Driving individual and organizational performance. Public Administration Review, 70(5), 710–718. https://doi.org/10.1111/j.1540-6210.2010.02199.x
Park, Y. (2010). Introduction to Program Evaluation. Evaluation, (April), 55–76. https://doi.org/10.1080/00039896.1962.10663238