Analysis of the Contribution of Foreign Policy
Strategies to the Economic Development in Rwanda
Aimé Muyombano I. PhD Scholar*; Prof. Maurice M. SAKWA, PhD**, Dr. Jared DEYA,PhD ***; Prof. Eugene
Ndabaga, PhD****
* School of Development Studies and Communication, JKUAT, Nairobi-Rwanda **Senior Lecturer and COD Development Studies, JKUAT, Nairobi-Kenya *** Lecturer School of Development Studies and Communication, JKUAT, Nairobi-Kenya
**** Senior Lecturer School of Education, University of Rwanda, Kigali-Rwanda"
DOI: 10.29322/IJSRP.8.5.2018.p7746 http://dx.doi.org/10.29322/IJSRP.8.5.2018.p7746
Abstract- To analyse the contribution of Rwandan Foreign Policy Strategies and its Economic Development is pertinent to understand how Rwanda’s diplomacy has contributed to socioeconomic development of the nation. This study is important to various stakeholders in particular the Government of Rwanda, academicians, professionals and researchers. In this paper, researcher aimed at developing the notion conceptually. Specifically he built on the work of Nath, (2013), Kim. (2012), whom their works were based on the contribution of Strategic Partnership, regional, global to economic development. The target population was 214 from Public&Private Institutions. Primary data was collected using structured questionnaires. Secondary data was collected by reading and analysing relevant books and journals. Data was analysed using descriptive and inferential statistics. In particular, regression analysis was carried out to investigate the relationship between hypothesized variables. The study found out that foreign policy strategy has a statistically significant effect on economic development in Rwanda (F=9.757, R² = 0.783, Sig=0.004<0.05). With a p-value of 0.002 < 0.05, it can be concluded that wealth creation strategy has a statistically significant effect on economic development of Rwanda (F=9.757, R² = 0.783 Sig=0.004 at α=0.05). With a p-value of 0.003 < 0.05, it can be concluded that regional and global relationship strategy has a statistically significant effect on economic development of Rwanda (F=9.757, R² = 0.783, Sig=0.004 at α=0.05). With p-value of 0.002<0.05, it can be concluded that partnership strategy has a statistically significant effect on economic development in Rwanda (F=9.757, R² = 0.783, Sig=0.004 at α=0.05). The study established a positive contribution between foreign policy strategies and Economic Development in Rwanda. Therefore, the study recommends that partnership strategy should go hand in hand with economic diplomacy in order to attract foreign investors and enable strong trade negotiation for improving import and export promotion.
Index Terms- Partnership; Regional & Global and Wealth creation strategy
I. INTRODUCTION
t the Global historical and theoretical perspective, Foreign policy strategies goes back to primitive times where the immeasurable desires of the human being used to be based on collaboration with others to create a tactful cooperation. Then established foreign policies were built on a compromise between them that the most of these relations were carried out by word of mouth and left little direct archaeological evidence, (Nancy, et al., 2009).
According to the Gavin, (2013), illustrates that partnership; Regional, global relations and wealth creation strategies between States started to become more serious after the 2nd world war especially during the cold war when United States of America and western Europe countries were initiated in 1953 during the sent to the European Coal and Steel Community with American support the technical and financial cooperation between them; The partnership, regional, global relations and wealth creation of these two biggest economies in the world were focusing on the areas of economy, education, trade and investment.
For EU, (2013), the total investment of the United States of America in the European Union was three times higher than in all of Asia. To this date, the same report reveals that the European Union investment in United States of Americas is around eight times the amount of European Union investment in India and China together. European Union and United States of America investments are the real drivers of the transatlantic relationship that is contributing to the growth and jobs creation on both sides of the Atlantic block. The transatlantic relationship of the European Union or the United States of America is the largest trade and investment in the world, (Vandinika, et al., 2015).
started as 77 founding members of the organization, (Zukang. 2008).
Bruce, (2006), demonstrates how concepts of economic development were being based on traditional economics, which explain the efficient allocation of scarce resources of the country, and political economics. However, the social development and political process of development of the nation shows the role of values, attitudes and institutions in the process of development. Contrary to Bruce’s assumptions, Partnership strategy, regional and global relations strategy as well as wealth creation strategy seem to be effective in promoting socioeconomic developing of nations.
At the Continental, regional perspective; the given small size of most African economies and state borders that pay little heed to the distribution of natural endowments, regional economic integration is commonly seen as essential for Africa (Jaime de Melo, et al., 2014). The economies of many African countries have grown more rapidly over the past decade, significantly reducing extreme poverty for the first time in about half a century, and the continent has carved out a greater voice in global institutions, Jaime de Melo, et al., (2014).
The African integration arrangements was divided into two broad groups. Those that fit into the Lagos Plan of Action (LPA) adopted in April 1980, and those that were either in existence or came about outside the LPA which currently are collected by the Arab Maghreb Union (AMU/UMA), Economic Community of West African States (ECOWAS), East African Community, Intergovernmental Authority on Development (IGAD), Southern African Development Community (SADC), Common Market for Eastern and Southern Africa (COMESA), Economic Community of Central African States (ECCAS) and Community of Sahel-Saharan States (CENSAD) by encouraging Partnership. International governance fosters Diplomacy & International engagements; Regional & Global relations and Wealth creation values that shall continue to achieving the economic development of the said states, (UN report (2009).
The East Africa Community (EAC) has within a relatively short time since its establishment realized tremendous progress in regional cooperation and development, which is also supporting the economic development. In real economic terms, the region’s combined Gross Domestic Product has risen to $ 75 billion, from 20 billion in 1999. Following the enlargement of the EAC in 2007, the region’ combined population grew up combination of 130 million of people from Kenya, Uganda, Tanzania, Rwanda and Burundi, (Eric, 2013).
The Kenya and Tanzania Partnership under the regional economic integration and partnership was the oldest and operative in many areas by emphasizing on their economic development (Frederick. 2013). In 2014, Tanzania became the largest partner export destination of Kenyan goods within East Africa. Kenya's total exports to Tanzania in 2011 were valued at 488 million U.S. dollars as compared to 390 million dollars in 2010.
For many years, Uganda was the largest export destination for Kenyan goods. However, due to the lifting of trade restrictions within the EAC, Tanzania has become a major export destination, outstanding Uganda in 2014. In 2013, Kenya exported goods worth kes. 67 billion (Eur. 632 million) to Uganda. This made Uganda the second largest export destination
for Kenyan goods after the European Union; Uganda exported goods worth Kes. 15 billion (Eur. 144 million) to Kenya. Bilateral trade was worth Kes. 214.3 billion (Eur. 776 million) making Uganda the 7th largest trade partner in Kenya, Many Kenyan firms have operations in Uganda some Kenya's 7th largest trade partner; Many Kenyan firms have operations in Uganda, some of which are Kenya Commercial Bank, Equity Bank, and Nakumatt. As of 2014, Kenya is the largest investor in the East African Community (EAC), (Ssekika, 2014). At national perspective, Rwanda has over the years been comparatively successful in supporting the national leadership, ministries and other state agencies to promote Rwanda’s international interests, to project a positive image of the country based on its size and location mean that stronger integration within regional economies which was vital for further growth and this was reaping the benefits from the East African Community regional integration by having joined the block in 2007, Which is translating in improved economic, political and social prospects. Rwanda has also benefited from EAC stronger market and challenges have been addressed together as a region. Rwanda has been better in the last seven years as it has been able to benefit in several areas, (UNDP, 2011).
Through partnership, regional & global relations and wealth creation strategies, Rwanda gained a lot on projects of the NCP, including the construction of the standard gauge railway, regional power trade, the strengthening of a single customs territory and collaboration of infrastructure technology including regional mobile financial services, one single tourism visa, regional tourism agenda, African Growth, and Opportunity Act (AGOA), Imani development policy, Cross-border trade (CBT), Non-tariff barriers (NTB), SWG on trade, industry and investment, Common External Trade Policy (CETP), and the implementation of the one area network, (Berger, 2011).
Rwanda is focusing on second-generation economic reforms of export diversification, structural transformation, regional integration and financial sector as main elements of partnership, regional & global relations and wealth creation strategies which are contributing to the acceleration of socio-economic development and boost incomes of the poorest so that Rwandans can advance in their journey to prosperity, (Minaffet. 2006).
Rwanda at Work shows that the country has maintained 6.9% of her economic growth rate and macroeconomic stability for the first three-quarters of 2015 and projects a growth rate of 6.8% in 2016 (WB. 2015). By maintaining the partnerships, Regional and global and wealth creation strategies through efficient of development cooperation such as foreign direct investment and tourism promotion, acquisition and transfer of knowledge and technology, equitable world trade and regional integration, Intra-Africa cooperation and United Nations multilateral system; Rwanda should achieve its goals of medium income by increasing its economic development, (Ibid, 2015).
several International bodies. The country was celebrated for its green investment, Peace and Security component, clean and doing business; and that is why Rwanda should continue to maintain the mutual cooperation with Africa and the world as whole, (Minaffet,2006).
A number of studies including one by Arne et al., (2004), demonstrated that Rwanda’s foreign policy strategies including strengthening partnership, Regional & global relations and wealth creation strategy, do not have a lot of influence on the growth of national economic development even though, imports have risen sharply since 2004, largely as result of the cumulative costs of importing different products such as fuel and energy. Based on studies done in the past by different researchers as well as reports released by the Rwandan Government about what Foreign Policy strategies should continue to improve the contribution on economic development plan; the researcher believes that there is still a critical gap at demonstrating the contribution of Rwanda’s Foreign policy strategies on economic development. Sticking at this exemplified gap, the researcher decided to carry out a study, which titled “Analysis of the contribution of Foreign Policy strategies on Economic Development in Rwanda”. The study assist the Rwandan community in particular and the global community in general to understand the level of the contribution foreign policy to national economic development and bring to light the reliable findings on the assumption.
II. LITERATURE REVIEWS
This study is built on the underpinning theories and models, including the Partnership strategies theory by Ronald, (2000); The Theory and Practice of Global and Regional governance cooperation strategy: Accommodating American Exceptionalism and European Pluralism by Richard, (2005) and A Wealth Creation Approach model to Economic Development by Mallory, (2014)
2.1Theoretical and empirical framework 2.1.1 Theoretical Framework
Richard, (2005) and A Wealth Creation Approach model build this study on the underpinning theories and models, including the Partnership strategies theory by Ronald, (2000); The Theory and Practice of Global and Regional governance cooperation strategy: Accommodating American Exceptionalism and European Pluralism to Economic Development by Mallory, (2014).
2.1.1.1 Partnership strategies theory by Ronald W. Mc Quaid (2000),
The partnerships theory developed by Mc Quaid (2000), with the purpose of promote cooperation between Industrialized Countries or developed Sphere and developing countries or regeneration that should increase their National economic development. There are a number of assumptions underlying design the partnership component.
Firstly, the potential for synergy of some form, so ‘the sum is greater than the parts’. Secondly, the partnership involves both development and delivery of a strategy or a set of projects or operations; although each actor may not be equally involved in all stages. Thirdly, in public-private partnerships the public sector is not pursuing purely commercial goals. So a criteria of partnership is the presence of social partnership (so excluding purely commercial transactions)
Rornald W. Mc Quaid, explain more that Partnership involves co-operation, i.e. “to work or act together” and in a public policy can be defined as co-operation between people, organizations or Countries in the public or private sector for mutual benefit (Holland, 1984). Sets out a similar general definition of ‘private-public partnership’ as “any action which relies on the agreement of actors in the public and private sectors and which also contributes in some way to improving the urban economy and the quality of life”. Although the author argues that, this has limited conceptual value. Partnerships approaches have received widespread support from across the political spectrum, including policy makers, officials and local communities.
2.2.1.1 India’s Partnerships Strategy using Analytic Hierarchy Process model
A strategic partnership is a long-term interaction between two or more countries based on political, economic, social and historical factors. Such a partnership manifests itself in a variety of relationships.
India has signed “strategic partnerships” with more than 30 countries. Are these countries equally important for India? Or do they have their own hierarchy? For instance, India has strategic partnerships with the United States, Russia, China, Japan, UK, France and others. It is obvious that not all strategic partnerships are equally important. Some have a dominant political element, while others have a prominent economic dimension. In some cases, the security dimension may be the most important.
Arvind et al. (2011) Gupta Analytic Hierarchy Process (AHP) is one of the multi-criteria decision-making methods based on relative priorities assigned to each criterion in achieving the stated objective. This technique exploits the powerful idea of evaluation and selection of options based on a consistency test, goes with the subjective judgment of experts. Furthermore, the actual process carried out the analysis, which helped to the decision maker to prioritize the parameters in a manner that otherwise, might not be possible.
This model illustrates how government should determine in advance, if a relationship is one that will result in competitive advantage and is worthy of the time and resources needed to fully develop into a partnership. Further, all partnerships are not the same. How does government or management knows what type of partnership would provide the best pay-off? These questions may be answered by using The Partnership Model.
2.2.3. The Theory and Practice of Global and Regional governance cooperation strategy: Accommodating American Exceptionalism and European Pluralism by Richard, (2005),
According to Richard, (2005), Theorising about global governance cooperation strategy that should not be confused with
international relations has only become fashionable in the post-Cold War era, which he separated also to the ‘era of globalisation. Notwithstanding coordination problems that have arisen in a number of major policy domains in the European Union in the early years of the 21st century, the European Union is still the most institutionalised regional policy community exhibiting a complex system of governance and cooperation beyond the territorial state (Rosamond, 2000); But research on multi-level regional governance cooperation strategy in western countries is often detached from the wider analytical questions of an extra-European nature in the contemporary theory and practice of global and regional governance and cooperation strategy.
Richard Higgott added that the Globalisation and Regional strategy theories have exacerbated the need for new understandings (both normative and analytical) of governance and cooperation strategy to cope with the challenges It brings up; The key problem generated by globalisation is the disjuncture that exists between market structures and governance, cooperation structures which has noted ‘interdependence and the lack of governance, when combined, make a deadly mixture’.
Regional strategy model by SGS, 2010
Figure2. 2 Expanded "Global and Regional" Model by Richard, (2005)
The Western Melbourne Regional Development Committee and Lead West released a report by Shadow Government Statistics (SGS) Economics and Planning. It is important to develop an environment/culture that will foster innovation. A framework to support innovation includes integrating it into the business objectives by: Taking a holistic approach to innovation; establishing strong channels of communication and Fostering a culture of innovation. According to Dodgson et al. (2008), global surveys show that innovation occurs where leaders encourage, protect it executives actively manage and drive innovation where talk about innovation but do nothing about it, innovation is inhibited for an innovation strategy to be effective, it needs to be integrated into senior leaders' agendas. Using performance metrics and targets for innovation helps senior management integrate innovation into their normal pattern
of business and creates an environment where staff are comfortable with innovating and better use of existing talents is made.
Barsh et al. (2008), established a strong channels of communication networks that should determine the innovation effectiveness. Effective networks allow people with different kinds of knowledge and ways of tackling problems to cross-fertilize ideas; New ideas breed more new ideas, so networks can generate a cycle of innovation where developing the innovation strategy, think about how can create conditions that allow innovation to become part of daily discussions.
Source: Expanded "Global and Regional" Model by Peter et al (2005) Figure 2. 3 Expanded "Global and Regional" Model by Peter bock et al (2005)
This model help in advancing the Globalization initiative by bringing in the following tools, framework and insight such as: Globalization assessment tool for the organization to benchmark with others global organizations; Organizational Deoxyribo Nucleic Acid assessment tool and Assess Global Leadership Quotient for the leadership team.
Peter bock et al (2005), explanation on the model demonstrated that there is no right or wrong model to adopt or champion within a country’s organization. Essentially both models describe the same overall process when Globalization is managed both the internationally and regionally, the global development policies and strategies such as Sustainable
Development Goals and the Regional economic integration through Multinational and Transnational corporate, Trade Facilitation, Economic integration and Free movement can produce a huge support in terms of Bilateral trade agreement, Small, medium cross border trade agreement, trade in services and Investment; Economic development, technical assistance, financial support, budget support and Customization, movement of capital, movement of goods and services, movement of people and right to the residence which should support the national economic development in particular, the Regional economic integration process and the world affairs in general.
Source: Expanded "Global and Regional" Model by Peter et al (2005) Figure 2. 3 Expanded "Global and Regional" Model by Peter bock et al (2005)
Processes Facilitating Assessment of where your organization is compared to others; Consensus building in the top management team concerning Globalization strategy, creating their understanding and ownership for execution; Helping organization to align strategy, structure, culture and leadership for seamless global execution and Facilitation of the change process in your organization regarding Globalization.However, it is useful to be aware of both models, especially if the researcher has the misfortune of having to investigate into Documentation relating to regional and global relationship. The commonality in what these process models are seeking to describe under the headings of Globalization,
Internationalization, and Localization is to facilitate national economic development.
2.2.4 A Wealth Creation Approach model to Economic Development Mallory Lynn R. (2014)
investment and the growing of economic development of nation. Wealth Works, which used the principals of developing countries, wealth creation generates a systems-thinking approach to economic development that has to be implemented in regions across the country.
Richard (2000). Illustrates the linkages between economic production and the natural world requires to formulate a concept which is broader and richer than ‘land’. That classical notion has
heavy agricultural connotations and tends to focus our attention on geographic location, surface area, differential soil fertility, Ecological economists have recently proposed that recognize explicitly the essential role of ‘natural capital’ in commodity production.
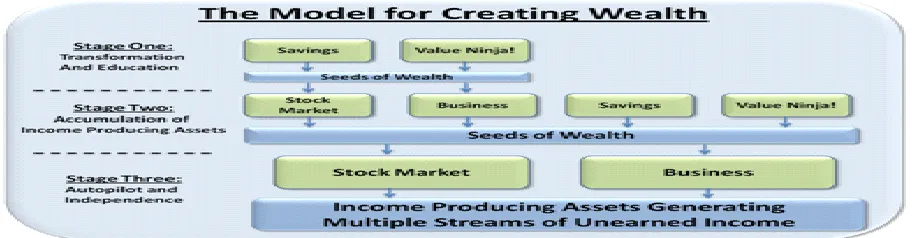
[image:6.612.78.534.152.271.2]The Model for creating Wealth:
Figure 2.4 The Model for Creating Wealth by Wealth-Building 101 (2010) Once have a mindset of saving money instead of spending
money, we start the accumulation process because it is the money that we want to start to put to work. Like a garden, the money save areseeds, ready to be sown, planted, tended, and then harvested. Whether it is a simple savings account, a brokerage cash account (more on that later), you need to have an account established that is the shelter for the seeds. The United Nations General Assembly recommended an Education for Sustainable Development that clearly recognizes the increasing need to integrate sustainable development issues and principles into education and learning. The World Conference on Education for Sustainable Development held in 2009 at Bonn, Germany recalled the contextual elements that should lead to the development of a new vision of education.
Establish the new stream of income, it can contribute more and more Seeds of wealth into the statement of work account used to build up the income producing assets and accelerate the magic of Compound interest such as enabling more and more of the businesses such as
Sole Proprietorship one of individual or married couple in business alone. Sole proprietorships are the most common form of business structure. This type of business is simple to form and operate, and may enjoy greater flexibility of management, fewer legal controls, and fewer taxes. However, the business owner is personally liable for all debts incurred by the business.
Some example learned lately that the market owns people by making money in the market whether it goes up, or down. Most people take a passive approach to the Market. They do not ‘own’ their decisions. They do not understand the basics, and they are intimidated away from it. Someone told them they should invest so they do, but they take the simple but destructive route of not being engaged in their decisions. The next one is
related to that: 2) Buy / Hold. They place an order and forget, no matter what the cycle, economy, or business situation of the particular company they are invested in.
2.1.2 Review of Empirical Literature
Different Knowledge and results derived from investigation, observation, experimentation, or experience done by different researches on similar work with foreign policy strategies (partnership, regional & global and wealth creation strategies) as opposed to theoretical knowledge based on logical or mathematical assumptions were based on what drove the researcher to provide his addition.
2.4.1 The contribution of partnership strategy on economic development in Rwanda
Mario, et al. (2013), demonstrates that partnership strategy as agreements and conventions, Lomé IV Convention and its precursors included were improved the bilateral and multilateral partnership performance of continent such as Africa, Caribbean and Pacific group of countries, with the ultimate aim of promoting their economic development.
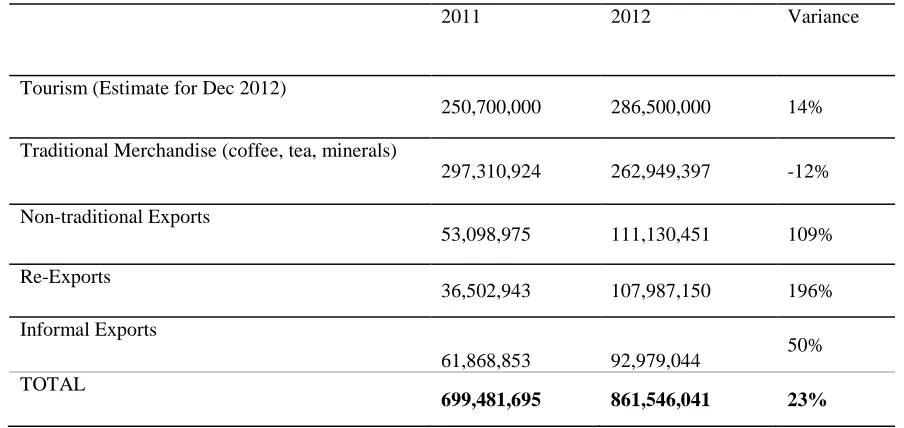
Table 3: Exports by grouping 2011 & 2012 (Us$ Fob)
2011 2012 Variance
Tourism (Estimate for Dec 2012)
250,700,000 286,500,000 14%
Traditional Merchandise (coffee, tea, minerals)
297,310,924 262,949,397 -12%
Non-traditional Exports
53,098,975 111,130,451 109%
Re-Exports
36,502,943 107,987,150 196%
Informal Exports
61,868,853 92,979,044 50% TOTAL
699,481,695 861,546,041 23%
Source: BNR Trade Statistics 2011 & 2012
Rwanda’s impressive export growth in 2012 came largely from exports outside of Rwanda’s traditional export sectors. This has also led to a shift in the composition of Rwanda’s export basket in 2012 compared to 2011, with the emergence of a more diversified export base and growth driven by Rwanda is
non-traditional and re-export sectors. A drop in non-traditional merchandise exports combined with rapid growth in non-traditional exports, re-exports and informal trade has resulted in a reduction of traditional export share of total exports from 66% in 2011 to 46% in 2012.
Figure 1: Composition of merchandise exports 2011 & 2012 (% of Total Exports)
Traditional Exports refer to Merchandise exports only (Coffee, Tea, Minerals) Source BNR Trade Statistics (2011 and 2012)
In Rwanda’s non-traditional export sectors, a number of products have emerged this year with substantially higher exports than in 2011. Rwanda’s main non-traditional exports include manufactured goods, horticultural goods and other items such as hides and skins, livestock and other various goods. Rwanda’s manufacturing sector has been performing particularly well, with exports up 142% in 2012 over 2011. Manufacturing exports accounted for 46% of Rwanda’s non-traditional exports until the end of September 2012, up from 40% in 2011.
Products in this sector include: products of the milling industry up 136% with total exports of US$19.8 million (see box 1); beverage exports up 116% with US$13 million in exports; iron and steel exports up 231% with US$ 5.6 million worth of exports; plastics up 263% with US$3.3 million worth of exports;
cement and other construction material up 189% with US$3 million in exports; soaps and washing preparation up 293% with exports of US$0.6 million and; animal and vegetable fats up 1022% at US$0.54 million. Rwanda’s largest manufacturing sector to see a fall in exports was footwear where exports saw a 25% drop from US$1.6 million to US$1.2 million.
taxation and climate change between the Government of Rwanda and development partners.
Minecofin, (2012), in their work on remittances and engaging with the philanthropic sector among other initiatives to diversify its financial resources and more gradually move away from aid dependency. At national level the Economic Development and Poverty Reduction Strategy-2 sector and thematic working groups and at a local level the Joint Action
[image:8.612.83.530.181.531.2]Development Forums, coordinate the implementation of Economic Development and Poverty Reduction Strategy 2 and ensure that Development assistance is used in line with its priority es International Non-Governmental Organisation are required to have approval from the Joint action development forum before they work in a district; those working at national level must have approval from the relevant line ministry.
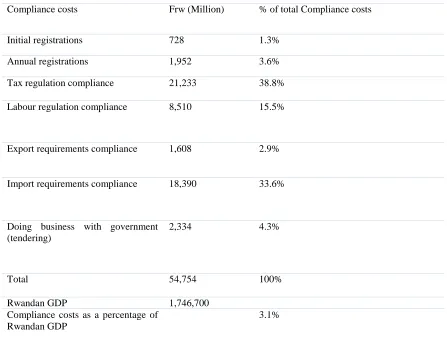
Table 10: Compliance costs faced by business in Rwanda
Compliance costs Frw (Million) % of total Compliance costs
Initial registrations 728 1.3%
Annual registrations 1,952 3.6%
Tax regulation compliance 21,233 38.8%
Labour regulation compliance 8,510 15.5%
Export requirements compliance 1,608 2.9%
Import requirements compliance 18,390 33.6%
Doing business with government (tendering)
2,334 4.3%
Total 54,754 100%
Rwandan GDP 1,746,700
Compliance costs as a percentage of Rwandan GDP
3.1%
Source.2.1:Rwanda Private Sector Development Strategy 2013-18 by MINICOM, 2013 Based on the support explanation from Minicom (2013),
the International markets are extremely competitive and many markets can have strict standards on products imported into their territory. Technical regulations extend from the level of toxins in food, to the safety of household electrical appliances. The safety of imports is of paramount concern to agencies concerned for the health of their citizens. Standards are the main way of signalling safety and quality, and ensuring that levels of consistency can be trusted; Rwandan firms therefore must meet the standards required in order to allow their goods to reach key foreign markets, (ibid 2013).
The particular area with heavy standards implications for Rwandan firms is in the exportation of food products to the European Union; the challenges faced are in quality control of processed food products and packaging, (UNCTAD, 2008). South Korea is classified as a non-traditional DP as they have
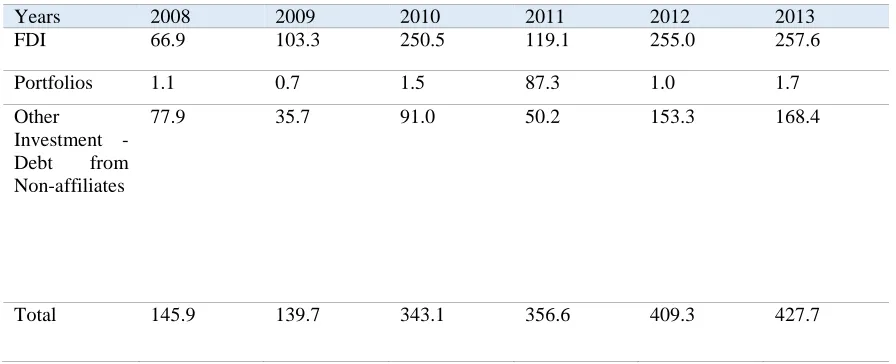
As for RDB et al (2014), demonstrated different investors from around 50 countries investing in Rwanda (FPI inflows are dominated by Foreign Direct Investment (60%) and are characterised by high-retained earnings. FPI increased from US$145.9 million in 2008 to US$427.7 in 2013 (Table 5). In the five years to 2013 its contribution to Gross Fixed Capital
[image:9.612.83.531.159.341.2]Formation grew by an average of 22.3 per cent a year and to Gross domestic product by an average of 12.8 per cent. Flows remain vulnerable to both external and internal economic factors, as is evidenced by the decline in 2010 due to the global economic crisis.
Table 5: Foreign Private Investment in Flows by Category 2008-13 in US$ Millions
Years 2008 2009 2010 2011 2012 2013
FDI 66.9 103.3 250.5 119.1 255.0 257.6
Portfolios 1.1 0.7 1.5 87.3 1.0 1.7
Other
Investment - Debt from Non-affiliates
77.9 35.7 91.0 50.2 153.3 168.4
Total 145.9 139.7 343.1 356.6 409.3 427.7
Source: Rwanda Development Board et al 2012, 2014
RDB (2014), shows how the collected stock of foreign private capital increased threefold between 2008 and 2013, from US$315.7 million to US$1,404.1 million. Foreign direct investment made up 59.7 per cent, other investments 34 per cent and portfolio investments 6.3 per cent. The main sectors of investment were Informational Communication Technology (40%), finance, insurance (20.4%) and manufacturing (14.6%). The East African Community and Democratic Republic of Congo have emerged as Rwanda’s largest export destinations in
[image:9.612.100.517.479.582.2]2012. Exports to the EAC and DRC grew by 81% in 2012 with their share of exports increasing from 31% in 2011 to 44% in 2012. Export growth to the region was driven by growth in exports from Rwanda’s non-traditional export sector and re-exports, an issue discussed in more detail below. Exports to Europe saw a year on year drop of 13% as a result of depressed exports from Rwanda’s traditional export sectors.
Figure 3: Destination of Rwandan Formal Merchandise Exports and Re-Exports 2011 & 2012 (%)
Source: RRA Trade Statistics 2011 and 2012 It is arguable that 2012 was the year when Rwanda made
the shift from being a country reliant on a few commodity exports to few destinations, to a country with a diversified export base supplying both regional and international markets. While there is still good potential for growth in Rwanda’s traditional export sectors, particularly the mineral sector, Rwanda is no longer reliant on a few commodities to drive export growth. Rwanda’s impressive merchandise export growth in 2012 was driven exclusively by non-traditional exports and re-exports. The emergence of a non-traditional export sector and a healthy re-export sector will also see regional neighbours and other African
Figure 4: Destination of Exports by Export type (Rwf Billion)
Source: RRA Trade Statistics 2011 and 2012
National Bank of Rwanda (2015), illustrated that the government has started borrowing on the international and domestic money markets to fund investment. It issued its first Eurobond in 2013 and raised US$400.00 million. Its interest rate stood at 6.2 per cent.
In the fiscal year 2014/15 the Eurobonds accounted for 21.6 per cent of total public external debt, the rest being mainly concessional loans from multilateral traditional development partners and non-traditional bilateral partners, and they accounted for 46.3 per cent of the debt serviced in that fiscal year, (ibid 2015).
As for UNDP (2008), The Government of Rwanda was determined her partnership strategy which assisted on the increasing of 23% of her Gross Domestic Product; This amounted as an addition of $55 per capita, compared with an average that use to have in Sub-Saharan Africa of approximately $25 per capita in 2008; and assistance accounts for more than half of the Government of Rwanda’s annual budgets and aid’ shaped by principles defined in Millennium Development Goals (MDGs), Sustainable Development Goals (SDGs), the Monterrey Consensus, the Rome Declaration on Harmonization and the Paris Declaration on Aid Effectiveness, Ownership, Harmonisation, Alignment, Results and Mutual Accountability.
2.4.2 The contribution of regional and global relations strategy on economic development in Rwanda.
The researcher thinks that the underlying elite bargain is robust and more inclusive than many believe, maintaining it against the natural tendencies that associate with ‘limited access orders’ produces casualties of various kinds, Frederick, et al. (2013) and Khan. (2012), the benefits of regional and global relation economic integration strategy should depend on the level of economic integration and the deeper the integration, the greater the benefits to the participating of the Partner States. BNR (2012), the increase in imports in 2012 was driven by increased imports of capital goods, up 21.6% over 2011, and to lesser extent intermediary goods up 13.5%. Imports of consumer goods are increased by 8.7% over 2011 while imports of energy & lubricants remained constant with just 0.43%, this largely due to a drop in imports of “other fuel products” which feel by 41%.
Table 2: Imports by Type 2011 and 2012 (Cif Us$)
Jan-Dec 2014 Jan-Dec 2015 Variance
Consumer Goods 656,175,427 694,133,226 6%
Capital Goods 642,245,257 652,577,096 2%
Intermediary Goods 719,999,058 682,453,393 -5%
Energy &Lubricants 368,496,152 290,835,056 -21%
Informal Imports 19,358,076 21,950,956 13%
TOTAL 2,406,273,970 2,341,949,727 -3%
Source: BNR Trade Statistics, 2015
The East Africa Community was Rwanda’s primary source of formal merchandise imports with 29% of imports coming from the East Africa Community and Democratic Republic of Congo region. This is closely followed by Asian countries on 28% of imports. The Middle East accounted for 18% of imports while 17% of imports came from European countries.
[image:10.612.52.610.485.720.2]Exports from Rwanda’s traditional merchandise export sectors dropped by 12%, from US$322.7million in 2014 to US$283.5million in 2015 (see table 3). Coffee’s exports increased by 4% in 2015 over the same period in 2014 from US$59.6 million exported in 2014 to US$62 million in 2015. Even though coffee has seen an increase during 2015 the prices dropped by 12% in 2015, the decline has been attributed to a raise in supply of coffee on the world market, especially from Brazil and Colombia, the major growers. Tea exports in 2015 saw increased by 40% in value. Both tea prices and quantity increased with the average price now up 29% per kg and quantity up 9%. As Rwandan tea competes mainly with kenyan teas where both quality and quantities of output were low this year. Furthermore, Rwandan tea is in high demand in the Middle East and with the removal of embargo on iran and reduced conflicts the market demand for tea increased.
Table 3: Merchandise Exports by Grouping 2015 (Us$ Fob)
Jan-Dec 2014 Jan-Dec 2015 Variance
Traditional Exports 322,798,053 283,577,128 -12.2%
Non-trad. Exports 111,612,906 97,306,266 -12.8%
Re-Exports 165,351,979 177,866,412 7.6%
Informal Exports 107,489,548 108,313,174 0.8%
TOTAL 707,252,485 667,062,980 -5.7%
Source: BNR Trade Statistics
US$97.3million in 2015. This was the result of a drop in exports from a number of manufacturing and agro process subsectors including: Beverage, spirits and vinegar, Iron and steel, woods and article of woods and essential oils & reineoids , down 63%, 87% , 30% and 23% respectively.
The sub-sectors from manufacturing and agro-processing sector that performed well in 2015 include: Pyrethrum up 36% over 2014; Textiles and footwear up 20% and 47% respectively; salt and plastering materials up 29% with US$6.9 million worth of exports; Edible vegetables roots and tubers up 115%; at US$6.8 million. Edible fruits and nuts up 60% accounting US$188.7million worth of exports.
Figure 1: Composition of Rwanda's Non-Traditional formal direct Exports 2014 & 2015 (%)
Source: BNR Trade Statistics 2014 & 2015
Horticulture and agricultural products made a growth of 0.5% where it increased by 67% from US$4.9 million in 2014 to US$8.3 in 2015 as a result of an increase in edible vegetables up 115%and edible fruits and nuts up 60%. Since 2014, horticulture exports have performed well following the removal of the imposition of visa charges to business people by the DRC. Horticulture exports are mainly derived from the accumulation of many small traders to the regional market and small volumes are also exported formally to the European market by some firms. Livestock and hides and skins declined by 0.7% of total growth as a result of lack of production processes locally, since they
imports most of the finished producted from Kenya, plus the establishment of the new tannery has taken some of the production of hides and skins for value addition. Even though most of the sectors has seen a decline in total growth, Re-exports has seen a total growth of 1.8% because of export of petroleum products & other re-exports up 38% and 24% respectively.
Figure 2: Sector Contribution to Total Growth in 2015
Source: BNR Trade Statistics, 2015
Rwanda’s main export destination was Asia Oceania accounting for 35% of total trade. This is followed by the EAC and Europe accounting for 22% and 18% respectively, the Middle East comes next with 163of total trade. Exports to the EAC saw an increase from 20% in 2014 to 28% in 2015 (figure3) due to an increase of exports of prepared foodstuffs and vegetable products up 633% and 46% respectively.
Figure 3: Destination of Rwandan Formal Merchandise Exports 2014 & 2015 (%)
Source: RRA Trade Statistics 2014&2015
Annex 3: Exports to the EAC and DRC (US$)
Country Trade type 2011 2012 2013 2014 2015
Burundi Formal 8,027,724 12,568,421 12,459,842 12,062,942 6,404,190
Informal 7,630,568 10,735,289 9,282,614 9,586,021 7,097,933
Sub-Total 12,648,281 23,303,710 21,742,456 21,648,963 13,502,123
DRC Formal 57,104,840 98,949,887
102,427,21
3 60,806,836 70,326,924
Informal 42,871,534 72,633,957 90,380,054 89,537,310 82,179,695
Sub-Total 67,845,267
171,583,84 4
192,807,26 7
150,344,14 5
152,506,62 0
Kenya Formal 64,267,763 89,602,120 74,354,195 68,733,550 94,465,455
Informal - - -
Sub-Total 57,970,004 89,602,120 74,354,195 68,733,550 94,465,455
Tanzania Formal 6,855,824 8,911,469 17,914,068 2,366,671 1,771,029
Informal 84,645 135,677 106,690 63,873 52,868
Sub-Total 1,106,396 9,047,146 18,020,758 2,430,545 1,823,897
Uganda Formal 1,451,275 4,058,939 5,604,584 10,332,279 9,428,099
Informal 3,800,819 9,474,121 10,401,653 11,310,978 18,982,677
Sub-Total 8,699,958 13,533,059 16,006,237 21,643,257 28,410,776
Total
Exports Formal 137,707,426
214,090,83 6
212,759,90 2
154,302,27 9
182,395,69 7
Informal 54,387,566 92,979,044
110,171,01 1
110,498,18 1
108,313,17 4
Total 192,094,992
307,069,88 0
322,930,91 3
264,800,46 0
290,708,87 1
% Growth
(total) 40% 59% 5% -18% 10%
Source: BNR Trade Statistics 2011 to 2015
As for Ombeni, (2010), the measures taken to ease border crossing for East Africans include issuance of inter-state passes which commenced on 2003; a single immigration Departure/Entry card which has been adopted by the partner states; harmonization of the procedures of work permits and the classification process which has been finalized; and the studies on the harmonization of Labour Laws and Employment Policies
with a two-thirds drop in child mortality and near-universal primary school enrolment. A strong focus on homegrown policies and initiatives has contributed to significant improvement in access to services and human development indicators. The poverty rate dropped from 44% in 2011 to 39% in
2014, while inequality measured by the Gini coefficient fell from 0.49 to 0.45.
[image:13.612.88.519.114.251.2]Investor nationality: Policy challenges 2015
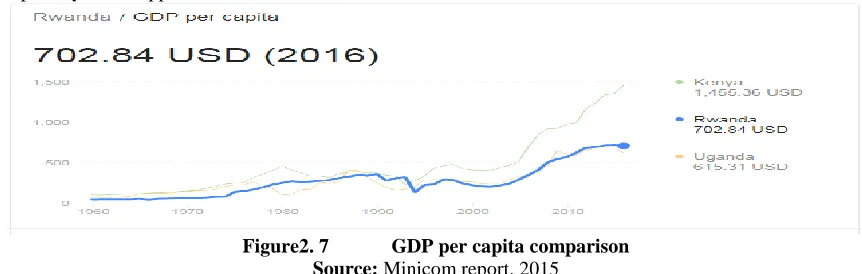
Figure2. 7 GDP per capita comparison Source: Minicom report. 2015 Rwanda’s exports to the world affairs such as United States
of America, German, United Kingdom and other that have been growing steadily over the past 10 years, with an annual average growth rate of 21% and he total trade of Rwanda at the global affairs amounted to $60 million in 2015, with exports to the USA valued at around $46 million, while imports were only $14m down from $21m in 2014, (Minicom. 2015).
2.4.3 The contribution of wealth creation strategy on economic Development in Rwanda
According to The Mifotra (2007), in 2003, the real Gross Domestic Product growth rate was 0.9% compared to 9.4% for 2002 and estimated at 4% for 2004. After exceeding 10% before 2000, the investment rate by providing the wealth creation started declining until it was less than 10% in the same period of before
2000. One of the explanations for this situation is the persistence of negative levels of domestic savings and the reduction of the flow of foreign aid, considering that investment is greatly dependent on foreign aid.
For Minicom (2012), Rwanda’s total merchandise trade was US$2.7 billion, an increase of 14.7% over 2011 (see table 1). Merchandise exports from both formal and informal trade accounted for US$575 million and imports US$ 2.7 billion up 28.1% and 11.4% respectively over 2011. Rwanda ran a merchandise trade deficit of US$1.56 billion in 2012, an increase of 6.5% over 2011. Including preliminary data for tourism, Rwanda’s total exports in 2012 were just under US$ 861 million, an increase of 23% over 2011.
Table 1: Rwandan Trade Performance 2011 and 2012 (Us$)
2011 2012 Variance
Formal Merchandise Exports (FOB US$)
386,912,843 482,066,998 24.59%
Informal Exports 61,868,853 92,979,044 50.28%
Total Merchandise Exports
448,781,695 575,046,041 28.13% Formal Merchandise Imports (CIF US$)
1,890,581,271 2,111,731,894 11.70% Informal Imports
24,355,922
21,486,595 -11.78%
Total Merchandise Imports
1,914,937,192 2,133,218,489 11.40%
Total Merchandise Trade
2,363,718,888 2,711,822,058 14.73%
Merchandise Trade Balance
[image:13.612.71.538.470.724.2]Tourism Receipts
250,700,000 283,600,000 13.12%
Source: RDB Tourism Stats 2012
In 2012, 31% of Rwanda’s formal merchandise trade (imports and exports) was with regional neighbors (EAC and DRC). Trade with Asian countries is also significant, with 27% of Rwanda’s trade taking place with the region. Trade with Europe and the Middle East account for 17% each for both regions.
Minicom, (2015), demonstrated how Rwanda has evolved through a period of economic prosperity and macroeconomic stability in the past two decades; Real Gross Domestic Product grew by an average of 8% annually during the period 2000 to 2013, which is among the highest average growth rates in East
[image:14.612.75.535.270.521.2]Africa. Strong economic growth has resulted in an increase in per capita income from USD225 in 2000 to USD693 in 2013, (AfDB Group, 2014). Inflation rates remain in single digits due to the implementation of robust macroeconomic policies and the easing of global food and fuel prices. Fiscal deficits after grants have also been contained at less than 5%. High import demand particularly for intermediate and capital goods continues to outstrip the narrow but expanding export base leading to trade deficits, (ibid. 2014).
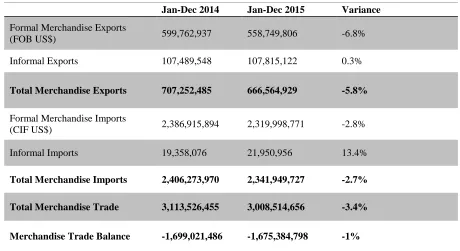
Table 1: Rwandan Merchandise Trade Performance Jan-Dec 2014 and 2015 (US$) Jan-Dec 2014 Jan-Dec 2015 Variance
Formal Merchandise Exports
(FOB US$) 599,762,937 558,749,806 -6.8%
Informal Exports 107,489,548 107,815,122 0.3%
Total Merchandise Exports 707,252,485 666,564,929 -5.8%
Formal Merchandise Imports
(CIF US$) 2,386,915,894 2,319,998,771 -2.8%
Informal Imports 19,358,076 21,950,956 13.4%
Total Merchandise Imports 2,406,273,970 2,341,949,727 -2.7%
Total Merchandise Trade 3,113,526,455 3,008,514,656 -3.4%
Merchandise Trade Balance -1,699,021,486 -1,675,384,798 -1%
Source: Rwanda Revenue Authority trade data, 2015
The slight decrease in imports (down 3%) in 2015 over 2014 was a result of a decrease of energy and lubricants imports, which decreased by 21% over 2014. Imports of consumer and capital goods increased by 6% and 2% respectively as a result of domestic articles and trailer imports. Intermediary goods imports also saw a decrease of 5% as a result of industrial products imports. Informal cross border imports increased by 13% over 2014.
Burundi DRC Tanzania Uganda Total
Informal Exports 7,097,933 82,179,695 52,868 18,982,677 108,313,174
Informal Imports 6,822,558 3,076,534 386,435 11,665,428 21,950,956
Balance 275,375 79,103,162 -333,567 7,317,249 86,362,218
Source: BNR Monthly Informal Trade Statistics 2015
Rwanda’s main informal exports in 2015 is the RDC, were products from bovine cattle live amounted US$ 6.2 million exported primarily to the DRC, followed by Uganda with a value of us$ 1million(see table 5). Other chemical rubber and plastic products comes in second place amounting us$2.2 million with major markets in DRC, followed by Burundi and Uganda. Other Informal exports includes maize flour, Irish potatoes and domestic metal products were RDC have the largest value of informal trade.
As for UNCTAD et al. (2010), demonstrates how the wealth creation has supported a lot on the value of Rwanda’s
[image:15.612.27.483.381.517.2]merchandise exports totalled about $183 million and that of imports $697 million, or 7 per cent and 28 per cent of Gross Domestic Product respectively, recording a merchandise deficit of about $514 million. In relation to global merchandise exports and imports, this represented 0.001 per cent and 0.004 per cent respectively. Services exports in 2007 represented 44 per cent of total exports while services imports represented 28 per cent of total imports, (ibid, 2010).
Table 2. 1: East Africa community comparison table
No EAC countries 2011 2012 2013 2014 Mean in 4 years
01 Rwanda 7.9 8.8 4.7 7.0 28.4/4=7.1
02 Kenya 6.1 4.6 5.7 5.3 21.7/4=5.4
03 Uganda 9.7 4.4 3.3 4.8 22.2/4=5.6
04 Tanzania 7.9 5.1 7.3 7.0 27.3/4=6.8
05 Burundi 4.2 4.0 4.6 4.7 17.5/4=4.4
06 South Sudan -4.6 -46.1 13.1 3.4 -37.7/4=-9.4
Source: East Africa community comparison, 2015
With Klaus. et al. (2011), Investor friendly climate in Rwanda was characterized by official ranking given to Rwanda according to the effort country is using which affect it as 2nd best global reformer 2012; most competitive place to do business in east Africa countries and 3rd in Africa. As the Klaus. et al.
(2011), continue mentioning, Rwanda was ranked as a 2nd most reformed country in the world'; 3rd most competitive place to do business in Africa'; 1st Most competitive place to do business in East African Community region; 8th easiest place to start a business; 6hrs to register business; 19th easiest place to pay taxes worldwide.
BNR, (2015), with strengthening and broadening the participation and involvement of Rwanda Foreign policy, the Gross Fixed Capital Formation in Rwanda decreased to 342 Billion RwF in 2015 from 343 Billion in 2014. This Gross Fixed Capital Formation in Rwanda decrease had had an average of 316.69 Billion RwF from 1999 until 2015, reaching an all-time
high of 804 Billion RwF in 2010 and a record low of 128 Billion RwF in 1999.
2.2 Models on the best practices
2.2.1 Derivation of Conceptual Framework
DEPENDENT VARIABLE INDEPENDENT VARIABLE
Moderating Variable
Figure2. 4 Conceptual Framework
The conceptual framework gives an overview of the types of the research variables that play a role in the research. the independent variables which is Foreign Policy Strategies are also referred to as manipulation variables deal with all theories and practices related to Foreign Policy strategies such as partnership, regional, global relations and wealth creation and a Moderating Variable on foreign policy strategies & Economic Development which affect direct the dependent variables component such as GDP per capita and Balance of trade
2.2.2 Regression Model
This model was used several time by Darren et al. (1982) demonstrated how the Economic Development proceeded from the effects of exporter sector performance and was supported by Solow (1957) who added by saying that using the function of aggregate production as a starting point should increase a lot on the measures of the sources of Economic Development.
These models were modified and specified as follow: Y= β0 +β1X1 + β2X2 + β3X3 + ε
Where:
Y= β0 +β1X1 + β2X2 + β3X3 + ε without the moderator, and
Ү = β0 +β1X1 *Z + β2X2 *Z + β3X3*Z+ε, with the moderator
Where:
Y: Economic Development
: Partnership strategy
Regional, Global strategy
Wealth creation Strategy
Z : Political environment
β0 : coefficient of intercept
β1 – β3 : The corresponding coefficients for the respective independent variables for Foreign Policy Strategies
ε : error term
The above model was helped the Researcher to tests the causal relationship between Gross Domestic Product per capita and Balance of trade as dependent variable independents variables such as:
III. MATERIALS AND METHODS
The ethnicity variable in this study was based on the sample of the population working in Public and Private Institutions with daily activities in foreign policy. The study also had a sample of Single Institutions. The participation in the study was voluntary and anonymous; The research designs of this
study was applied Qualitative research paradigm as a systematic subject approach used to describe the Profitability, Capital adequacy, Asset quality, Liquidity and Risk management through specific approach which was a Case study that described in-depth the experience of one or more than one Public and Private Institutions with method of direct observation and interaction on the subject. In the findings it was established that Partnership strategy, Regional and Global relations strategy and Wealth creation strategy can have a significant contribution on Economic Development in Rwanda. Different Data have been obtained from officials of the Public and Private Institutions from 42 from 30 Cooperatives, 29 from MINICOM, 34 from MINICOFIN, 18 from Internationals NGOs, 26 from Rwanda Local NGOs, 21 from Rwanda Civil Society Platform, 16 from Multinational and Transnational Corporate (investors), and 42 from 30 District Mayors which given 214.
In practice different tools have been used to support gears component with the following activities such as Selection of sample techniques, Develop research instruments questionnaires, Collection of data (the research has been used both primary and secondary data), data was Processed (using SPSS software which assisted on process) and analysis, interpretation and recommendations have been determined by the researcher.
3.1 Research approach
3.1.1 Qualitative versus quantitative research approach
Qualitative versus quantitative research approach of 462 from 30 Rwanda Cooperatives, Ministry of Trade, Industry, Ministry of Finance and Planning, Internationals NGOs, Rwanda Local NGOs, Rwanda Civil Society Platform Multinational and Transnational Corporate (investors) and 30 Districts
3.1.1.2 Proportional stratified sample size:
The proportional stratified sample size means that, the number of sampling units drawn from each stratum is in the proportion to the relative population size of that stratum. A sample size of 82 was used on this study after a simplified formula calculated the said sample sizes according to Yamane (1967) which provided a simplified formula as its bellow.
Table 2.2: Stratum sample size
Stratified random sampling is a method of sampling that involves the division of a population into smaller groups known as strata. In stratified random sampling, the strata are formed based on members' shared attributes or characteristics. A random sample from each stratum is taken in a number proportional to the stratum's size when compared to the population. These subsets of the strata are then pooled to form a random sample.Where n is the sample size, N is the population size, and e is the level of precision 10% for our study
Thus,
Table 2.3 Proportional stratified sample size is determined by the following formula: N Stratum composition Nh(the population size for
stratum h)
nh (sample size of the stratum h)
1 30 Cooperatives 90 42
2 MINICOM 63 29
3 MINICOFIN 74 34
4 Internationals NGOs 40 18
5 Rwanda Local NGOs 55 26
6 Rwanda Civil Society Platform 15 21
7 Multinational and Transnational Corporate (investors)
35 16
8 30 Districts 90 42
Total 462 214
Source: Secondary data, 2016
A sampling frame facilitates formation of a sampling unit that refers to one member of a set of entities being studied, which is the material source of the random variable (Bailey, 2008). Common examples of a unit would be a single person, animal, plant, or manufactured item that belongs to a larger collection of such entities being studied. For the purpose of this study, the sampling frame for the target population should be all 213 selected officials from 30 Cooperatives, MINICOM, MINICOFIN, Internationals NGOs, Rwanda Local NGOs, Rwanda Civil Society Platform, Multinational and Transnational Corporate (investors) and 30 Districts. A Stratified random sampling methodology was employed since 214 Official individuals from different Institution working in the Country was selected using Yamane (1967) formula at the research that will be conducted on the impact of economic analysis on project implementation selected from total of 413 population working in different Public-Private Institutions
3.1.1.2 Data Collection Instruments
The researcher collected primary and secondary data. Primary data was collected using structured questionnaires designed to find answers from respondents and are comprising closed and open questions to seek specific answers on the variables under study. While secondary data was collected through consultation of different documents as registration book, monitoring books, Reports and Experts status books all from Public-Private Institutions
3.1.1.2.1 Data Validity
In order for a questionnaire to be useful, the data it produces must be truthful, a researcher must know that the results are meaningful and can be applied more generally than to just the sample tested. Proving the credibility of the questionnaire and ensuring that the resulting data reflect the “truth”. For validation of data during this research, questionnaire will be consulted by experts and professors who understanding well the topic, their opinions was taken into considerations and collections was made until their satisfactory level before questionnaires are distributed to the site. Use the following
formula, using the total number of experts (N) and the number who rated the object as essential (E): CVT = [(E - (N / 2)) / (N / 2)]
3.1.1.2 Data Reliability
A researcher confirmed the reliability of data collected using a test/retest technics meaning that repeatability of measurement where a person's score on the same test given twice is similar. Conclusion validity was used to confirm if there is connection between the Foreign Policies strategies and Rwandan Economic Development. The inter-rater reliability coefficient is often calculated as a Kappa statistic. The formula for inter-rater reliability Kappa is this:
K=
In this formula, P observed is the observed percentage of agreement.
IV. RESULTS, ARGUMENT, CONCLUSION AND RECOMMENDATIONS
The Facts and critical analysis done after collection of data by scholars on cases well identified with the purpose of provide the clarification on the objectives determined either by the scholars or any one from the private or public and come up with findings to be based on any measurement resolution
4.1 Response Rate
Table 3.4: Response Rate
h Stratum composition Distributed Returned Returned rate
1 30 Cooperatives 42 42 100%
2 MINICOM 29 29 100%
3 MINICOFIN 34 34 100%
4 Internationals NGOs 18 18 100%
5 Rwanda Local NGOs 26 26 90%
6 Rwanda Civil Society Platform 21 23 100%
7 Multinational and Transnational Corporate (investors)
16 6 100%
8 30 District Mayors 42 16 100%
Total 214 213 98.8%
Source: Primary data, 2017
4.1.1 Demographic information
This section presents the demographic characteristics such as gender, level of education, year worked in the Organizations or Institutions size of the organization and years of Institutions and organization’ existence consult
4.1.1.1 Gender of the Respondents
[image:18.612.66.527.462.531.2]A sample of 214 respondents was given a questionnaire on their gender in Rwanda. The 213 respondents who returned the questionnaire, 48.1% were males; while 51.9% was females. This implies that females are majority of our respondents, which force their participation in Rwandan economy and its development.
Figure 4.1: Gender of the Respondents Source: Primary data, 2017
4.1.1.2 Level of Education
Respondents’ qualifications varied greatly. Although most employees had University level qualifications with 39.5%, the study recorded 33.3% respondents with postgraduate level, 14.8% respondents with college level and 12.3% respondents with secondary level.
Figure 4.3 indicates that the majority of respondents had reached university level that could contribute to accurate responses.
Figure 4 2: Level of Education Source: Primary data, 2017
4.1.1.3 Years Worked in the Institution or Organization
The researcher to present experience/duration distribution categories of the respondents used frequency tabulation. Table 4.4 below presents the results:
Figure 4 3: Working experience in Institution
Source: Primary data, 2017
4.1.1.4 Years of working experience
During the research, we were interested in working experience to view if the responses were valid and could
contribute to the research objectives. The following table gives us the picture.
Table4. 5. Working experience in Institution
Frequency Percent Valid Percent Cumulative Percent
Valid Less than 2 87 40.7 40.7 40.7
3 to 5 years 79 37.0 37.0 77.8
Over 5 years 47 22.2 22.2 100.0
Total 213 100.0 100.0
Source: Primary data, 2017
From table 4.2 above, 40% of the respondents have less than 2 years of working experience, 37% have 3 to 5 years, 22.2% have over 5 years. This implies that majority of
respondents are less experienced in their institutions or organization.
Table4. 6 Type of Institution
Frequency Percent Valid Percent Cumulative Percent
Valid public 134 63.0 63.0 63.0
Private 74 34.6 34.6 97.5
NGOs 3 1.2 1.2 98.8
Both public-Private 3 1.2 1.2 100.0
Total 213 100.0 100.0
Source: Primary data, 2017
From table 4.3 above, 63.0% of respondents were from public institution, 34.6% were from private sector, and 1.2% were from NGOs and Both public-Private institutions separately.
Table4. 7 Life of institutions
Frequency Percent Valid Percent Cumulative Percent
Valid 1 to 5 years 50 23.5 23.5 23.5
6 to 10 years 45 21.0 21.0 44.4
11 to 15 years 21 9.9 9.9 54.3
Over 15 years 97 45.7 45.7 100.0
Total 213 100.0 100.0
Source: Primary data, 2017
The results from table 4.4 indicates that 45.7% of respondents approved that their organization or institutions have been in operation over 15 years, 23.5% between 1 to 5 years, 21% between 6 to 10 years and 9.9% between 11 to 15 years.
4.1.2 Institution’ contribution to the Rwanda’s foreign policy
Table 4. 8 Does your Organisation or Institution works with one of these strategies of Rwanda’s Foreign Policy which are Partnership, Regional and global relations and wealth creation?
Frequency Percent Valid Percent Cumulative Percent
Valid No 6 7.4 7.5 7.5
Yes 74 91.4 92.5 100.0
Total 80 98.8 100.0
Missing System 1 1.2
Total 213 100.0
Source: Primary data, 2017
The findings from table 4.5 show that 91.4% of Respondents said that their institutions work closely with the Rwanda’s foreign policy, and only 7.4% said their Institutions are not contribute to the implementation of the foreign policy
while only one respondents did not say nothing. This gives the researcher, a picture that the majority of respondents consider the contribution of their respective institutions in the implementation of the Foreign Policy.
Table4. 9 If yes how the institution contribute on the economic development of Rwanda
Frequency Percent Valid Percent Cumulative Percent
Valid Attracting foreign investors 68 32.1 32.1 32.1
Promote Bilateral and multilateral cooperation
16 7.4 7.4 39.5
Facilitating trade 55 25.9 25.9 65.4
Equipping students with relevant skills 11 4.9 4.9 70.4
Improving export promotion 63 29.6 29.6 100.0
Total 213 100.0 100.0
Source:Primary data, 2017
The results from table 4.6 reveal that 68 from 213 respondents equivalent to 32.1% confirmed that their institution contribute on the economic development of Rwanda through Attracting foreign investors, 63 equivalent to 29.6% through Improving export promotion, 55 respondents equivalent to 25.9% through Facilitating trade, 7.4% through promoting Bilateral and multilateral cooperation, and 4.9% through equipping students with relevant skills.
4.1.3 Perceptions and attitudes towards the contribution of partnership strategy between Rwanda and the rest of the world
This section aim to establish the views of respondents to the contribution of partnership strategy on increasing the economic development of Rwanda. The tables below show the respondents perspectives to the strategy.
4.1.3.1 Contribution of Rwanda foreign strategy to her economy
Respondents were asked whether Rwandan foreign strategy was contributed to her economy.
4.1.3.2 Technical and financial contribution