ISSN 2250-3153
Fabrication and Evaluation of Tractor Drawn Wheat
Row Planter
Gosa Bekele (MSc.)*, Ayalew Bekele (MSc.)**
* Agricultural Machinery and Farm Power Engineering Research Case Team, Oromia Agricultural Research Institute, Asella
Agricultural Engineering Research Center.
E-mail: [email protected]
** Rural Energy Engineering Research Case Team, Oromia Agricultural Research Institute, Asella Agricultural Engineering Research
Center.
E-mail: [email protected]
P.O. Box 06, Asella, Ethiopia
DOI: 10.29322/IJSRP.9.02.2019.p8658 http://dx.doi.org/10.29322/IJSRP.9.02.2019.p8658
Abstract- A tractor drawn wheat row planter was fabricated in
Asella Agricultural Engineering Research Center workshop and evaluated at Munesa woreda of Oromia region at farmer’s field level. The project was undertaken due to the fact that most of the imported planters usually have maintenance problems in addition to high costs of procurement that are not affordable to an average farmer. Calibration of planter for wheat seeds and granular fertilizer (DAP) was carried out. The average seed rate under laboratory testing of evaluated row planter for wheat (Shorima variety) and fertilizer (DAP) were found to be 116.18 and 99.58 kg/ha respectively. The performances of row planter were evaluated in terms of seed rate, depth of planting, plant population, plant distribution uniformity, field capacity and field efficiency. The mean speed of operation, field capacity and field efficiency were found to be 2.31 km/hr, 0.36 ha/hr and 85.71% respectively. Based on the performance evaluation results, fabricated row planter can be efficiently and effectively used by the farmers.
Keywords: - Fertilizer hoper, furrow opener, metering unit, seed
hoper, seed rate.
1. INTRODUCTION
Wheat is one of the major food crops and the second important
cereal crops with annual production of about 4.54 million tons
cultivated on an area of 1.696 million hectares in Ethiopia (CSA,
2013). Based on CSA (2013) data, wheat occupied about 15.63%
of the total cereal area with an average national yield of 2.67 t/
ha. This is low compared to the world average of 4 t/ha (FAO,
2009).
Under intensive cropping, timeliness of operations is one of the
most important factors which can only be achieved if appropriate
use of agricultural machines is advocated (Salokhe and Oida,
2003). With the present day advanced agronomic practices, seed
genetics and on- farm technology to deliver optimal yield while
using fewer resources, row planting is significant factor.
One of the major constraints is availability of row planting
machines to meet timeliness and precision needs. The most
important factors to increase production are the seed germination
distribution uniformity at proper depth. These results in a better
crop stand there by increasing the crop yield (Behera et al., 1995). In order to increase the productivity, efforts have been
made through row sowing systems.
In wheat belt zones of Ethiopia, manual row planting is
ISSN 2250-3153
this practice shows yield increment compared to broad casting
there is hard ship. Manual method of seed planting, results in
low seed placement, spacing efficiencies and serious back ache
for the farmer which limits the size of field that can be planted.
Dominantly Arsi, West Arsi and Bale zone areas are known with
mechanized farming system. Some farmers have tractors for
tillage operation but there is small or no tractor driven row
planting machine due to high importing cost. Therefore, to fill
this gap we have planned to fabricate and evaluate the tractor
mounted row planting machine with less cost than imported one
by having the following objective:-
• To fabricate evaluate the performance of tractor
mounted wheat row planter.
2. MATERIALS AND METHODS
Fabrication of tractor mounted row planter was done at Asella
Agricultural Engineering Research Center workshop. Field
evaluation was carried out at model farmer’s field of Munessa
woreda.
2.1. Material Selection
Selections of proper materials used for manufacturing of various
components of row planter were done based on components of
imported row planter and locally available materials. The
economic consideration and availability of materials were also
taken into account.
2.2. Description of the Machine
The fabricated tractor mounted row planter could have
components like main frame, metering flute, hopper, ground
wheel, delivery tube and furrow opener as shown in
figure 1.
Figure 1. Fabricated tractor mounted row planter
2.2.1. Frame
It was constructed from 8 mm mild steel square pipe welded
together to form a rectangular chassis. The top of the frame
carries the seed and fertilizer hopper while the front provides
hitching points for attachment to the tractor.
2.2.2. Hopper
Trapezoidal shape of seed and fertilizer hoper was fabricated
from 2 mm mild steel sheet metal. The seeds and fertilizer flow
freely by gravitational force into flute metering mechanism at the
bottom of the hopper from its own compartment.
2.2.3. Seed and fertilizer metering mechanisms
Metering mechanism comprises metering flutes used to meter the
seed and fertilizer at predetermined controlled seed and fertilizer
rate. The seed and fertilizer rate uniformity achieved by
parameters such as exposed length of metering flute, size of slot,
shape of slot, number of slot and physical properties of the seeds.
2.2.4. Seed and fertilizer delivery tube
The seed and fertilizer delivery tubes was made from pressurized
water pipe and linked to the flute house from which the seeds
and fertilizer drop into the furrow.
2.2.5. Furrow openers
The furrow opener penetrates into the soil to create furrows for
the fertilizer and wheat seeds placement.
2.2.6. Metering ground wheel
The ground wheel is an integral part of the seed metering
components. A lugged ground wheel was provided to drive seed
and fertilizer metering flute. The wheel is located at middle of
the frame. It is made from 3 mm mild steel plate of 370 mm
diameter and fitted with twelve triangular shaped lugs on the
periphery in order to improve traction both on dry and muddy
lands for the positive rotation under the stubble field conditions.
2.3.Physical Properties of Seed
The performance of seed metering mechanism in terms of
ISSN 2250-3153
property of seeds. Therefore, some of physical properties of
seeds such as thousand grains mass and bulk density of the seed
are relevant to determine plant population uniformity. The wheat
varieties of Hidase, Shorima and Ogolicho seeds were selected
for the study to determine the thousand grain mass.
2.3.1. Thousand grain mass
The thousand grain mass (1000) were selected randomly and
then weighed on the digital electronic weighting balance to
obtain the thousand grain mass in gram from each samples.
2.3.2. Bulk density of wheat seed
The bulk density was determined by taking wheat in a graduated
cylinder. The weight of the grain in the cylinder weighed by
electronic digital balance and divided by volume of cylinder
(Varnmakasti et al., 2007).
)
(
)
(
)
/
(
3 3m
V
kg
W
m
KG
BD
=
(1)
Where, BD = Bulk density in kg/m3, W = Weight of sample in
kg and V = Volume of sample in m3
2.3.3. Calibration of metering flute exposed length
Metering mechanism is the most crucial component to regulate
seed rate and uniformity of the row planting machines. As per
the various research reports on seed metering mechanisms for
row planting machine, fluted type is the most efficient one for
seed rate and uniformity (Ozturk I.et al., 2012). Predetermined
seed rate was maintained by reducing and increasing the exposed
length of flute to seeds and fertilizer coming from the hopper.
Calibration of the machine was conducted at station for metering
the desired quantity of wheat seeds and fertilizer.
2.4. Field Performance Evaluation of the Machine
Field performance parameters measured includes time, speed,
field capacity, field efficiency, planting depth, plant population,
seed germination and distribution uniformity.
2.4.1. Speed of operation
To determine the tractor operation speed during planting
operation, the time required for covering 122 m row length was
recorded with digital stop watch. Five measurements were
recorded in each plot and mean values were computed as km/hr
calculated.
6
.
3
)
(
)
(
tan
)
/
(
x
s
Time
m
ce
Dis
h
km
Speed
=
(2)
2.4.2. Theoretical field capacity
Theoretical field capacity of row planter is the rate of field
coverage that would be obtained if the planter performing its
function 100 % of the time at the rated forward speed and cover
100 % of its rated width. It is expressed as hectare per hour and
determined as follows (Kepner et al., 1978)
(
)
10
/
hr
W
x
S
ha
TFC
=
(3)
Where, TFC = Theoretical Field capacity, (ha/hr); W = Effective
width of implement, (m); and S = Speed of operation, (km/hr).
2.4.3. Effective field capacity
Effective field capacity of the planter was actual rate of work
covered by the planter based upon the total field time and a
function of rated width of the machine actually utilized and
expressed as hectare per hour (Kepner et al., 1978).
(
)
T
A
hr
ha
EFC
/
=
(4)
Where, EFC = Effective Field capacity, (ha/hr); A = Actual area
covered, ha and T = Time required to cover the area, hr
2.4.4. Field efficiency
Field efficiency is the ratio of effective field capacity to
theoretical field capacity. It was determined by the following
formula:-
( )
%
x
100
TFC
EFC
FE
=
(5)
Where, FE = Field efficiency (%); EFC = Effective field
capacity, (ha/hr); and TFC=Theoretical field capacity, (ha/hr).
ISSN 2250-3153
The fuel consumption was measured by refill method. The fuel
tank of the tractor was filled at its full capacity and run at
constant speed. After completion of the test plot, the fuel was
refilled in the tank up to its full capacity. The quantity of refilled
fuel computed to fuel consumption in litter per hour and litter per
hectare.
2.5. Sowing Parameters
2.5.1. Seed rate
The seed rate was determined by taking the weight of seeds
before and after sowing operation. Then subtracted the final
weight of seed from initial weight of seed so that the seed rate
was obtained and the results were expressed in terms of kg ha-1.
This was established considering the weight of seeds planted per
hectare.
(
)
plot
the
of
area
mass
ha
Kg
rate
Seed
/
=
(6)
2.5.2. Depth of sowing
The depth of the planter was determined by measuring with
plastic scale, how deep the furrow openers could dig into the
soil. The average depth of seed placement of the planter was
determined by randomly measuring the depth of five sampled
furrow.
2.5.3. Crop parameters
2.5.3.1. Average plant population
The average plant population was determined by counting the
number of plants persquare meter at six random places and the
mean value was determined to represent the average plant
population.
2.5.3.2. Seed germination and Distribution uniformity
Seed germination distribution uniformityindicates the variation
of plants per 2 m row length among selected rows. The
coefficient of variation (CV) is a mathematical term used to
describe distribution uniformity.
sample
Average
x
sample
stdev
CV
=
(
)
100
(7)
Where: - CV- is Coefficient of Variation, Stdev - is standard
deviation of sample data and Average sample- is arithmetic
average of the sample data taken.
The interpretation of coefficient of variation is as characterized
by Canadian company working on machinery research has
accepted the following scale as its basis for rating distribution
uniformity of seeding implements for wheat crop: CV greater
than 15% unacceptable, CV between 10 and 15% acceptable, CV
less than 10% very good and CV less than 5% excellent (Prairie
Agricultural Machinery Institute (PAMI) Annual report, 2008 –
2009).
2.5.3.3. Potential yield
Potential yield was determined by using quadrant from 1 m2
area. Samples were randomly taken from each plot and the seeds
thoroughly separated from straw and weight of seeds were
recorded and converted to kg ha-1.
2.6. Experimental Design and Data Analysis
The randomized complete design (RCD) was adopted in
experimental field with two treatments and six replications. Data
were analyzed usingGenStat 16th edition statistical software by
least significant difference (LSD) at 5% level of significance.
3. Results and Discussion
The performances of both imported and fabricated tractor drawn
row planter were evaluated for wheat at Munessa wereda of
Oromia Region during the year 2016-2017.
3.1. Physical Properties of Seeds
The attempt was made to study the physical properties of wheat
seeds varieties selected by farmers among number of varieties
were Shorima, Ogolicho and Hidase.
3.1.1. Thousand grain mass and Bulk density of the
seed
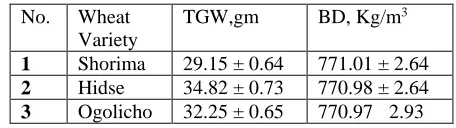
The thousand grain mass (TGM) and bulk density (BD) of
different wheat variety was found as ranges from 29.15 to 34.82
ISSN 2250-3153
thousand grain weight of wheat was observed as 32.41g. The
average value of bulk density for wheat was 770.99 kg/m3 which
is a similar result was observed with (Navneet,2016 and
Solomon A (2017)) with average value of bulk density for wheat
[image:5.612.52.280.156.220.2]determined as 768 kg/m3 and 770.5 kg/m3 respectively.
Table: 1. Average of Bulk density and Thousand Grain Mass
No. Wheat Variety
TGW,gm BD, Kg/m3
1 Shorima 29.15 ± 0.64 771.01 ± 2.64
2 Hidse 34.82 ± 0.73 770.98 ± 2.64
3 Ogolicho 32.25 ± 0.65 770.97 2.93
3.2. Seed Metering Flute Calibration
The seed metering flute was calibrated for the desired seed rate
by adjustment of the exposed length of flutes. The seed rate was
increased with increasing exposed flute length.
Table 2 shows the calibration result of wheat seed at different
metering exposed length of flute from 8 to 24 mm for the front
five furrow openers. Agronomists recommend seed rate of 100 –
150 kg/ha for row planted wheat based on crop management
intensity. Therefore, 16 mm exposed flute length gave nearest
values of seed rate in the range of 113.68 – 118.62 kg/ha and
average value of 116.18 kg/ha was obtained which lies in the
recommended range.
Table 2: Calibration of seed rate (kg/ha) at different exposed flute length Expos ed length of flute( mm)
Seed rate kg/ha F1 F2 F3 F4 F5 Mea
n S D
%C V
8 93.6 92.8 8 90.2 4 92.7 0 93.6 4 92.6 4 1.3 9 1.5
12 108. 65
112 111. 28 110. 56 107. 62 110. 02 1.8 3 1.6 6 16 118.
62 117. 49 116. 51 114. 62 113. 68 116. 18 2.0 3 1.7 5 20 131.
28 129. 61 134. 61 132. 76 130. 29 131. 71 2.0 1 1.5 3 24 142.
83 143. 68 140. 25 139. 97 144. 71 142. 29 2.1 0 1.4 8
3.3. Mechanical Damage to Seed by Metering
Mechanism
The Mechanical damage test was carried out for visual
observations of mechanical damage due to metering mechanism
were recorded for all rows during laboratory test. From table 3
damaged seeds were less than 1% which is within acceptable
limit. Similar results were reported by Senger et al., (2011).
Table: 3. Mechanical damage to wheat seeds by planter No. Total weight of
Sample (gm) Weight of broken seeds (gm) Damaged seeds ( %)
1 500 0.051 0.0102
2 500 0,062 0.0124
3 500 0.061 0.0122
4 500 0.045 0.009
5 500 0.051 0.0102
6 500 0.049 0.0098
Average 500 0.053 0.0106
Seeds collected in 15 metering wheel revolution of Shorima wheat variety.
3.4. Calibration of Metering Flute for Fertilizer
The optimum fertilizer application rate (99.58 kg/ha) was found
with 12 mm exposed flute length. Table 4 indicates the observed
fertilizer application rate among the front five rows (Furrow
openers). It was observed that the entire samples collected for
same exposed flute length were nearly same and there was little
deviation among the rows i.e. (0.29 - 1.21). The CV was about in
the range of (0.27 - 1.03). 12 mm exposed flute length is best
suited for the recommended DAP fertilizer (100 kg/ha)
application rate.
Table 4: Calibration of fertilizer application rate (kg/ha) for
different furrow openers
Exp. flute leng th (mm )
Fertilizer application rate (kg/ha) F1 F2 F3 F4 F5 Mea
n
SD %C
V
8 81.0 5 82
80.9 7 79.6 7 80.7 3 80.8 8 0.8 3 1.0 3 10 91.0
8 90.7 5 89.8 1 90.5 7 91.0 3 90.6 5 0.5 1 0.5 6 12 100.
07 98.9 2 100. 19 99.7 4 98.9 9 99.5 8 0.6 0 0.6 0 14 109.
14 108. 51 109. 01 109. 05 108. 59 108. 86 0.2 9 0.2 7 16 116.
[image:5.612.39.581.495.730.2]ISSN 2250-3153
3.5. Machine and Operational Parameters
The field evaluation parameters which include total time
required for operation, speed of operation, effective field
capacity, theoretical field capacity, field efficiency, time loss for
turning and adjustments and fuel consumption were measured to
assess the performance of seed drills.
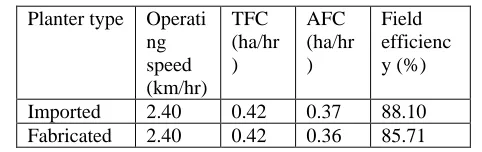
3.5.1. Field capacity and field efficiency
Field performance evaluations were carried out to obtain actual
data on overall performance of the two tractor mounted row
planters. The field capacity and field efficiency was calculated
for planters using standard procedure described earlier and
results are presented in Table 5. The theoretical field capacity
was determined as 0.42 ha/hr for both row planters, whereas the
actual field capacity of the two planter was found 0.37 and 0.36
ha/hr respectively for imported and adapted row planter. From
the actual and theoretical field capacity the field efficiency of the
row planter was found 88.10 and 85.71%.
Table 5: Field capacity and efficiency of the two tractor drawn
row planters
Planter type Operati ng speed (km/hr)
TFC (ha/hr )
AFC (ha/hr )
Field efficienc y (%)
Imported 2.40 0.42 0.37 88.10 Fabricated 2.40 0.42 0.36 85.71
3.5.2. Fuel consumption
The fuel consumption measurement obtained result shown that
when the operating speed increased the fuel consumption rate
also increased. During operation, fuel consumption was observed
as 1.42 and 1.49 l/hr at the speed of 2.40 km/hr, respectively for
imported and fabricated row planter.
3.6. Sowing Parameters of Row Planters
The sowing parameters include seed rate and depth of sowing
were measured and noted to assess the performance of seed
drills. Agronomists, recommended seed rate and average depth
of wheat seed sowing was 100-150 kg ha-1 and 5-7cm
[image:6.612.309.580.123.196.2]respectively based on crop management passion.
Table 6: Sowing parameters of seed drills for wheat seeds
No. Types of row planter
Seed rate obtained, kg ha-1
Average depth of sowing, cm
1 Imported row
planter 118.45 5.8
2 Fabricated row
planter 126.72 5.73
3.6.1. Depth of seed placement
The depth of seed placement in the field was observed that 5.8
and 5.73 cm respectively for imported and fabricated row
planter. The depth of placement of seeds was adjusted by raising
or lowering the furrow opener.
3.6.2. Seed rate
The lowest seed rate obtained in the field was observed as
118.45 kg ha-1with an average seed placing of 5.8 cm for
imported row planter whereas highest seed rate obtained was
found to be 126.72 kg ha-1 with an average seed placing of 5.73
cm for fabricated row planter. The seed rates obtained in the
field were within the range of recommended seed rate of wheat.
3.7.Crop parameters
The crop parameters included average plant population per m2,
seed germination distribution uniformity and potential yield were
measured andnoted to assess the performance of the row planter.
3.7.1. Plant population
The numbers of plants per m2 at five random places were
counted and the mean value was determined to represent the
average plant population. The analysis of variance (ANOVA)
revealed that the planter type had no significant effect (p > 0.05)
on plant population. Table 7 shows the effect of planter type on
mean plant population.
Table 7. Effect of row planter type on plant population (PP)
Paramet er
Source of variation
Measure of differences Repl
icati
Row planter type
[image:6.612.46.287.431.507.2]ISSN 2250-3153
on row planter
row planter
(5%) M) v
Plant populati on
1 162.0c 168.3b
15.9 1
5.16 5.4 2 159.3c 167.3b
3 156.3cd 173.7a
Means followed by the same letter (or letters) do not have significant difference at 5% level of probability.
3.7.2. Distribution uniformity
Distribution uniformity indicates the variation in plant
distribution uniformity between rows. The analysis of variance
(ANOVA) revealed that the planter type had no significant effect
(p > 0.05) on plant distribution uniformity. Table 8 shows the
effect of planter type on mean plant distribution uniformity.
Coefficient of variation (5.3%) of the two row planter shows
that, the variation in plant distribution uniformity within
acceptable limit. According to PAMI, it is in the range of very good ranks.
Table 8. Effect of row planter type on plant distribution uniformity (DU)
Paramet er
Source of variation Measure of differences Repli
catio n
Row planter type Imported row planter
Fabricate d row planter
LSD (5%)
SE( M)
%c v
Plant populati on distribut ion uniform ity
1 32.33c 34.00b
3.110 1.00 9
5.3 2 32.00c 33.33b
3 31.67c 35.67a
Means followed by the same letter (or letters) do not have significant difference at 5% level of probability.
Figure 2. Plant population count and visit
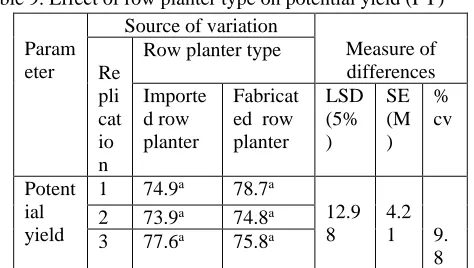
3.7.3. Potential yield
Potential yield was determined from 1 m2 area. Five random
observations were taken from each plot and the seeds were
thoroughly separated from straw and weight of seeds were
recorded and expressed in kg ha-1. The analysis of variance
(ANOVA) revealed that the planter type had no significant effect
(p > 0.05) on potential yield. Table 9 show the effect of planter
[image:7.612.324.561.113.247.2]type on mean potential yield.
Table 9. Effect of row planter type on potential yield (PY)
Param eter
Source of variation
Measure of differences Re
pli cat io n
Row planter type
Importe d row planter
Fabricat ed row planter
LSD (5% )
SE (M )
% cv
Potent ial yield
1 74.9a 78.7a
12.9 8
4.2 1 9.
8 2 73.9a 74.8a
3 77.6a 75.8a
Means followed by the same letter (or letters) do not have significant difference at 5% level of probability.
3.8. Conclusion
It was imagined that mechanizing the row planting operation
could displace labour force and which could be used in other
productive activities that could lead to increased productivity and
can solve labourer scarcity to a large extent. The fabricated nine
row tractor mounted wheat row planter worked satisfactory in
actual field condition. Mass production and distribution for the
farmers has to be facilitated in order for import substitution and
foreign currency reduction.
REFERENCE
1. Behera, B. K; Swain,S; Sahoo, P. K. and Behera, D. (1995).“Evaluation of seeding device for dry Land paddy” A.M.A. 26(4):17-21
2. CSA (Central Statistical Agency) (2013): Report on area and production of major crops, private peasant holdings, meher season, Addis Ababa.
3. FAO (Food and Agriculture Organization of the United Nations) (2009): How to feed the world in 2050.(www.fao.org/fileadmin/templates/wsfs/docs/expe rtpaper/ How to feed the World.
4. Kepener, R. A., Roy B. and Barger, E. L., 1987. Principals of Farm Machinery 8th ed. CBS Publishers
and Distributors, New Delhi, India.
ISSN 2250-3153
Jan 2012 Available from: DOI: 10.5897/SRE11.1445 [Accessed 14th July 2017].
6. Navneet K. Dh., 2016. Development of light weight five row animal drawn multi crop planter (Un puplished thesis).
7. Prairie Agricultural Machinery Institute Annual report, 2008 – 2009
8. Salokhe, V. M. and Oida, A., 2003. Development of Appropriate Agricultural Machinery for South-east Asian Countries. Laboratory of Agricultural Systems Engineering. South east- Asia.
9. Solomon, A., 2017. Performance Evaluation of Walking Tractor Drawn Wheat Planter. Ethiopia. Acad. Res. J. Agri. Sci. Res. Vol. 5(7), pp. 529-538.
10. Varnmakhasti, M. G., G. V Mehdi, M. Hossein, J. Ali, R. Shahin, H. Mohsen and K. Kamran. 2007. Some
engineering properties of Paddy (var. Sazandagi). International J. of Agriculture and Biology, 9(5): 763-766.
AUTHORS
First Author – Gosa Bekele, BSc. in Agricultural Engineering and Mechanization and MSc. in Agricultural Machinery Engineering, email [email protected]
Second Author – Ayalew Bekele, BSc. in Mechanical Engineering and MSc. in Sustainable Energy Engineering, email [email protected]
Correspondence Author – Gosa Bekele, email