Effects of Regular Exercise Programme on the Health
Related Physical Fitness of Obese and Non-Obese Female
Undergraduate Students
Abdul Mohammed, PhD
Department of Human Kinetics and Health Education, Faculty of Education and Arts, Ibrahim Badamasi babangida University, Lapai, Niger State, Nigeria.
DOI: 10.29322/IJSRP.9.05.2019.p8972 http://dx.doi.org/10.29322/IJSRP.9.05.2019.p8972
Abstract- The purpose of this study was to investigate the effects of regular exercise programme on the health related physical fitness of obese and non-obese undergraduate students. To achieve this, purposive sampling technique was used to select a total of sixty four (64) subjects who were further divided into experimental and control groups through the simple random sampling technique from Ahmadu Bello University, Zaria, Nigeria. The experimental groups of obese and non-obese went through interval training programme for twelve (12) weeks. Both the experimental and control groups of obese and non-obese went through pretest and post-test in the 12 minutes cooper distance run test. Results of the experimental groups after 12 weeks of training reveal a Vo2 max (Obese; 23.9< 29.3 and non-obese; 24.6< 35.1), standing broad jump (Obese; 101.6< 134.0 and non-obese; 109< 153.1), modified sit ups (Obese; 36.0< 53.8 and non-obese; 40.8< 59.1), and flexibility rating of the subjects (Obese; 11.36< 19.1 and non-obese; 13.4< 19.2). The effects of the training on the weight of the subjects (Obese; 88.4> 80.9 and Non-obese; 61.> 59.1) and percent body fat were (Obese; 34.8> 31.7 and Non-obese: 26.2>25.4). The analysis of variance two (ANOVA 2) was used to determine the differences and interaction effects among the obese experimental and control groups. The study showed generally significant differences in weight, percent body fat, Vo2Max, muscular strength, local muscular endurance and flexibility of the obese and non-obese female adults but the effects were more among the obese group. It is recommended that regular exercise programme of 30-45 minutes, 3-4 days per week at 60-70% of an individual Vo2Max are most effective in improving and maintenance of health and physical fitness of female adults and should therefore be encourage among Nigerian women.
I. INTRODUCTION
xercise scientist and Health/fitness professionals have for years maintained that regular participation in physical activity is the best defense against many hypo kinetic diseases, metabolic diseases and disorders (Haruna, 2000). The importance of regular physical activity in preventing these diseases and maintaining a high quality life has recently received recognition in Nigeria. Number of previous studies have clearly supported how regular physical activity enhances health and reduces the risk of coronary artery diseases (CAD), hypertension and stroke and as well as
diabetes, osteoporoses, obesity and other metabolic chronic disorders. Regularly Exercise is the least expensive medicine commonly recommended in the treatment of obesity as a means of increasing energy expenditure (Haruna, 1994).
Heyward, (1998) suggested that physical activities which are continuous in nature and have moderate or high energy expenditure such as running, walking, cycling, swimming etc. are recommended. Haruna (1994) stated that there are several benefits that can be obtained by obese individuals with regular exercise training, stressed that in addition to the possible body composition change, it may increase aerobic capacity, increases high density lipoprotein cholesterol, decreases blood pressure, increase insulin sensitivity, reduce psychological stress and ones sense of well being. If regular exercise is long enough per session, intense enough and done at least three to four times per week, it causes effective weight loss and greatly enhances dietary restriction (Haruna, 1994).
Regular exercise at appropriate level is currently the most significant factor contributing to physical fitness, health and productivity of an individual. There is evidence to show that moderate amount of regular exercise is needed for the maintenance of functions integrity of the cardiovascular system, muscles, bone and ligaments (Haruna, 1993). There is also evidence that regularly performed exercise will protect against coronary artery disease, diabetes and obesity (Chado, 1992; Haruna, 1994).
their roots in childhood and adolescence, the amount of adipose tissue is currently of interest since body fat distribution, adipose tissue, metabolism abnormalities in lipid and carbohydrate metabolism are associated in adults (Haruna, 2001). Fat distribution refers to location of fat and not to the absolute or relative amount of fat. Adults with a more central distribution of fat (e.g relatively more on the abdomen than the extremities) are apparently more at risk of cardiovascular diseases and non-insulin dependent diabetes (Preh, 2002).
Exercise fatness has a negative effect generally on performance, especially on those tasks that require be moving or projecting. Hence, there is the need to consider health related physical fitness and physical performance among female adults. This study therefore was carried out to investigate among others the effects of regular exercise programme on obese and non-obese female adults selected from among the undergraduate students in Ahmadu Bello University, Zaria, Nigeria.
II. METHODOLOGY
SAMPLE:
The subjects of this study were drawn from the various Faculties in Ahmadu Bello University, Zaria based on interest and willingness to participates in the programme. The purposive sampling technique was used in this study because only subjects who satisfied the predetermined criteria of been females and undergraduate students were selected. The Body Max Index (BMI) was used to classify the obese and non-obese individuals in accordance with Heyward (1998) classification using the formula, weight in kilograms divided by the square of height: wt(Kg). BMI of 23% to 30% Normal (Non-Obese) BMI >32% = Obese (Obese)
A total of sixty four (64) female undergraduate subjects from Ahmadu Bello University in Nigeria were selected for the study, thirty two (32) Obese and thirty two non-obese. The simple random sampling technique was used to classify subjects into experimental and control groups through folded pieces of papers in which “EXP”, meaning (Experimental) and “CON” meaning (Control) were picked by the subjects. At the end of the exercise, sixteen obese were in the experimental group while sixteen were in control group. Similarly, sixteen non-obese subjects were in the experimental group while sixteen non-obese were in the control group.
ASSESSMENT OF SUBJECTS
For the purpose of this research, the following assessments were conducted for the determination of the health related physical fitness of the obese and non-obese female undergraduate subjects.
WEIGHT AND HEIGHT
Heyward (1998) procedures were followed to measure the weight and height of the subjects. The height was recorded in metres (m) and the weight in kilograms (Kg). the subjects were dressed in minimum amount of clothing, such as sportswear without shoes. The measurements of height and weight were done using the “Shemong Model Weighing Scale Machine” (2000).
PERCENT BODY FAT
The Percent Body Fat measurement was determined using the Skin folds method (Lange) date. The Skin folds measurements were taken on the right side of the body mainly triceps and sub-scapular and recorded in millimeter (mm), then, converted to body density and late transformed into percent body fat.
The body density was calculated using the equation reported by Heyward (1998). This equation was fond to predict body density for black female adults using the following formula.
Body Density = 1.0970 – 0.00046971 (triceps skin fold) + 0.00000056 (sub-scapular skin fold) – 0.00012828. The body density values were then converted to percentage body fat through the Siri formula (Heyward, 1998).
% Body Fat = (4.85 – 4.39 Body Density
Vo2 MAX
The Vo2 max was estimated using the “Field test”, (12
minutes cooper distance run test) as reported by Heyword (1998). A standard track (400 metres) was used for the test with placed markers that divided the course into quarter or eight of a kilometer so that the exact distance covered in 12 minutes were easily determined (Heyward, 1998). The subjects were instructed to run as fast as possible in 12 minutes. They ran until a whistle was blown at the end of 12 minutes. The distance covered by each subject was calculated and recorded in metres.
The Vo2 max was calculated using cooper equation reported by
Heyward (1998).
Vo2 max = (Distance in metres – 504.9)
44.73
MUSCULAR STREGTH
The explosive power of the lower limb was measured using the “Standing broad jump” as recommended and described by Heyward (1998) for explosive power of the lower limb in jumping forward. The subjects were encouraged to jump as far as possible to a long distance. The subject stands with feet parallel to each other and behind the starting line, the subject bends the knee and swings the arm and jump forward as far as possible.
Only three (3) trials were allowed in which the amount of force generated in one best maximum effort was recorded. The distance to the nearest centimeter at the end of the jump was measured.
LOCAL MUSCULAR ENDURANCE
The local muscular endurance was determined using “Modified sit-up” as described in Heyward (1998). The modified sit-ups was chosen considering the female physiological disadvantage from the hip which is comparatively heavier than that of the male.
To assume the starting position, the subject lies on her back with the knees flexed, feet to the floor, with the heels between 12 and 18 inches from the buttocks. The arms are crossed on the chest with the hands on the opposite shoulders. The feet are held by partners to keep in touch with the testing surface. The sit-ups are completed when the subject returns to the down position until the mid-back makes contact with the testing surface.
sit-ups was allowed and the subject was aware of this before initiating the test. However, the objective was to perform as many correctly executed sit-ups as possible in 60 seconds.
FLEXIBILITY
The flexibility of the subjects was determined using the vertical toe sit and reach test of lumber flexibility. The test was reported to be both valid (Dikki, 1992) and reliable (Dikki, 1994).
a) The subjects sat flat on the mat with the legs stretched straight, toes pointing up.
b) The hands with fingers stretched wide apart, go over the toes with the head and body erect.
c) Ruler, calibrated in centimeters (cm) was placed under the finger to measure part of the fingers that extended over the toes. What was obtained was recorded. d) The score was measured to the nearest centimeter.
STATISTICAL TECHNIQUE
The descriptive statistics of mean and standard deviation were computed for the purpose of interpretation.
Analysis of variance two (ANOVA 2) was the statistics used to see the differences and interaction effects between the obese experimental and control group, non-obese experimental and control group.
Scheffe’s post-hoc analysis was used to locate the point of significant difference.
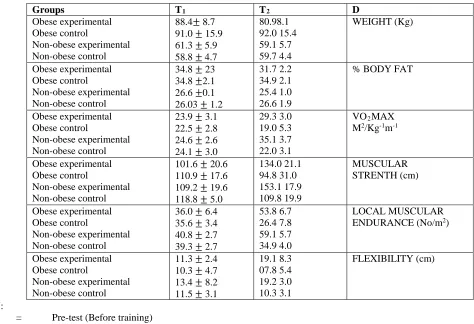
III. RESULT Table 1.1
Mean and standard deviation of results of the obese experimental and control and non-obese experimental and control in weight and health related fitness tests.
Groups T1 T2 D
Obese experimental Obese control
Non-obese experimental Non-obese control
88.4± 8.7 91.0 ± 15.9 61.3 ± 5.9 58.8 ± 4.7
80.98.1 92.0 15.4 59.1 5.7 59.7 4.4
WEIGHT (Kg)
Obese experimental Obese control
Non-obese experimental Non-obese control
34.8 ± 23 34.8 ±2.1 26.6 ±0.1 26.03 ± 1.2
31.7 2.2 34.9 2.1 25.4 1.0 26.6 1.9
% BODY FAT
Obese experimental Obese control
Non-obese experimental Non-obese control
23.9 ± 3.1 22.5 ± 2.8 24.6 ± 2.6 24.1 ± 3.0
29.3 3.0 19.0 5.3 35.1 3.7 22.0 3.1
VO2MAX
M2/Kg-1m-1
Obese experimental Obese control
Non-obese experimental Non-obese control
101.6 ± 20.6 110.9 ± 17.6 109.2 ± 19.6 118.8 ± 5.0
134.0 21.1 94.8 31.0 153.1 17.9 109.8 19.9
MUSCULAR STRENTH (cm)
Obese experimental Obese control
Non-obese experimental Non-obese control
36.0 ± 6.4 35.6 ± 3.4 40.8 ± 2.7 39.3 ± 2.7
53.8 6.7 26.4 7.8 59.1 5.7 34.9 4.0
LOCAL MUSCULAR ENDURANCE (No/m2)
Obese experimental Obese control
Non-obese experimental Non-obese control
11.3 ± 2.4 10.3 ± 4.7 13.4 ± 8.2 11.5 ± 3.1
19.1 8.3 07.8 5.4 19.2 3.0 10.3 3.1
FLEXIBILITY (cm)
KEY:
T1 = Pre-test (Before training)
T2 = Post-test (Test conducted after 12 weeks of training)
D = Amount of Training effects after 12 weeks
Table 1.1 shows improvement with training among the obese and non-obese experimental groups in all the measured variables. The mean weight of obese experimental group before training was 88.4 while the post-training weight was 80.9 compared to obese control group whose pre-training weight mean was 91.0 and post training weight mean was 92.0. Similarly, the non-obese experimental group had a pre-training weight mean of 61.3 and post training weight mean of 59.1 compared to non-obese control group whose pre-training weight mean was 58.8 and
[image:3.612.56.530.273.597.2]result on percent body fat of subjects showed that both the obese and non-obese experimental group lost some fats as a result of the training but the obese group lost more fats than the non-obese group. On VO2 MAX1 the obese experimental pre-test mean was
23.9 while the post-test mean was 29.3 compared to obese control group whose pre-test mean was 22.5 and post-test mean of 24.6 and post-test mean of 24.6 and post-test mean of 35.1 compared to non-obese control group whose pre-test mean was 24.1 and post test mean 22.8. On muscular strength, the obese experimental pre-test mean was 101.6 while the post-pre-test mean was 134.0 compared to obese control group whose pre-test mean was 110.9 and post-test mean 94.8. Similarly, the non-obese experimental group had a pre-test mean of 109.2 and post-test mean of 153.1 compared to non-obese control group whose pre-test mean was 118.8 and post-test mean 109.8. On local muscular endurance, the obese experimental group had a pre-test mean of 36.0 and post-test mean
of 53.8 compared to obese control group whose pre-test mean was 35.6 and post-test mean 26.4. Similarly the non-obese experimental group had a pre-test mean of 40.8 and post-test mean 59.1 compared to the non-obese control group whose pre-test mean was 39.3 and post-test mean of 11.3 and post-test mean of 19.1 compared to obese control group whose pre-test mean was 10.3 and post-test mean 7.8. Similarly, the non-obese experimental group had a pre-test mean of 13.4 and post-test mean of 19.2 compared to the non-obese control group whose pre-test mean was 11.5 and post-test mean 10.3. Generally, the experimental groups of both obese and non-obese performed better in Vo2 max test,
muscular strength test, muscular endurance test and flexibility test. However, the non-obese experimental group performed better than the obese experimental group in the above variables.
Table: 1.2
Summary of anova two for differences between groups in body weight percent body fat, Vo2 Max, muscular
strength, local muscular endurance and flexibility.
Variable Source Df Ss Ms f-ratio
1 BODY WEIGHT BTW-GRPS W-GRPS TOTAL 11 180 191 38055.5 16050.8 54106.4 3459.6 89.2 38.8 INTERACTION
BODY WEIGHT GROUPS TRAINING TRAINING&GRPS 4 2 6 37800 67.6 187.5 12600.1 33.8 31.3 141.33** 0.4 0.4 R2 = 0.70 **Significant
BTW-GRPS W-GRPS TOTAL 11 180 191 3014.1 487.5 3501.6 274.0 2.7 101.2 INTERACTION 2 PERCENT
BODY FAT
GROUPS TRAINING
TRAINING & GRPS
4 2 6 2968.8 11.5 33.8 989.6 5.7 5.6 365.4** 2.1 2.1 R2 = 0.86 **Significant
3 VO2 MAX BTW – GRPS
W – GRPS TOTAL 11 180 191 3205.3 1798.2 5003.5 291.4 10.0 29.2 INTERACTION GROUPS TRAINING
TRAINING & GRPS
4 2 6 18.39.1 259.7 1106.5 613.0 129.9 184.4 61.4** 13.0 18.5 R2 = 064 **Significant
4. BTW – GRPS
W – GRPS TOTAL 11 180 191 42534.8 71395.4 113930.2 3866.8 396.6 9.8 INTERACTION GROUPS TRAINING
TRAINING & GRPS
4 2 6 13245.4 6582.4 22706.9 4415.1 3291.2 3784.5 11.1** 8.3 9.5 R2 = 0.37 **Significant
5 LOCAL MUSCULAR ENDURANCE
GROUPS TRAINING
TRAINING & GRPS
4 2 6
8944.8 1094.1 51.5
2981.6 547.0 855.6
111.7 21.4 33.5 R2 = 0.77 **Significant
FLEXIBILITY BTW – GRPS W – GRPS TOTAL
11 180 191
2635.9 4845.6 7481.5
239.6 26.0
9.0
INTERACTION
GROUPS TRAINING
TRAINING & GRPS
4 2 6
1808.0 195.3 632.6
602.6 97.66 105.4
22.4** 3.6 4.0 R2 = 0.35 **Significant
Table 1.2 is a summary of ANOVA TWO indicating differences between four groups of obese experimental and control and non-obese experimental and control in body weight, percent body fat, Vo2 max1 muscular strength, local muscular endurance
and flexibility.
Column 1 of the table focused on body weight of the four groups and the 12 weeks training programme the experimental groups went through. It shows that significant difference exists in weight loss between the experimental groups (Obese and non-obese) and the control groups. The experimental group lost some weight while the control groups do not.
Column 2 of the table is a summary of ANOVA 2 indicating differences between the four groups as a result of the 12 weeks regular training programme the experimental groups went through. It shows that significant difference exist in percent body fat loss between the experimental and control groups. The obese and non-obese experimental groups lost some body fats while the control groups did not.
Column 3 of the table is a summary of ANOVA 2 indicating differences between the four groups in Vo2 max as a
result of the 12 weeks regular exercise programme the experimental groups (Obese and non-obese) went through. It shows that significant difference exit in Vo2 max between the
experimental and control groups (Obese and non-obese). The experimental groups of obese and non-obese improved in their Vo2 max as a result of the training.
Column 4 of the table is a summary ANOVA 2 indicating differences between the four groups in muscular strength as a result of the 12 weeks regular exercise programme the experimental groups of both obese and non-obese went through. It reveals that significant difference exist in muscular strength between the experimental and control groups. The experimental groups of obese and non-obese performed better in explosive power of the lower limb as a result of the training.
Column 5 of the table in summary of ANOVA 2 indicating differences between the four groups on local muscular endurance as a result of the 12 weeks regular exercise programme the experimental groups of obese and non-obese went through. It shows that significant difference exists in local muscular endurance between the experimental and control groups. The experimental groups of obese and non-obese performed better than the control groups in modified sit-ups for local muscular endurance as a result of the training.
Column 6 of the table is a summary of ANOVA 2 indicating difference between the four groups on flexibility as a result of the 12 weeks regular exercise programme the
experimental groups of obese and non-obese went through. It reveals that significant difference exist in flexibility between the experimental and control groups of obsess and non-obese. The experimental groups of obese and non-obese performed better than their control groups counterparts in the sit and reach test flexibility.
IV. DISCUSSION
The results of this study showed significant effect of 12 weeks of regular exercise training on the body weight of the female adults. The result showed that the obese lost more weight than the non-obese (4.4563< 0.05) and (3.1375< 0.05) respectively. The finding is in agreement those of studies reported by Vebjateswarky (1987). Chado (1992) and Haruna (1994). They reported that regular exercise will lead to weight loss especially among the obese. This was in agreement also with the findings of Peckham, et al (2002) in Hayward (1998) who stated that effective weight loss after long-term commitment to a regular programme of exercise. The amount of weight lost as a result of regular training waqs more on the part of the obese than the non-obese. On this instance, the obese benefited more from the regular exercise training or the training had more effect on the obese than the non-obese. This result is in line with the findings of Epstein et al, (1994) in Hayward (1998) who reported that weight loss from regular exercise programme averaged about 0.3 pound per week for obese individuals and 0.11 pounds per week for normal weight subjects. This result was also supported by Haruna (1994) who reported that regularly exercise reduces weight and is the least expensive medicine commonly recommended in the treatment of obesity.
Oscai and Millers (1986) in Hayward (1998) who maintained that exercise is associated with the loss of body fat in both obese and non-obese persons although, the loose are usually small.
The result of this research showed significant effects of 12 weeks regular exercise programme on the experimental groups of obese and non-obese female adults. The findings is in line with those of studies reported by Chado (1988). He reported significant improvement in Vo2 max of female as a result of regular exercise
training programme. He further reported that during the initial three weeks of regular training, the oxygen consumption of the girls improved. This shows generally of the training effects to improve maximal oxygen consumption. Similarly, Chado, (1988) reviewed studies Vo2 max adaptation to physical training
programme in general, and reported that regular exercise training programme in general, which is 3-4 days/weeks, 30-45 minutes duration and with workload up to 60% maximal heart rate was enough to cause improvement in cardiovascular and respiratory system.
Significant effects of 12 weeks regular exercise programme was noticed in obese and non-obese experimental groups in the area of muscular strength. The findings are similar with those of studies reported by Sharkey (1997) and Chado, (1988). They reported that training effects on muscular strength are most noticeable in fast twitch fibers. These include increases in contractile (contracting) proteins (actin and myosin) and tougher connective tissue. They further revealed that the increased strength comes from the increased cross-sectional area, which means more contractile protein to exert force.
The local muscular endurance also improved significantly as a result of 12 weeks interval regular exercise programme among the obese and non-obese experimental groups. The findings are in line with those of studies reported by Sharkey (1997), and Chado (1988). They reported a high level of respiratory control and oxidative phosphosylation which increase the electron transport system capacity. These are often associated with rise in more ATP production, consequently improving endurance performance. They further revealed that the transport system improves first and foremost during exercise training. Then, next is the oxidative metabolic capacity of the active skeletal muscle cells due to improved aerobic enzymes. These changes enhance individual maximal oxygen utilization for a long period therefore delay fatigue during exercise.
In the area of flexibility, significant effect was recorded as a result of 12 weeks regular exercise programme by both obese and non-obese experimental groups. This results goes in line with those studies reported by Verducci, (1980), Dikki, (1992, 1994) and Dikki et al, (1994). Similarly, Nemy (1993) reported that increase in range of movement did occur due to the training routine and the manner in which the exercises were performed. Heyward in (1998) maintained that to improve rate of motion at the joint, the muscle group must be overloaded by stretching the muscles beyond their normal resting length – but never beyond the pain free range of motion. Periodically, there is need to increase both the amount of time the stretched position is maintained and the number of repetition of the exercise to ensure the overload required for further improvement.
V. CONCLUSION
Regular exercise has been shown to promote health and physical fitness. Available research data suggest that regular exercise training serves a protective measure against the incidence of degenerative diseases. It similarly reduces variety of risk factors for the incidence of several disorders like coronary heart disease, hypertension, obesity, cancer and depression. The following were highlighted by this study:-
1. Regular exercise programme involving obese and non-obese experimental groups for 12 weeks significantly lowered the weight and percent body fat of the female adults. The same programme also led to significant increase in Vo2 max, muscular strength, local muscular
endurance and the flexibility of the female adults. 2. The training groups differed in their weight and percent
body fat. The obese experimental group lost more weight and percent body fat than their non-obese counterpart. This revealed that, the obese group benefited more or that the regular exercise programme had more effects on the obese groups than the non-obese group.
3. The training groups also differed in their Vo2 max,
muscular strength, local muscular endurance and flexibility. The non-obese experimental groups were better than the obese experimental group in the above variables.
REFERENCES
[1] Buskirk, E.R. (1986) Exercise in the treatment of obesity. Medicine and Science in Sports and Exercise volume 18.
[2] Chado, M.A. (1992) Health Maintenance Through Active Life Style, Unpublished Mimeograph, Ahmadu Bello University, Zaria Nigeria. [3] Cureton, K.J, Sloninger, M.A. Black, D.M., McCormack, N.P. and Rowe,
D.A. (1997). Metabolic determinants of Age-related improvement in one-mile run/walk performance in youth. Medicine and Science in Sports and Exercise.
[4] Dikki, C.E. (1992). Validation of the vertical toe sit and reach test as a measure of lumbar flexibility, Sports Science and Medicine Journal of Nigeria Association of Sports Science and Medicine.
[5] Dikki, C.E. (1994) “Intra-rater variance in the vertical toe test of Lumbar flexibility”. Studies in Education Faculty of Education Journal, Edo State University, Ekoma.
[6] Dikki, C.E. Haruna, F.R. Gunen, A.E. (1994) Inter-rater variance in the vertical Toe Test of Lumbar flexibility. A paper presented at the Department of Physical and Health Education, A.B.U Zaria.
[7] Haruna, F.R. (1994) The Role of Exercise Programme in the treatment of Obesity. The Kinesiology’s Volume 1 No. 1.
[8] Haruna, F.R. (2000) The Role of Exercise in the Treatment of Disease. Being a paper presented at the 2 day National Seminar/Workshop on Physical Therapy on Health-30th – 31st October, A.B.U Zaria.
[9] Haruna, F.R. (2001) Exercise and Musculoskeletal Disorders. Being a paper presented at the National Workshop on Physical Therapy of Internal Medicine, Phase II 29th – 30th August the Assembly Hall, Ahmadu Bello University, Zaria.
[10] Heyward, V.H. (1998) Advanced Fitness Assessment and Exercise participation, 3rd Edition. Champaign II Human Kinetics.
[11] Holloszy, J.O. (1983) Exercise, Health and Ageing, A used for more information. Medicine and Science in Sports and Exercise Vol. 15 No. 1. [12] National Institute of Health Consensus Development Panel (1985) Health
[13] Nemy, I.M. (1993) Teaching effectiveness and Health Related Fitness Among Primary School Pupils in Adamawa State. Unpublished M.Sc. Thesis A.B.U Zaria.
[14] Preh, O.J. (2002) Health related fitness status of obese and non-obese adolescent in Zaria, Unpublished M.Sc. Thesis, A.B.U Zaria.
[15] Public Health Service (1988) The Surgeon General’s Report on Nutrition and Health, DHHS (PHS) Publication No 8850210. Washington DC, US Government Printing Office.
[16] Sharkey, G.J. (1997) Fitness and Health, 4th edition. Human Kinetics. Champaign.
[17] Venkateswarlu, K. (1987) Exercise and Dietary consideration in Obesity and Overweight, facts, fallacies and problem; seminar, Faculty of Education, Ahmadu Bello University, Zaria.
[18] Verducci, F.M. (1980) Measurement Concepts in physical Education. The C.V Mosby Company; et Louis.
AUTHORS
First Author – Abdul Mohammed, PhD, Department of Human Kinetics and Health Education, Faculty of Education and Arts, Ibrahim Badamasi babangida University, Lapai, Niger State, Nigeria., Email. [email protected]