CEEM: A Practical Methodology for Cloud Services Evaluation
Zheng Li
School of Computer Science ANU and NICTA Canberra, Australia [email protected]
Liam O’Brien ICT Innovation and Services
Geoscience Australia Canberra, Australia [email protected]
He Zhang
School of Arch. Comp. and Eng. University of East London
London, UK [email protected]
Abstract—Given an increasing number of Cloud services available in the market, evaluating candidate Cloud services is crucial and beneficial for both service customers (e.g. cost-benefit analysis) and providers (e.g. direction of improvement). When it comes to performing any evaluation, a suitable methodology is inevitably required to direct experimental implementations. Nevertheless, there is still a lack of a sound methodology to guide the evaluation of Cloud services. By borrowing the lessons from evaluation of traditional computing systems, referring to the guidelines for Design of Experiments (DOE), and summarizing the existing experiences of real experimental studies, we proposed a generic Cloud Evaluation Experiment Methodology (CEEM) for Cloud services evalu-ation. Furthermore, we have established a pre-experimental knowledge base and specified corresponding suggestions to make this methodology more practical in the Cloud Computing domain. Through evaluating the Google AppEngine Python runtime as a preliminary validation, we show that Cloud evaluators may achieve more rational and convincing exper-imental results and conclusions following such an evaluation methodology.
Keywords-Cloud Computing; Cloud Services Evaluation; Evaluation Experiences; Evaluation Methodology; Design of Experiments (DOE)
I. INTRODUCTION
Cloud services evaluation is crucial and beneficial for both service customers (e.g. cost-benefit analysis) and providers (e.g. direction of improvement) [18]. As one of the most promising computing paradigms [5], Cloud Computing has been increasingly accepted in industry. More and more commercial Cloud services offered by an increasing number of providers are available in the market [18], [22]. Given the diversity of Cloud services and price models, service selection would require deep understanding of how the different candidates may (or may not) match particular demands [6]. Unfortunately, on the one hand, customers have little knowledge and control over the precise nature of Cloud services even in the “locked down” environment [25]; on the other hand, the given indicators often lack providing comprehensive information about the overall performance of a service regarding specific tasks [14]. Consequently, service evaluation would be one of the prerequisites of employing Cloud Computing.
When it comes to evaluation implementations, a suitable methodology essentially plays a strategic role in directing evaluation activities [27]. However, according to our sys-tematic literature review [19], there is a lack of a sound methodology to guide the practice of Cloud services eval-uation. Although any of the existing studies must have (at least intuitively) followed a particular approach, not many evaluators are strictly concerned with or specified their evaluation methodologies. Different evaluation approaches described in different reports vary, and some of them may even have flawed considerations (cf. Section II).
Therefore, we proposed a generic and practical Cloud Evaluation Experiment Methodology (CEEM) for Cloud services evaluation. Our effort into proposing CEEM mainly involved three aspects. Firstly, we borrowed the existing lessons from evaluating traditional computing systems [11], [13], [21]. Since Cloud Computing is an emerging comput-ing paradigm [5], individual Cloud services can be viewed as concrete computing systems within such a paradigm. Thus, the traditional evaluation lessons would be also useful for evaluating Cloud services. Secondly, we referred to the guidelines for performing Design of Experiments (DOE) [20]. Although DOE is normally applied to agriculture, chemical, and process industries, considering the natural relationship between experiment and evaluation, we believe that the various DOE techniques of experimental design and statistical analysis can also benefit Cloud services evaluation. Thirdly, we summarized others’ and our own experiences of evaluating Cloud services. Based on the existing evaluation experiences, we are able to supply more specific and prac-tical suggestions in particular steps, for example pre-listing experimental factors and metrics [16], [17].
the best of our knowledge, this is the first time DOE has been used in Cloud services evaluation. Third, by putting a series of efforts on gathering evaluation experiences, we finally make this proposed evaluation methodology more practical. The remainder of this paper is organized as follows. Section II summarizes the existing work related to method-ologies for Cloud services evaluation. Section III specifies the evaluation activities involved in CEEM one by one. A real case of evaluating Google AppEngine is replicated and compared with the original study in Section IV to preliminarily validate the proposed CEEM. Conclusions and some future work are discussed in Section V.
II. RELATEDWORK
It has been recognized that Cloud services evaluation belongs to the field of experimental computer science [27], which requires suitable evaluation methodology as a strate-gic role in directing experimental studies [3]. An evaluation methodology instructs complete evaluation implementations that may cover various aspects, for instance workload selec-tion, experimental design, and result analysis [3]. Therefore, a concrete methodology adopted in Cloud services evalua-tion should have distinguished between detailed steps [18], [24], [28]. In particular, the study [27] extended the ASTAR method [26] and specifically suggested a five-step method-ology (Identify benchmark,Identify configuration,Run tests, Analyze, and Recommend) for evaluating Cloud services. A more detailed evaluation methodology was specified in [14], which used the business process modeling notation to describe the general steps of developing, executing, and evaluating a Cloud benchmark suite.
However, according to our systematic literature review [19], most evaluators did not strictly define or specify their evaluation steps, not to mention using a sound methodology to guide Cloud services evaluation. Although the existing evaluation implementations must have followed particular approaches, different approaches described in different eval-uation reports vary, and even with flawed considerations. For example, evaluation methodology has been treated as experimental setup and/or preparation of experimental en-vironment [7]; some authors only focused on metrics [10], while some others only highlighted benchmarks [2] when specifying their evaluation approach; and an inappropriate concern was to separate evaluation metrics and experimental implementation from the corresponding methodology [12]. Furthermore, even in the studies with concrete Cloud ser-vices evaluation methodologies [14], [27], some important steps like the selection of metrics and experimental factors were missed out.
III. CEEM: THEMETHODOLOGY FORCLOUDSERVICES EVALUATION
As mentioned previously, by borrowing the lessons from evaluating traditional computing systems, referring to the
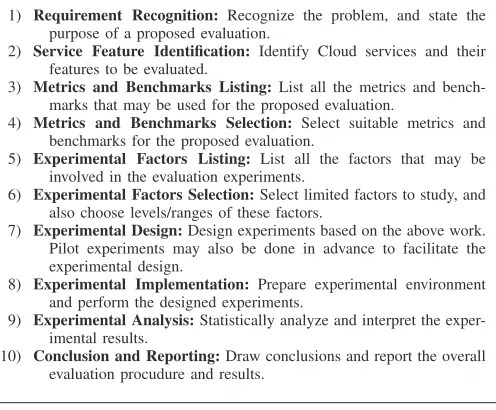
1) Requirement Recognition: Recognize the problem, and state the purpose of a proposed evaluation.
2) Service Feature Identification: Identify Cloud services and their features to be evaluated.
3) Metrics and Benchmarks Listing: List all the metrics and bench-marks that may be used for the proposed evaluation.
4) Metrics and Benchmarks Selection: Select suitable metrics and benchmarks for the proposed evaluation.
5) Experimental Factors Listing: List all the factors that may be involved in the evaluation experiments.
6) Experimental Factors Selection:Select limited factors to study, and also choose levels/ranges of these factors.
7) Experimental Design:Design experiments based on the above work. Pilot experiments may also be done in advance to facilitate the experimental design.
8) Experimental Implementation: Prepare experimental environment and perform the designed experiments.
9) Experimental Analysis:Statistically analyze and interpret the exper-imental results.
[image:2.612.319.567.76.281.2]10) Conclusion and Reporting:Draw conclusions and report the overall evaluation procudure and results.
Figure 1. The Cloud Evaluation Experiment Methodology (CEEM) for Cloud services evaluation.
guidelines for conducting DOE, and summarizing the exist-ing experiences of evaluatexist-ing Cloud services, we proposed a ten-step methodology for Cloud services evaluation, as illustrated in Figure 1. Note that here we only concern ourselves with experiment as the evaluation technique rather than other techniques like simulation or modeling. The indi-vidual evaluation steps are briefly explained in the following subsections.
A. Requirement Recognition
The recognition of an evaluation requirement is not only to understand a problem related to Cloud service evaluation, but also to achieve a clear statement of the evaluation purpose, which is an obvious while nontrivial task [20]. A clearly understood evaluation requirement can facilitate driving the remaining steps properly in an implementation of Cloud services evaluation. To help recognize a requirement, it has been suggested to prepare a set of specific questions to be addressed by potential evaluation experiments [20]. Moreover, it is normally helpful to replace one comprehen-sive question with a list of separated and easily answerable questions, so that we can conveniently define specific evalu-ation objectives, and then employ the strategy of sequential experiments to satisfy the overall evaluation requirement.
B. Service Feature Identification
[19], we show that three service features have been mainly of concern, namely Performance, Economics, and Security. In particular, the elements of the Performance feature can be divided intoPhysical PropertiesandCapacities[15], while the Economics feature covers Cost and Elasticity of using Cloud services. Although the Security feature has not been well evaluated yet [19], it may comprise numerous security concerns ranging from access control to prosecution [4], [8]. Thus, in most cases, we may conveniently identify relevant service features in the general feature list.
C. Metrics and Benchmarks Listing
It is natural that the choice of right metrics depends on the identified Cloud service features to be evaluated [11]. However, one service feature may be measured by different metrics with different benchmarks [17], and the selection of particular metrics and benchmarks may also have other constraints or tradeoffs (cf. Subsection III-D). To facilitate the metric/benchmark selection, it is helpful to first list all the candidate metrics and benchmarks for a proposed Cloud services evaluation. By using different Cloud service features as the retrieval keys, we have established a lookup capability for metrics and benchmarks when evaluating Cloud services [17].
D. Metrics and Benchmarks Selection
According to the rich research in the evaluation of tradi-tional computer systems, the selection of metrics plays an es-sential role in evaluation implementations [21]. Furthermore, a suitable metric would play aResponse Variable role [20] in applying DOE to Cloud services evaluation. Although traditional evaluation lessons treat metrics selection as one of the prerequisites of benchmark selection [11], we found that there were always tradeoffs between metrics and benchmarks selection when evaluating Cloud services. For example, only two metrics (Benchmark Runtime and Benchmark FLOP Rate) are available to respectively measure computation latency and transaction speed if adopting NAS Parallel Benchmarks to evaluate Cloud services [1]. Therefore, we suggest that metrics and benchmarks could be determined together within one step.
E. Experimental Factors Listing
Before evaluating a Cloud service feature, knowing all factors (also called parameters or variables) that affect the service feature is a tedious but necessary task [13]. Although listing a complete scope of experimental factors may not be easily achieved, at all times evaluators should keep the factor list as comprehensive as possible, for further analysis and decision making about the factor selection and data collection [11]. Similar to the effort described in Subsection III-C, we have proposed a framework to capture the state-of-the-practice of experimental factors that people currently take into account when evaluating Cloud services [16]. This
factor framework can in turn help facilitate identifying suit-able factors for designing evaluation experiments. Moreover, the factor framework offers a concrete and rational base for further discussion and factor listing by expert judgements.
F. Experimental Factors Selection
When applying DOE techniques, the determination of fac-tors and their levels/ranges is the prerequisite of factor-based experimental design [20]. For an evaluation experiment, it is better to start with limited design factors distinguished from nuisance ones and those that are not of interest, and the factors that are expected to have high impacts should be preferably selected [11]. As mentioned above, we may refer to the existing evaluation experiences (the proposed factor framework [16]) to quickly lookup and identify design factors. Note that we suggest using the factor framework to supplement, but not replace, the expert judgement for experimental factor selection, which would be particularly helpful for Cloud services evaluation when there is a lack of experts.
G. Experimental Design
Given the selected input-process variables (experimental factors) and output-process responses (metrics), we can de-sign Cloud service evaluation experiments by using suitable DOE techniques. In particular, three basic principles, namely Randomization, Replication, and Blocking [20], should be taken into account no matter what DOE technique is employed. Moreover, a small scale of pilot experiments can often benefit the relevant experimental design. For example, the trial runs of an evaluation experiment may help evaluators get familiar with the experimental environment, optimize the experimental sequence, and even decide the sample size – number of replicates (cf. the demonstration in Section IV).
H. Experimental Implementation
Implementing an experiment is to carry out a series of experimental actions ranging from preparing environment to running benchmarks. Since any error in the experimental procedure may spoil the validity of the experimental results, the implementation process should be monitored carefully to ensure every step of the experiments follows the design [20]. Note that we regard pilot experimental runs as the activities inExperimental Design instead of in this stage.
I. Experimental Analysis
in addition to those statistical techniques, we found that machine learning techniques like mining association rules are also useful for experimental analysis in some circum-stances, for example the evaluation results involving many experimental factors.
J. Conclusion and Reporting
Drawing practical conclusions is significant after analyz-ing the experimental results [20]. In addition, it is worth paying more attention to reporting the whole Cloud ser-vices evaluation work. In fact, not only conclusions but also complete evaluation reports would be vital for other people to learn from or replicate/confirm previous evaluation practices. However, the quality of the existing Cloud services evaluation reports varies [19], which implies that there is also a lack of evaluation reporting guidelines. Therefore, we first suggest using these ten evaluation steps as a natural documentation structure. The validation work described in Section IV can be viewed as a sample of such a case. Considering the close relationship between Cloud services evaluation and experimental computer science [27], more-over, we can adapt the well-proposed structure for reporting generic experiments or case studies [23] to reporting Cloud services evaluation studies. The adaption suggestions are out of the scope of this paper, and they will be elaborated in our future work.
IV. PRELIMINARYVALIDATION
To preliminarily validate CEEM, we decided to replicate a straightforward study of evaluating Google AppEngine service [9], and then compare our practice with the original one. Here we report the detailed evaluation activities.
1) Requirement Recognition:
The overall objective of the original study is to evaluate the computation performance of the Google AppEngine Python runtime. We correspondingly started with three spe-cific questions for the evaluation requirement recognition, as listed below.
• How fast does Google AppEngine run a particular computation task in the Python runtime environment?
• How variable is the computation performance of Google AppEngine during a particular period of time?
• Can we expect a stable mean of the computation performance of Google AppEngine at different time? Given the recognized evaluation requirement, we tried to simulate the original study in the pre-experimental-design steps (Step 2) to 6) in Figure 1), to make two studies comparable as much as possible.
2) Service Feature Identification:
It is clear that the service feature to be evaluated in this case is performance. When it comes to the performance evaluation of Cloud services, our previous taxonomy work [15] can be used to facilitate exploring available performance
Capacity Part Physical
Property Part
Computation Communication
Storage Memory (Cache)
Availability
Latency (Time)
Data Throughput (Bandwidth)
Transaction Speed
Reliability
[image:4.612.317.558.69.273.2]Variability Scalability
Figure 2. Performance properties for Cloud services evaluation (cf. [15]).
properties. Following the original study, we directly identi-fied the combination of the related performance properties asComputation Latencyand alsoVariability of Computation Latency, as shown in Figure 2.
3) Metrics and Benchmarks Listing:
Candidate metrics and benchmarks can be conveniently listed by looking up a metrics catalogue [17], and the retrieval key is the pre-identified service feature. In this case, Computation Latency brings the only metric Benchmark Runtime and a set of benchmarks ranging from Compiling Linux Kernel toNAS Parallel Benchmarks (NPB).
4) Metrics and Benchmarks Selection:
Naturally, we chose the metric Benchmark Runtime to measure the service feature Computation Latency. With regard to the benchmark, we decided to code a Python program to recursively calculate the 27th Fibonacci number. The function of Fibonacci calculation is shown below.
def fibo(n):
if 1==n or 2==n: return 1 else:
return fibo(n-1) + fibo(n-2)
5) Experimental Factors Listing:
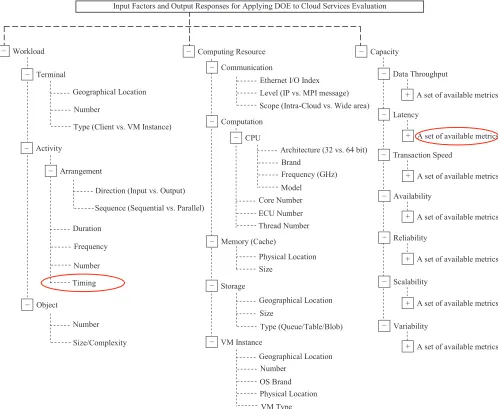
As explained in Subsection III-E, here we directly em-ployed the experimental factor framework [16] to screen experimental factors. In large-scale cases of Cloud services evaluation, expert judgement may further be included to discuss candidate experimental factors.
6) Experimental Factors Selection:
Computing Resource −
Memory (Cache) −
Physical Location
Storage −
Geographical Location
Type (Queue/Table/Blob) VM Instance
−
Geographical Location Number
OS Brand Physical Location VM Type Communication −
Size
Level (IP vs. MPI message) Scope (Intra-Cloud vs. Wide area) Computation
−
Core Number ECU Number Thread Number CPU
−
Architecture (32 vs. 64 bit) Brand
Model Ethernet I/O Index
Frequency (GHz)
Size
Input Factors and Output Responses for Applying DOE to Cloud Services Evaluation
Workload −
Terminal −
Activity −
Duration
Frequency
Number
Object −
Number
Size/Complexity Geographical Location
Number
Type (Client vs. VM Instance)
Arrangement −
Direction (Input vs. Output)
Sequence (Sequential vs. Parallel)
Timing
Capacity −
Data Throughput −
A set of available metrics +
Latency −
A set of available metrics +
Transaction Speed −
A set of available metrics +
Availability −
A set of available metrics +
Reliability −
A set of available metrics +
Scalability −
A set of available metrics +
Variability −
[image:5.612.58.556.73.482.2]A set of available metrics +
Figure 3. Experimental factor framework for applying DOE to Cloud services evaluation (cf. [16]).
comparable with the original one. Note that the metric Benchmark Runtime was also located as the response vari-able in the experimental factor framework [16] for applying DOE.
7) Experimental Design:
Recall that one of the evaluation questions requires ob-serving Google AppEngine runtime for a period of time. There would be far more than two levels of the factorTiming. Therefore, in Step 7) of the evaluation methodology, we naturally employed the technique of single-factor experi-mental design for variance analysis [20]. To simplify the demonstration of the preliminary validation, we decided to choose seven consecutive days as the experimental period. In other words, we treated different dates as different levels of the factor Timing. Thus, the third evaluation question can be viewed as testing the equality of seven computation
performance means, as formally hypothesized in Equation (1), where μi refers to the Fibonacci calculation mean in theith day.
H0:μ1=μ2=· · ·=μ7
H1:μi=μj for at least one pair (i, j)
(i=j and i, j= 1,2,· · ·7).
(1)
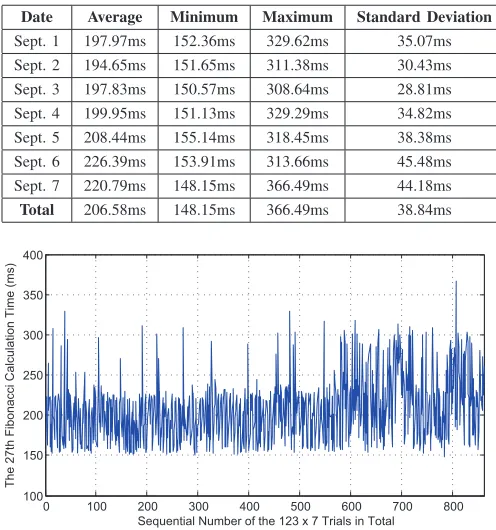
Table I
EXPERIMENTALRESULT OF THE27THFIBONACCICALCULATION WITHINGOOGLEAPPENGINEPYTHONRUNTIME
Date Average Minimum Maximum Standard Deviation
Sept. 1 197.97ms 152.36ms 329.62ms 35.07ms Sept. 2 194.65ms 151.65ms 311.38ms 30.43ms Sept. 3 197.83ms 150.57ms 308.64ms 28.81ms Sept. 4 199.95ms 151.13ms 329.29ms 34.82ms Sept. 5 208.44ms 155.14ms 318.45ms 38.38ms Sept. 6 226.39ms 153.91ms 313.66ms 45.48ms Sept. 7 220.79ms 148.15ms 366.49ms 44.18ms
Total 206.58ms 148.15ms 366.49ms 38.84ms
0 100 200 300 400 500 600 700 800 100
150 200 250 300 350 400
The 27th Fibonacci Calculation Time (ms)
[image:6.612.53.301.105.370.2]Sequential Number of the 123 x 7 Trials in Total
Figure 4. Google AppEngine computation performance during seven days.
123 replicates per day (or replicate once per 720 seconds) to satisfy a target power of at least 0.9.
8) Experimental Implementation:
Given the experimental design, the evaluation experiments were correspondingly deployed and implemented. Several typical indices of the experimental result are shown in Table I, which can be used to initially answer the first two evaluation questions.1 Following the suggestions in Step 9) of the evaluation methodology, we further visualized the experimental result to better answer those questions and also facilitate experimental analysis, as shown in Figure. 4. It can then be intuitively found that Google AppEngine takes200±50msin general to calculate the 27th Fibonacci number. To be more specific, we used Boxplot (cf. Figure. 5) to scale different quartiles of the runtime data. Note that the crosses in Figure. 5 indicate the outlier observations falling out of the 1.5 interquartile range (IQR). It is clearer that the computation performance peak of Google AppEngine is relatively stable (around 150ms for the 27th Fibonacci calculation) everyday, while the worst-case calculation time varies largely without considering the outliers.
9) Experimental Analysis:
However, it is still uncertain whether or not we can expect
1The specific experimental result can be found online:
http://evaluation-experiments.appspot.com
150 200 250 300 350
Sept. 1 Sept. 2 Sept. 3 Sept. 4 Sept. 5 Sept. 6 Sept. 7 Date Reference (Sept. 1 ~ Sept. 7)
The 27th Fibonacci Calculation Time (ms)
Figure 5. Google AppEngine computation performance shown in boxplot.
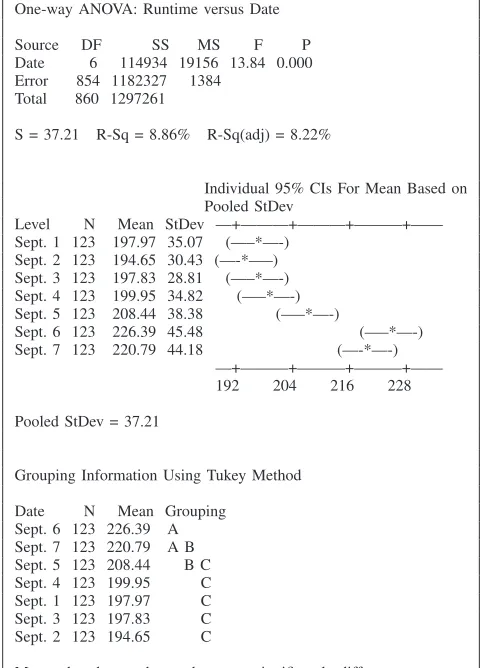
a stable mean of the computation performance of Google AppEngine, although the positive answer is suspicious due to the fluctuation in the last two days’ experimental data. Recall that this evaluation question equals to the hypothesis testing of Equation (1). We employed Tukey’s Test [20] to perform all pair-wise mean comparisons, as shown in Figure 6. It can be seen that the seven days’ Fibonacci calculation means are divided into three groups, which statistically confirms that it is impossible to achieve a stable performance when using Google AppEngine at different period of time. However, interestingly, Group B can be viewed as a linkage between Group A and C. We thus claim that, although not absolutely stable, the performance mean of Google AppEngine may fluctuate mildly.
10) Conclusion and Reporting:
As the last step of evaluation activities, the conclusions are to be drawn to finally satisfy the evaluation requirement. Since the pre-recognized requirement was clarified into three questions in this case, we can conveniently respond the eval-uation requirement by answering those specific questions, as listed below.
• How fast does Google AppEngine run a particular computation task in the Python runtime environment?
− The 27th Fibonacci calculation by using Google AppEngine may take time between 148.15ms and 366.49ms.
• How variable is the computation performance of Google AppEngine during a particular period of time?
− The 27th Fibonacci calculation by using Google Ap-pEngine may take 206.58ms averagely with the stan-dard deviation 38.84ms.
• Can we expect a stable mean of the computation performance of Google AppEngine at different time?
− The performance mean of Google AppEngine may not be absolutely stable, while the fluctuation could be mild.
[image:6.612.53.303.106.369.2]One-way ANOVA: Runtime versus Date
Source DF SS MS F P
Date 6 114934 19156 13.84 0.000 Error 854 1182327 1384
Total 860 1297261
S = 37.21 R-Sq = 8.86% R-Sq(adj) = 8.22%
Individual 95% CIs For Mean Based on Pooled StDev
Level N Mean StDev —+———+———+———+—— Sept. 1 123 197.97 35.07 (—–*—-)
Sept. 2 123 194.65 30.43 (—-*—–) Sept. 3 123 197.83 28.81 (—–*—-) Sept. 4 123 199.95 34.82 (—–*—-) Sept. 5 123 208.44 38.38 (—–*—-)
Sept. 6 123 226.39 45.48 (—–*—-) Sept. 7 123 220.79 44.18 (—-*—-)
—+———+———+———+—— 192 204 216 228
Pooled StDev = 37.21
Grouping Information Using Tukey Method
Date N Mean Grouping Sept. 6 123 226.39 A Sept. 7 123 220.79 A B Sept. 5 123 208.44 B C Sept. 4 123 199.95 C Sept. 1 123 197.97 C Sept. 3 123 197.83 C Sept. 2 123 194.65 C
[image:7.612.55.296.74.408.2]Means that do not share a letter are significantly different.
Figure 6. Grouping information in Tukey’s analysis result (by Minitab).
to the formal reporting guidelines [23], this proposed methodology also supplies a documentation structure for reporting the Cloud services evaluation implementations. Our practice described in this section can then be viewed as a sample of the structured evaluation report.
Overall, compared with the original study [9], the pro-posed methodology led to a systematic and complete ap-proach to evaluation of Google AppEngine. Given spe-cific evaluation questions, rigorous experimental design, and comprehensive data analysis, we can achieve more rational and convincing experimental results and conclusions. In fact, although this is a simplified evaluation study, the demonstration can be regarded as a further pilot experiment for determining sample size of a whole year’s experiment.
V. CONCLUSIONS ANDFUTUREWORK
As Cloud Computing becomes one of the most promising computing paradigms in industry [5], numerous vendors have started to supply public Cloud infrastructures and services [22]. Unfortunately, the Cloud service indicators are usually insufficient for service selection with regard to
spe-cific application scenarios [14], while customers have little knowledge and control over public Cloud services except for those indicators [25]. As such, it would be necessary and significant to implement appropriate evaluation following a suitable methodology before employing particular Cloud services.
Given the lack of a sound methodology for Cloud services evaluation, we investigated the generic steps of evaluation implementations mainly through three types of sources: lessons from evaluating traditional computing sys-tems, guidelines for performing DOE, and the existing Cloud services evaluation studies. Then, a ten-step methodology CEEM was developed and evaluated to guide future Cloud service evaluation experiments. By delivering generic sug-gestions and a pre-experimental knowledge base, we further made CEEM more practical particularly in the Cloud Com-puting domain. Compared to the existing studies of Cloud services evaluation, the validation study shows that CEEM would be able to help evaluators achieve more rational experimental results and draw more convincing conclusions. Moreover, we believe that the evaluation activities involved in CEEM can be conveniently adapted to suit other comput-ing domains by collocatcomput-ing the domain-specific evaluation experiences correspondingly.
Our future work will be unfolded along two directions. On the one hand, CEEM’s knowledge base of evaluating Cloud services will be continually enriched. For example, we are conducting a mapping between specific DOE techniques and detailed evaluation situations, to further facilitate applying DOE to Cloud services evaluation. On the other hand, in addition to employing CEEM in our own evaluation studies, we plan to introduce this work to other Cloud evaluators, and collect their feedback for further validation and improvement.
ACKNOWLEDGMENT
This project is supported by the Commonwealth of Aus-tralia under the AusAus-tralia-China Science and Research Fund. NICTA is funded by the Australian Government as rep-resented by the Department of Broadband, Communications and the Digital Economy and the Australian Research Coun-cil through the ICT Centre of Excellence program.
REFERENCES
[1] S. Akioka and Y. Muraoka, “HPC benchmarks on Amazon EC2,”Proc. 24th Int. IEEE Conf. Advanced Information Net-working and Applications Workshops (WAINA 2010), IEEE Computer Society, Apr. 2010, pp. 1029-1034.
[3] S. M. Blackburn, K. S. McKinley, R. Garner, C. Hoffmann, A. M. Khan, R. Bentzur, A. Diwan, D. Feinberg, D. Frampton, S. Z. Guyer, M. Hirzel, A. Hosking, M. Jump, H. Lee, J. E. B. Moss, A. Phansalkar, D. Stefanovi´c, T. VanDrunen, D. von Dincklage, and B. Wiedermann, “Wake up and smell the coffee: Evaluation methodology for the 21st century,” Commun. ACM, vol. 51, no. 8, Aug. 2008, pp. 83–89. [4] P. A. Boampong and L.A. Wahsheh, “Different facets of
security in the Cloud,”Proc. 15th Communications and Net-working Simulation Symp. (CNS 2012), Society for Computer Simulation International, Mar. 2012, pp. 1–7.
[5] R. Buyya, C. S. Yeo, S. Venugopal, J. Broberg, and I. Brandic, “Cloud Computing and emerging IT platforms: Vision, hype, and reality for delivering computing as the 5th utility,”Future Gener. Comp. Sy., vol. 25, no. 6, Jun. 2009, pp. 599-616.
[6] M. Cunha, N. Mendonc¸a, and A. Sampaio, “Investigating the impact of development configuration and user demand on a social network application in the Amazon EC2 Cloud,” Proc. 3rd Int. Conf. Cloud Computing Technology and Sci-ence (CloudCom 2011), IEEE Computer Society, Nov. 2011, pp. 746–751.
[7] J. Dejun, G. Pierre, and C.-H. Chi, “EC2 Performance Anal-ysis for Resource Provisioning of Service-Oriented Appli-cations,” Proc. 2009 Int. Conf. Service-Oriented Comput-ing (ICSOC/ServiceWave 2009), Springer-Verlag, Nov. 2009, pp. 197–207.
[8] I. Iankoulova and M. Daneva, “Cloud computing security requirements: A systematic review,”Proc. 6th Int. Conf. Re-search Challenges in Information Science (RCIS 2012), IEEE Computer Society, May 2012, pp. 1–7.
[9] A. Iosup, N. Yigitbasi, and D. Epema, “On the performance variability of production Cloud services,” Delft Univ. Tech-nol., Netherlands, Tech. Rep. PDS-2010-002, Jan. 2010. [10] K. R. Jackson, L. Ramakrishnan, K. Muriki, S. Canon,
S. Cholia, J. Shalf, H. J. Wasserman, and N. J. Wright, “Performance analysis of high performance computing ap-plications on the Amazon Web services Cloud,” Proc. 2nd IEEE Int. Conf. Cloud Computing Technology and Science (CloudCom 2010), IEEE Computer Society, Nov.-Dec. 2010, pp. 159-168.
[11] R. K. Jain, The Art of Computer Systems Performance Analysis: Techniques for Experimental Design, Measurement, Simulation, and Modeling. New York, NY: Wiley Computer Publishing, John Wiley & Sons, Inc., May 1991.
[12] D. Kossmann, T. Kraska, and S. Loesing, “An evaluation of alternative architectures for transaction processing in the Cloud,”Proc. 2010 ACM SIGMOD Int. Conf. Management of Data (SIGMOD 2010), ACM Press, Jun. 2010, pp. 579-590.
[13] J.-Y. Le Boudec, Performance Evaluation of Computer and Communication Systems. Lausanne, Switzerland: EFPL Press, Feb. 2011.
[14] A. Lenk, M. Menzel, J. Lipsky, S. Tai, and P. Offer-mann, “What are you paying for? Performance bench-marking for Infrastructure-as-a-Service offerings,”Proc. 4th
Int. Conf. Cloud Computing (IEEE CLOUD 2011), IEEE
Computer Society, Jul. 2011, pp. 484–491.
[15] Z. Li, L. O’Brien, R. Cai, and H. Zhang, “Towards a tax-onomy of performance evaluation of commercial Cloud ser-vices,”Proc. 5th Int. Conf. Cloud Computing (IEEE CLOUD
2012), IEEE Computer Society, Jun. 2012, pp. 344–351. [16] Z. Li, L. O’Brien, H. Zhang, and R. Cai, “A factor
frame-work for experimental design for performance evaluation of commercial Cloud services,”Proc. 4th IEEE Int. Conf. Cloud Computing Technology and Science (CloudCom 2012), IEEE Computer Society, Dec. 2012, pp. 169–176.
[17] Z. Li, L. O’Brien, H. Zhang, and R. Cai, “On a catalogue of metrics for evaluating commercial Cloud services,”Proc. 13th
ACM/IEEE Int. Conf. Grid Computing (Grid 2012), IEEE
Computer Society, Sept. 2012, pp. 164–173.
[18] A. Li, X. Yang, S. Kandula, and M. Zhang, “Cloud-Cmp: Comparing public Cloud providers,” Proc. 10th Annu. Conf. Internet Measurement (IMC 2010), ACM Press, Nov. 2010 pp. 1–14.
[19] Z. Li, H. Zhang, L. O’Brien, R. Cai, and S. Flint, “On evaluating commercial Cloud services: A systematic review,” J. Syst. Software, in press.
[20] D. C. Montgomery,Design and Analysis of Experiments, 7th ed. Hoboken, NJ: John Wiley & Sons, Inc., Jan. 2009. [21] M. S. Obaidat and N. A. Boudriga,Fundamentals of
Per-formance Evaluation of Computer and Telecommjnication Systems. Hoboken, New Jersey: John Wiley & Sons, Inc., Jan. 2010.
[22] R. Prodan and S. Ostermann, “A survey and taxonomy of Infrastructure as a Service and Web hosting Cloud providers,” Proc. 10th IEEE/ACM Int. Conf. Grid Computing (GRID 2009), IEEE Computer Society, Oct. 2009, pp. 17–25. [23] P. Runeson, M. H¨ost, “Guidelines for conducting and
report-ing case study research in software engineerreport-ing,”Empir. Soft-ware Eng., vol. 14, no. 2, Apr. 2009, pp. 131-164.
[24] J. Schad, J. Dittrich, and J.-A. Quian´e-Ruiz, “Runtime mea-surements in the Cloud: Observing, analyzing, and reducing variance,” VLDB Endowment, vol. 3, no. 1-2, Sept. 2010, pp. 460-471.
[25] W. Sobel, S. Subramanyam, A. Sucharitakul, J. Nguyen, H. Wong, A. Klepchukov, S. Patil, A. Fox, and D. Patter-son, “Cloudstone: Multiplatform, multi-language benchmark and measurement tools for Web 2.0,” Proc. 1st Workshop
on Cloud Computing and Its Applications (CCA 2008),
Oct. 2008, pp. 1–6.
[26] V. Stantchev and C. Schr¨opfer, “Techniques for service level enforcement in Web-services based systems,” Proc. 10th Int. Conf. Information Integration and Web-based Applica-tions & Services (iiWAS 2008), ACM Press, Nov. 2008, pp. 7– 14.
[27] V. Stantchev, “Performance evaluation of Cloud computing offerings,”Proc. 3rd Int. Conf. Advanced Engineering Com-puting and Applications in Sciences (ADVCOMP 2009), IEEE Computer Society, Oct. 2009, pp. 187–192.
[28] G. Wang and T. S. E. Ng, “The impact of virtualization on network performance of Amazon EC2 data center,”Proc. 29th Annu. IEEE Int. Conf. Computer Communications (IEEE
INFOCOM 2010), IEEE Computer Society, Mar. 2010, pp.
1-9.
![Figure 2.Performance properties for Cloud services evaluation (cf. [15]).](https://thumb-us.123doks.com/thumbv2/123dok_us/438680.1043415/4.612.317.558.69.273/figure-performance-properties-cloud-services-evaluation-cf.webp)