http://www.scirp.org/journal/cweee ISSN Online: 2168-1570
ISSN Print: 2168-1562
Water Resource Pricing Study Based on
Water Quality Fuzzy Evaluation:
A Case Study of Hefei City
Yuzhen Duan
1, Guijian Liu
1,21School of Public Affairs, University of Science & Technology of China, Hefei, China
2CAS Key Laboratory of Crust-Mantle Materials and the Environments, School of Earth and Space Sciences,
University of Science and Technology of China, Hefei, China
Abstract
Price plays an important role in water resources management. The price of water re-sources can also be considered as a “water resource tax” which reflects the value and opportunity cost of water, and people will pay for the right to use water. Currently, the water resource fees’ effect of regulating resource differential revenues is not ma-nifest and it’s not enough to reflect the principle of paid use of resources as well as regulating resources differential revenues. Due to the ambiguity and complexity of water resources price, this paper uses methods relating to fuzzy mathematics for modeling and processing. The study had a comprehensive consideration of five fac-tors including water quality, water resources per capita, household consumption lev-el, per capita GNP, population or population density to evaluate the water resource price.
Keywords
Water Quality Fuzzy Evaluation, Water Resource Price, Pricing Model
1. Introduction
Water resources feature scarcity and water supply and sewage treatment has scale economies effect, plus the water industry has a natural monopoly, so this industry not only needs government regulation to form and maintain the monopoly, but also needs price regulation and other regulatory means to prevent adverse economic consequences arising from enterprises’ free decisions-making under the monopoly [1]. Currently and during a period of time in the future, the basic objectives of Chinese water price reform How to cite this paper: Duan, Y.Z. and Liu,
G.J. (2016) Water Resource Pricing Study Based on Water Quality Fuzzy Evaluation: A Case Study of Hefei City. Computationa Water, Energy, and Environmental Engi-neering, 5, 99-111.
http://dx.doi.org/10.4236/cweee.2016.54010 Received: March 21, 2016
Accepted: September 4, 2016 Published: September 8, 2016
Copyright © 2016 by authors and Scientific Research Publishing Inc. This work is licensed under the Creative Commons Attribution International License (CC BY 4.0).
http://creativecommons.org/licenses/by/4.0/
is to establish a water pricing mechanism which can fully reflect the water shortage in China as well as take water conservation, rational allocation of water resources, im-provement of water use efficiency, promotion of sustainable use of water resources as the core. And gradually make water price reflect the full cost of water supply to truly fa-cilitate the enterprization of the production and operation units of water services, thus promoting the whole society to save water and use water efficiently [2].
To put it in a simple way, the water price is the market prices embodied by water as a commodity for exchange. Town comprehensive water price often includes basic price (water supply project price), water resource charges, sewage treatment fee and city sur-charge. Basic water price, water resource fee, sewage treatment fee and sewage charges are regarded as different items in accordance with legal basis, goal-oriented reasons, and administrative factors. In theory, China’s water resource fees are collected from people who use water in the form of “fee” and according to state’s ownership of water resources. The levy’s primary purpose is to protect water resources and prevent damage to the water environment [3].
Water resource price, in somehow, is a kind of tax; it expresses the worth and chance cost of water resource; users need to pay for their right to take the water. It includes compensation for water resources consumption and for impact on water ecology (such as water ecological changes duo to water in taking or water diversion), as well as the investment in promoting development of water-saving technology and protection of water resources [4]. With rapid economic and social development, the demand of all sectors within national economy for water is constantly increasing. Serious scarcity of water resource as well as prominent imbalance between demand and supply have emerged. Although water resource supply also adopts the principle of paid use of natu-ral resources, water resource differs from minenatu-ral resources and lands for its characte-ristics like irreplaceability, monopoly, non-competitiveness, renewability and regiona-lized supply. Therefore, currently the water resource fees’ effect of regulating resource differential revenues is not manifest and it’s not enough to reflect the principle of paid use of resources as well as regulating resources differential revenues [5].
uses methods relating to fuzzy mathematics for modeling and processing. The study had a comprehensive consideration of five factors including water quality, water re-sources per capita, household consumption level, per capita GNP, population or popu-lation density to evaluate the water resource price [7].
2. Water Resource Fuzzy Pricing Model
The development and utilization cost of water resources mainly include the investment in a region’s (or watershed) water conservancy and waterworks project as well as opera-tion and maintenance costs (including expenses like exploraopera-tion, planning, monitoring, water intaking, water delivery, water resource protection, water purification, labor sal-ary, etc. as well as costs such as depreciation of capital and interest concerning reser-voirs, water treatment plants, water distribution system, etc.)And opportunities cost refers to the sacrificed maximum net returns which could be achieved by alternative ways of using water resources. It includes return losses caused by unavailability in the future (or offspring) resulting from current use of nonrenewable resources (groundwa-ter), or returns losses in the future (or to offspring) due to current unsustainable use of renewable resources (surface water). External cost refers to damages to other economic subjects as well as environment and ecology as a result of development and utilization of natural resources [8] [9].
Due to the ambiguity and complexity of water resources pricing system, this paper uses methods relating to fuzzy mathematics for modeling and processing [10]. Accord-ing to the actual situation, the determined model parameters include five factors: water quality (reflects quality of local water resources), and per capita water resources volume (reflects local per capita water resources volume), and residents consumption level flects local residents of economic status), and per capita gross domestic product (re-flects economic development level and demands of water), and population or popula-tion density (reflects social factors and the life water requirement), all of which are used to evaluate water resources value [11].
Water resource pricing model can be expressed by a function:
(
1, 2, 3, , n)
V = f X X X X (1)
Among them, V is comprehensive evaluation value of water resource price; 1, 2, 3, , n
X X X X are the factors that influence the price of water. The specific design of the model function is shown below.
Discourse Domain U is defined as the water resource price element,
{
1, 2, 3, , n}
U = X X X X , evaluation vector is W, W = {High, slightly higher, normal,
slightly lower, low }, then comprehensive evaluation of water resource price is ex-pressed by the following equation:
can be expressed as:
1 11 12 13 14 15
2 21 22 23 24 25
3 31 32 33 34 35
1 2 3 4 5
n n n n n n
R R R R R R
R R R R R R
R R R R R R R
R R R R R R
= = (3)
Among them, the Rnj
(
n=1, 2, 3,, ;n j=1, 2, 3, 4, 5)
represents the j level evalua-tion value of element n.In order to determine Rnj, the membership of the factors in element n mush be
de-termined first.
The so-called membership refer to specifying a fuzzy set C (denoted by C) on B for conclusive domain B, appoint that any b∈B has a corresponding membership
(
0 1)
µ ≤ ≤µ , define µ as the membership function of C, denoted by µ=C b
( )
.There is a variety of ways to determine membership function. Up (down) half trape-zoidal distribution is frequently used to establish the function of one variable. For Xn, membership function is determined by the following formula.
( )
1 1
1 1 2
2 1 2 1 0 i i i i i i i x x x x
U x x x x
x x x x ≤ −
= < <
− ≥ (4)
( )
, 1 , 1 , 1 , 1, 1 , 1
0 ,
ij
i j ij i j ij
ij
j ij i j
i j ij
i j i j
x x
x x x
x x
x x
U x x x x
x x
x x x x
− − + + + − − < ≤ − −
= − < <
≥ ≤
(5)
( )
, 1, 1 , 1 1 0 in in
n i n in
i n in
i n
x x
x x
U x x x x
x x x x − − − ≥ −
= < <
−
≤
(6)
11 12 13 1
21 22 23 2
31 32 33 3
1 2 3
m m
mm m
m m m mm
C C C C
C C C C
C C C C C
C C C C
= (7)
Among them, Cij represents the ratio of the ith factor and the jth factor’s
impor-tance,
i j
,
=
1, 2,
,
m
, the mid-value of specialist assignment could be chosen as its value, then multiply the elements in each line of the matrix C, next seek m root of them to get a vector.(
)
T1, 2, 3, , m
β
=β β β
β
(8)(
)
1
1
, 1, 2, ,
m m ij i
C C i m
β
=
=
∏
= (9)Thereafter, the results were normalized to get a vector
(
1, 2, 3, m)
A= a a a a (10)
Results obtained using the above models, V is the comprehensive evaluation value of water resources. It is a dimensionless vector and must be converted to water price through the following formula:
R
P = ⋅V S (11)
R
P represents the requested water resource price, is V is the results of water re-sources comprehensive evaluation, S for water resource price vector.
Water resource price vector S is determined by the following method:
First determine the upper limit P of the water resource price, then the method of arithmetic interval to divide water resources price interval
[ ]
P, 0 into price vectors(
, 1, 2, 3, 0)
S= P P P P .
Water price ceiling is the water resource price at the maximum water resource price withstanding index. It’s calculated by deducting the project water price and environ-mental water price from the bearing capacity water tariff, which is expressed by the fol-lowing formula: 2 1 i i P E i A K
P P P
Q
=
×
=
∑
− − (12)1, 2
i= respectively represent domestic water and industrial water. A1 is disposable income; A2 represents the total output value of industrial enterprises. K1 represents water price’s proportion in disposable income; K2 represents water price’s proportion in total industrial output value. Q represents water consumption. PP, PE respectively represent project water price and environmental water price.
3. Parameters Affecting the Water Resource Price
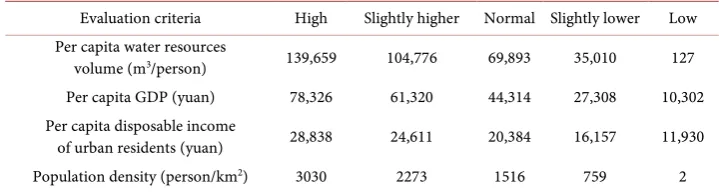
Table 1. Hefei water resource value evaluation criteria.
Evaluation criteria High Slightly higher Normal Slightly lower Low Per capita water resources
volume (m3/person) 139,659 104,776 69,893 35,010 127
Per capita GDP (yuan) 78,326 61,320 44,314 27,308 10,302 Per capita disposable income
of urban residents (yuan) 28,838 24,611 20,384 16,157 11,930 Population density (person/km2) 3030 2273 1516 759 2
Note: The standards of per capita water resources volume, per capita GDP, per capita disposable income of urban residents, population density were rated and classified according to “China Statistical Yearbook” (2014) and statistics of other provinces, autonomous regions.
3.1. Water Quality
The monitoring indicator average value of data in each month can be calculated ac-cording to the lakes and reservoirs water quality monitoring data reported each month in 2014 (Table 2), and then the annual average can be calculated. Finally, a linear membership function with one unknown could be established according to “Surface Water Environment Quality Standards”.
Water quality evaluation index and surface water environment quality standard standards (GB 3838-2002), are shown in Table 3.
Taking ammonia nitrogen factor for example, up (down) semi trapezoid distribution is used to seek its membership with each class of the water quality standards. In the Hefei lake and reservoir water quality monitoring data reported in 2009, the annual av-erage concentration of ammonia nitrogen factor is 0.7773, which ranks between the second and the third class. Its membership with class II is:
2
0.7773 0.5 0.555 1.0 0.5
µ = − =
− (13) Its membership with class III is:
3
0.7773 1.0
0.445 0.5 1.0
µ = − =
− (14) Then the ammonia nitrogen factor’s fuzzy evaluation relationship is:
(
0 0.555 0.445 0 0)
.In the same way, a matrix R composed of each water quality factor’s membership at all levels can be obtained
0 0 0.199 0.801 0
0 0.555 0.445 0 0
0 0 0.375 0.625 0
0 0 0 0.468 0.532
0 0 0 0 1
0 0 0 0.406 0.594
R
=
(15)
The weight of each water quality factor is:
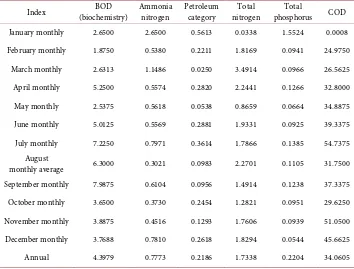
Table 2. Hefei lakes and reservoirs water quality monitoring average data of each month reported in 2014 (unit: mg/L).
Index (biochemistry) BOD Ammonia nitrogen Petroleum category nitrogen Total phosphorus Total COD
January monthly 2.6500 2.6500 0.5613 0.0338 1.5524 0.0008 February monthly 1.8750 0.5380 0.2211 1.8169 0.0941 24.9750
March monthly 2.6313 1.1486 0.0250 3.4914 0.0966 26.5625 April monthly 5.2500 0.5574 0.2820 2.2441 0.1266 32.8000 May monthly 2.5375 0.5618 0.0538 0.8659 0.0664 34.8875 June monthly 5.0125 0.5569 0.2881 1.9331 0.0925 39.3375 July monthly 7.2250 0.7971 0.3614 1.7866 0.1385 54.7375
August
monthly average 6.3000 0.3021 0.0983 2.2701 0.1105 31.7500 September monthly 7.9875 0.6104 0.0956 1.4914 0.1238 37.3375 October monthly 3.6500 0.3730 0.2454 1.2821 0.0951 29.6250 November monthly 3.8875 0.4516 0.1293 1.7606 0.0939 51.0500 December monthly 3.7688 0.7810 0.2618 1.8294 0.0544 45.6625 Annual 4.3979 0.7773 0.2186 1.7338 0.2204 34.0605
Table 3. Surface water environment quality standards (unit: mg/L).
Index (biochemistry) BOD Ammonia nitrogen Petroleum category nitrogen Total phosphorus Total COD
I Class ≤3 ≤0.015 ≤0.05 ≤0.2 ≤0.01 ≤15 II Class 3 0.5 0.05 0.5 0.025 15 III Class 4 1.0 0.05 1.0 0.05 20
IV Class 6 1.5 0.5 1.5 0.1 30
V Class 10 2.0 1.0 2.0 0.2 40
Water quality comprehensive evaluation results and water quality fuzzy evaluation relationship obtained through recombination and normalizing of membership matrix and weighting factors: R1=
(
0 0.122 0.137 0.294 0.447 .)
3.2. Per Capita Water Resource Volume
Hefei’s total water resource volume is 1.761 billion cubic meters and in 2009, the total population of Hefei is 7.696 million, then Hefei’s per capita water resources is 228.8 cu-bic meters/person. In China, the highest per capita water resource volume isTibet— 139,658.9 m3/person and the lowest is Beijing—126.6 m3/person. After being divided
into five equal parts, the membership vector obtained is:
(
)
2 0 0 0 0.993 0.007
[image:7.595.196.553.402.517.2]3.3. GDP per Capital
Hefei’s per capital GDP is 42,981 yuan. The highest as well as the lowest GDP per capita in China are 78,326.13 yuan (Shanghai) and 10,301.95 yuan (Guizhou). After being di-vided into five equal parts, the membership vector obtained is:
(
)
3 0 0 0.078 0.922 0
R = (17)
3.4. Urban Resident per Capita Disposable Income
Hefei’s urban resident per capita disposable income is 17,158 yuan, while the highest as well as the lowest data are respectively 28,837.78 yuan (Shanghai) and 11,929.78 yuan (Gansu). After being divided into five equal parts, the membership vector obtained is:
(
)
4 0 0 0.763 0.237 0
R = (18)
3.5. Population Density 3
Hefei’s population density is 581 people/km2, while the provinces with highest and
lowest population density are respectively Shanghai (3029.97 persons/km2) and Tibet
(2.38 persons/km2), and after being divided into five equal parts, the membership
vec-tor obtained is:
(
)
5 0 0 0 0.235 0.765
R = (19)
Fuzzy evaluation matrix of water resources is
0 0.122 0.137 0.294 0.447 0 0 0 0.993 0.007 0 0 0.078 0.922 0 0 0 0.763 0.237 0 0 0 0 0.235 0.765
R
=
(20)
Population density, GDP, per capita disposable income are socio-economic factors. To simplify the calculation, equal weighting method is used and the weight is defined as 0.1. Water quality and quantity are natural factors of water resources, so the weight of water quality is 0.3, weight of quantity is 0.4, and thereby the obtained water resource value comprehensive evaluation weight vector is:
(
0.3 0.4 0.1 0.1 0.1)
A= (21)
Comprehensive evaluation of water resource is
(
)
(
)
0 0.122 0.137 0.294 0.447 0 0 0 0.993 0.007 0.3 0.4 0.1 0.1 0.1 0 0 0.078 0.922 0
0 0 0.763 0.237 0 0 0 0 0.235 0.765 0 0.0366 0.1252 0.6248 0.2134
V A R
= = ∗
=
(22)
4. Water Resource Price Calculation
total water supply was 246.81 million tons, of which the volume of domestic water was 114.71 million tons, then domestic water supply’s proportion in the total water supply is 0.465, and the industrial water’s proportion is 0.535. At the end of 2007, Hefei’s total population was 478.9 million, so the per capita domestic water was 23.95 cubic meters/ year. In 2008, Hefei’s water consumption per million industrial output value is 276 cu-bic meters/million. The family domestic water fees bearing index is denoted by 0.03, the industrial water cost is maintained within 1.5% of the industrial output, so take indus-trial water bearing index as 0.015.
The upper limit of water resource price is:
(
)
(
)
1 1 2 2
3
10000
17158 10000
0.465 0.03 0.535 0.015 1.49 1.16
23.95 276
9.994 0.291 1.49 1.16
7.64 yuan m
P E E
P A A P P
C Q
ω ω
= ⋅ ⋅ + ⋅ ⋅ − −
= × × + × × − −
= + − −
=
(23)
Water resource price vector is:
(
7.64 5.73 3.82 1.91 0)
S= (24)
Water resource price is:
(
)
(
)
(
)
T
3
0 0.0366 0.1252 0.6248 0.2134
7.64 5.73 3.82 1.91 0
1.88 yuan m R
P = × =V S
× =
(25)
Thus, Hefei’s water resource price should be 1.88 yuan/m3. So what’s the actual levy
status of Hefei’s water resource price? According to the “Anhui water in taking permits and water resource fee collection management and implementation approach” (Anhui Provincial People’s Government Order No. 212) and the provisions in documents of provincial Department of Finance, Price Bureau and Department of Water Resources [CZ (2008) 633], water resource fee is collected and managed in different levels, and its divided according to the following proportions: for water fee levied by county-level government, 10% shall be submitted to central government, 90% is remained by the county government; for water charges levied by municipal government, 10% shall be submitted to central government, 90% is remained by the municipal government.
5. Discussion and Conclusions
As required by “water resources fee collection and usage management approach” (CZ [2008] No. 79) of Ministry of Finance, National Development and Reform Commission, Ministry of Water Resources, water resources fees are specially used in conservation, pro-tection and management of water resources, also in rational development of water resources. The objectives of water fee reform is to reflect scarcity of water, effectively encourage con-servation and protection of water resources, and optimize allocation of water resources.
5.1. Water Fee Collection Standards Cannot Accurately Reflect the
Condition of Water Resources and Environmental
Carrying Capacity
Although Anhui Province has adjusted water fee collection standards for several times, currently the standards still cannot serve as an economic leverage (Table 4). And they’re unable to promote the rational allocation, conservation and protection of water resources. Low water fee standards are like scratching across boots. They cannot achieve effect of the promoting conservation and protection of water resources, opti-mizing the allocation of water resources. Neither can they provide any effective support to strengthen the management of water resources, which makes it difficult to effectively implement water intaking permit system, and also may impair the motivation to collect and manage water resource fee.
5.2. In Water Resources Fee Collection and Use, Government
Intervention Persists
Some local governments interfere with the normal collection of water resources fee from the perspective of local interests. They freely exempt water resource fee of Water Supply Company, “foreign-funded” enterprises and private enterprises. Many areas use exemption as the preferential policy to attract investment. In addition, there are some companies default water resource fee due their poor efficiency.
According to China’s current “Water Law” (2002), “Water Intaking Permits and Water Fee Collection Regulations” and “Water Resources Fee Collection and Usage Management Approach” of Ministry of Finance, National Development and Reform Commission, Ministry of Water Resources, water resources fees are specially used in conservation, protection and management of water resources, also in rational develop-ment of water resources. Its purposes mainly include water resources investigation and assessment, planning, distribution, formulation of related standards, monitoring and implementation of water use permits as well as water resource scheduling. But in prac-tice, usage plan management and direction of water use may depart provisions of water administrative authorities.
5.3. In the Development of Water Resource Fee Standards,
the “One Size Fits All” Problem Is Serious, and the Process
Lacks Dynamic Adjustment Mechanism
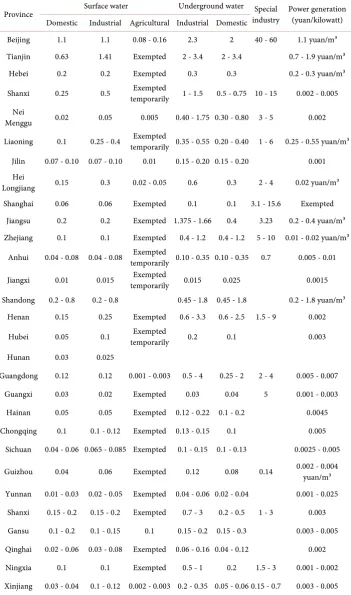
Table 4. 2014 Partial provinces water fee collection standards comparison (unit: yuan/m3).
Province Surface water Underground water Special industry Power generation (yuan/kilowatt) Domestic Industrial Agricultural Industrial Domestic
Beijing 1.1 1.1 0.08 - 0.16 2.3 2 40 - 60 1.1 yuan/m³ Tianjin 0.63 1.41 Exempted 2 - 3.4 2 - 3.4 0.7 - 1.9 yuan/m³
Hebei 0.2 0.2 Exempted 0.3 0.3 0.2 - 0.3 yuan/m³
Shanxi 0.25 0.5 temporarily Exempted 1 - 1.5 0.5 - 0.75 10 - 15 0.002 - 0.005 Nei
Menggu 0.02 0.05 0.005 0.40 - 1.75 0.30 - 0.80 3 - 5 0.002 Liaoning 0.1 0.25 - 0.4 Exempted temporarily 0.35 - 0.55 0.20 - 0.40 1 - 6 0.25 - 0.55 yuan/m³
Jilin 0.07 - 0.10 0.07 - 0.10 0.01 0.15 - 0.20 0.15 - 0.20 0.001 Hei
Longjiang 0.15 0.3 0.02 - 0.05 0.6 0.3 2 - 4 0.02 yuan/m³ Shanghai 0.06 0.06 Exempted 0.1 0.1 3.1 - 15.6 Exempted
Jiangsu 0.2 0.2 Exempted 1.375 - 1.66 0.4 3.23 0.2 - 0.4 yuan/m³ Zhejiang 0.1 0.1 Exempted 0.4 - 1.2 0.4 - 1.2 5 - 10 0.01 - 0.02 yuan/m³
Anhui 0.04 - 0.08 0.04 - 0.08 Exempted temporarily 0.10 - 0.35 0.10 - 0.35 0.7 0.005 - 0.01
Jiangxi 0.01 0.015 temporarily Exempted 0.015 0.025 0.0015
Shandong 0.2 - 0.8 0.2 - 0.8 0.45 - 1.8 0.45 - 1.8 0.2 - 1.8 yuan/m³ Henan 0.15 0.25 Exempted 0.6 - 3.3 0.6 - 2.5 1.5 - 9 0.002
Hubei 0.05 0.1 temporarily Exempted 0.2 0.1 0.003
Hunan 0.03 0.025
Guangdong 0.12 0.12 0.001 - 0.003 0.5 - 4 0.25 - 2 2 - 4 0.005 - 0.007 Guangxi 0.03 0.02 Exempted 0.03 0.04 5 0.001 - 0.003
Hainan 0.05 0.05 Exempted 0.12 - 0.22 0.1 - 0.2 0.0045 Chongqing 0.1 0.1 - 0.12 Exempted 0.13 - 0.15 0.1 0.005
Sichuan 0.04 - 0.06 0.065 - 0.085 Exempted 0.1 - 0.15 0.1 - 0.13 0.0025 - 0.005
Guizhou 0.04 0.06 Exempted 0.12 0.08 0.14 0.002 - 0.004 yuan/m³
Yunnan 0.01 - 0.03 0.02 - 0.05 Exempted 0.04 - 0.06 0.02 - 0.04 0.001 - 0.025 Shanxi 0.15 - 0.2 0.15 - 0.2 Exempted 0.7 - 3 0.2 - 0.5 1 - 3 0.003 Gansu 0.1 - 0.2 0.1 - 0.15 0.1 0.15 - 0.2 0.15 - 0.3 0.003 - 0.005 Qinghai 0.02 - 0.06 0.03 - 0.08 Exempted 0.06 - 0.16 0.04 - 0.12 0.002 Ningxia 0.1 0.1 Exempted 0.5 - 1 0.2 1.5 - 3 0.001 - 0.002 Xinjiang 0.03 - 0.04 0.1 - 0.12 0.002 - 0.003 0.2 - 0.35 0.05 - 0.06 0.15 - 0.7 0.003 - 0.005
affect the value of water. And as a means to reflect the value of water resources, water fee should transfer related information to water users to encourage them to cherish wa-ter resources. However, at present, in the development of wawa-ter resource fee standards, the “One size fits all” problem is prominent in the whole province. Thus the water re-source fee standards cannot reflect the influence of relevant factors. Meanwhile, the process lacks dynamic adjustment mechanism.
Acknowledgments
The authors would like to thank the editors for their valuable comments and sugges-tions, which led to significant improvements in the paper. This work was supported by the Ahhui provincial environmental protection projects named economic development strategy of environmental impact assessment studies of Anhui province. Under grant Nos. 2014-005 and Ahhui provincial environmental protection projects named Area of the city cluster along Anhui-Yangtse River under grant Nos. 2014-006.
References
[1] Hung, M.F. and Chie, B.T. (2013) Residential Water Use: Efficiency, Affordability, and Price Elasticity. Water Resources Management, 27, 275-291.
http://dx.doi.org/10.1007/s11269-012-0185-z
[2] Liu, X.L., Chen, X.K. and Wang, S.Y. (2009) Evaluating and Predicting Shadow Prices of Water Resources in China and Its Nine Major River Basins. Water Resources Management, 23, 1467-1478. http://dx.doi.org/10.1007/s11269-008-9336-7
[3] Ma, X.Z., Zhang, S.Q. and Mu, Q. (2014) How Do Residents Respond to Price under In-creasing Block Tariffs? Evidence from Experiments in Urban Residential Water Demand in Beijing. Water Resources Management, 28, 4895-4909.
http://dx.doi.org/10.1007/s11269-014-0561-y
[4] Wichelns, D. (2013) Enhancing the Performance of Water Prices and Tariff Structures in Achieving Socially Desirable Outcomes. International Journal of Water Resources Devel-opment, 29, 310-326. http://dx.doi.org/10.1080/07900627.2012.721675
[5] Wichman, C.J. (2014) Perceived Price in Residential Water Demand: Evidence from a Nat-ural Experiment. Journal of Economic Behavior & Organization, 107, 308-323.
http://dx.doi.org/10.1016/j.jebo.2014.02.017
[6] Wood, M. and Alsayegh, O.A. (2014) Impact of Oil Prices, Economic Diversification Poli-cies and Energy Conservation Programs on the Electricity and Water Demands in Kuwait. Energy Policy, 66, 144-156. http://dx.doi.org/10.1016/j.enpol.2013.10.061
[7] Yoo, J., Simonit, S., Kinzig, A.P. and Perrings, C. (2014) Estimating the Price Elasticity of Residential Water Demand: The Case of Phoenix, Arizona. Applied Economic Perspectives and Policy, 36, 333-350. http://dx.doi.org/10.1093/aepp/ppt054
[8] Yoskowitz, D.W. (2002) Price Dispersion and Price Discrimination: Empirical Evidence from a Spot Market for Water. Review of Industrial Organization, 20, 283-289.
http://dx.doi.org/10.1023/A:1015099709658
[9] Yusuf, A.A. and Koundouri, P. (2005) Willingness to Pay for Water and Location Bias in Hedonic Price Analysis: Evidence from the Indonesian Housing Market. Environment and Development Economics, 10, 821-836. http://dx.doi.org/10.1017/S1355770X05002548
Im-plementation. Water Resources Management, 24, 377-396.
http://dx.doi.org/10.1007/s11269-009-9451-0
[11] Zilberman, D., Sproul, T., Rajagopal, D., Sexton, S. and Hellegers, P. (2008) Rising Energy Prices and the Economics of Water in Agriculture. Water Policy, 10, 11-21.
http://dx.doi.org/10.2166/wp.2008.049
[12] Ziolkowska, J.R. (2015) Shadow Price of Water for Irrigation—A Case of the High Plains. Agricultural Water Management, 153, 20-31. http://dx.doi.org/10.1016/j.agwat.2015.01.024
[13] Zuo, A., Wheeler, S.A., Boxall, P., Adamowicz, W.L. and MacDonald, D.H. (2015) Identi-fying Water Prices at Which Australian Farmers Will Exit Irrigation: Results of a Stated Preference Survey. Economic Record, 91, 109-123.
http://dx.doi.org/10.1111/1475-4932.12186
Submit or recommend next manuscript to SCIRP and we will provide best service for you:
Accepting pre-submission inquiries through Email, Facebook, LinkedIn, Twitter, etc. A wide selection of journals (inclusive of 9 subjects, more than 200 journals)
Providing 24-hour high-quality service User-friendly online submission system Fair and swift peer-review system
Efficient typesetting and proofreading procedure
Display of the result of downloads and visits, as well as the number of cited articles Maximum dissemination of your research work