Munich Personal RePEc Archive
India’s urban environment: air and water
pollution and pollution abatement
Sridhar, Kala S. and Kumar, Surender
December 2012
Online at
https://mpra.ub.uni-muenchen.de/43810/
1
India’s Urban Environment: Air and Water Pollution and Pollution Abatement
Kala Seetharam Sridhar Public Affairs Centre 15, KIADB Industrial Area Bommasandra-Jigani Link Road
Hennagara Post, Anekal Taluk Bangalore 562 106
INDIA
Surender Kumar
Department of Business Economics University of Delhi, South Campus,
Benito Juarez Road New Delhi 110 021
INDIA
2
Acknowledgements
3
Abstract
This paper focuses on air and water pollution in India’s cities, provides empirical evidence to demonstrate the seriousness of the challenges, discusses the relevant policies of national and local government that are used to address the challenges, discusses relevant political
economy issues related to introducing pollution taxes or other policies which are aimed at “green” cities.
4
Air and Water Pollution in Urban India
Growing urbanization is posing serious environmental concerns in India in terms of changing land use pattern, increasing carbon emissions, solid waste generation and disposal, air and water pollution, and poor sanitation amenities.. In this article, we focus on air and water pollution and pollution abatement policy.
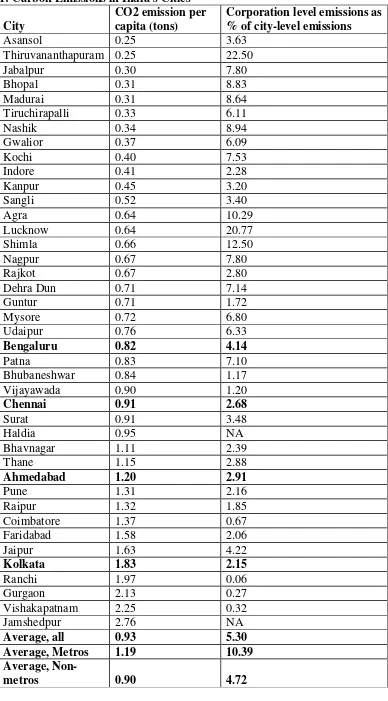
Carbon emissions have been increasing in India in recent years and they are higher in urban areas. We find that the average per capita carbon emissions are higher in the metropolitan cities of India (being 1.19 tons per capita as compared to only 0.90 tons per capita in the non-metropolitan cities), and the national average is 0.93 tons per capita (Table 1). This is because larger cities have more polluting activity such as emissions from public and private transport. However, note that the corporation level emissions as a percentage of city-level emissions are much higher in the non-metropolitan areas than in the metropolitan areas. Corporation level emissions include those emanating from street lighting, water supply and sewage systems, transportation, building and other facilities. This is plausible because smaller city
corporations lack the adequate technology to minimize their carbon emissions in the provision of various public services such as water supply, sewerage, street lighting and transportation.
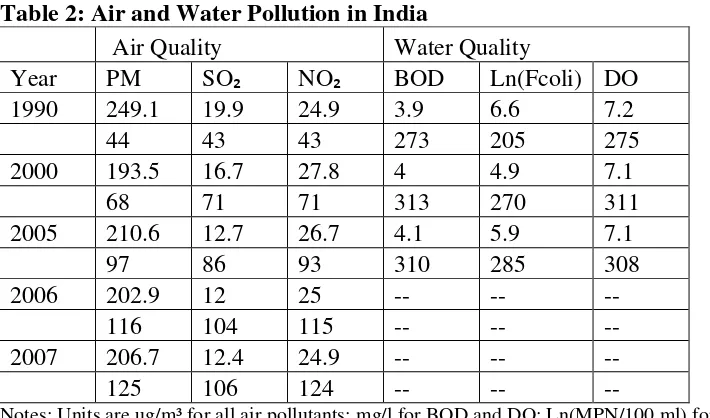
The concerns related to local air pollution are serious. Table 2 reveals the increasing level of average air and water pollution level in India beginning 1990. Of a total of 127 cities/towns monitored under the National Air Quality Monitoring Programme, 101 cities report at least one pollutant exceeding the annual average air quality standard (CPCB 2009).
Household borne effluents contribute a substantial proportion of water pollution in India. A 2007 study finds that discharge of untreated sewage is the single most important cause for pollution of surface and ground water in India. Nearly 12.47 million (18.5%) households do not have access to a drainage network, while 26.83 million (39.8%) households are connected to open drains. In respect of underground sewerage, the availability is 30 percent and 15 percent in notified and non-notified slums respectively.
A majority of the government-owned sewage treatment plants remain closed most of the time due to improper design or poor maintenance or lack of reliable electricity supply to operate the plants, together with absentee employees and poor management. The wastewater
generated in these areas normally percolates in the soil or evaporates. The uncollected wastes accumulate in the urban areas, cause unhygienic conditions and release pollutants that leach to surface and groundwater (CPCB (2008)). Inadequate discharge of untreated
domestic/municipal wastewater has resulted in contamination of 75 percent of all surface water across India.
City corporations, municipalities and panchayats having the responsibility of water supply and sanitation are supposed to treat the effluents as per the national water pollution standards or MINAS standards. However, a major portion of effluents, about 70 percent, goes
5
Municipal authorities need to recognize the problem of pollution of water bodies and pay attention to their liability to set up sewage treatment plants in cities and towns to prevent this pollution. Conditioning the intergovernmental fiscal transfers from state governments to local bodies on the basis of wastewater treated could be an effective instrument for strengthening the financial position of municipalities (Kumar and Managi 2010; Murty and Kumar 2011). It will not only strengthen the financial position of local governments but also helps in
addressing the problem of domestic water pollution.
Pollution Taxation and Green Cities
Indian government's approach towards prevention and control of pollution has been mostly in the nature of legislation-based command and control measures while natural resource
management has been largely carried out through programs supported by allocations from the central (e.g., programs of Ministry of Environment and Forests (MoEF), Ministry of Non-conventional Energy Sources, Ministry of Agriculture) and state budgets. The use of fiscal instruments (other than expenditure policy) in environmental policy has been rather limited, even though the need to employ economic and fiscal policy instruments for the control of pollution and management of natural resources has gained steady recognition during the 1990s (Murty and Kumar, 2004; Kumar and Managi 2009).
For greening cities in India, the Supreme Court has played a catalytic role. The Supreme Court identified critically polluted cities and suggested an action plan to reduce the level of pollution in these cities. In 1996, Delhi was the first city to order to develop an action plan, while the most recent action plans were mandated in 2003. To date, 17 cities have been given orders to develop action plans. In light of the Supreme Court’s reputation as a driver of environmental reform in India, as well as the overwhelming approval of Delhi’s CNG bus program as part of its action plan, many believe that these policies have made significant gains in improving air quality. Second the Court mandated the use of catalytic converters in vehicles. The use of catalytic converters is a common means of reducing vehicular pollution across the world, due to the low cost of its end-of-the-pipe technology. In 1995, the Supreme Court required that all new petrol-fuelled cars in the four major metros (Delhi, Mumbai, Kolkata, Chennai) were to be fitted with converters. In 1998, the policy was extended to 45 other cities. It is plausible that this regulation could reduce the air pollution level in cities.
The combustion of oil products, which mainly occurs in the transport sector, is responsible for about 13 percent of CO2 emissions in the county. Efficiency enhancing measures in the
transport sector are leading to dual benefits of both local air pollution abatement and reduction in GHG emissions. Emission standards have been prescribed for vehicles. The implantation of vehicle emissions standards results in significant costs savings in terms of health benefits (Table 4). India has taken substantial initiatives to make the transport sector less emission intensive (Economic Survey 2012). The commercial manufacture of battery-operated vehicles has begun in India with a view to promoting low/ no carbon emitting vehicles.
6
experimenting with high capacity bus corridors. Several other Indian cities are also planning similar initiatives. Maharashtra has announced to impose congestion tax to discourage the use of private cars where the state government has created sufficient public transport facilities (Government of India, 2008). Srinivasan (2005) reports that in India CO2 emissions from
transportation per passenger kilometer are 16 against the 118 and 193 grams in EU-15 and USA, respectively.
In the Policy Statement for the Abatement of Pollution, released in 1992, the MoEF noted the need for a mix of policy instruments in the form of regulations, legislation, agreements, financial incentives, to address environmental concerns. Task forces were constituted by the MoEF in 1995 and 2001 to evaluate the scope for market based instruments (MBIs) for industrial pollution abatement. The task forces recommended explicit incorporation of MBIs in pollution control laws, greater reliance on economic penalties in the short and medium term, and completely replacing criminal penalties by MBIs in the long run.
In order to encourage the shift of polluting industries from congested urban areas, capital gains made in moving from urban to other areas are exempt from taxes if these are used for acquiring land and building production facilities in non-urban areas. Excise and custom duty exemptions or reductions are given for the use of environmentally friendly raw materials.
The actual use of fiscal incentives in the country has, however, been rather limited. These take the form of tax concessions for the adoption of pollution control equipment and a somewhat more structured policy for the promotion of renewable energy technologies. Tax incentives are usually specified for identified abatement technologies and activities, not providing dynamic incentives for technological innovation and diffusion. Also, since most of these are end-of-the-pipe treatment technologies, these incentives do not promote more efficient use of resources. There are some provisions for the use of levies, cess, fines, and penalties for polluters, though their implementation and effectiveness could do with improvement.
In the last few years, the government of India has expressed the desire to use markets for control of pollution in the country. India has levied a cess on coal at the rate of Rs. 50 (~US$ 1) per ton, which is applicable to both domestically produced and imported coal. This money goes into a National Clean Energy Fundthat is used for funding research, innovative projects in clean energy technologies, and environmental remedial programmes. To control the industrial pollution of NOx and particulate matters, the government is going to start the emission permit
markets as pilot projects in three states namely, Gujarat, Maharashtra and Tamil Nadu.
Similarly, to increase the energy efficiency in the energy intensive industries in a cost effective manner, the Bureau of Energy Efficiency has launched the trading in energy efficiency
7
important framework was formally launched in November 2010, heralding a new era in the development of green energy in India (Economic Survey 2011-12, 2012).
Moreover, the Government of India has recently launched the National Mission on
Sustainable Habitat (NMSH) under the National Action Plan on Climate Change (NAPCC). The NMSH would also help in greening the Indian cities. The mission promotes energy efficiency in residential and commercial sectors by bridging the knowledge gap on designing green infrastructure, by ensuring better implementation of government schemes, and by offering appropriate financial incentives. It also asks for developing a comprehensive
approach to managing water, solid waste and wastewater that takes into account potential for recycling, reuse and energy creation. Moreover, the refurbishing of urban transportation to increase usage and energy efficiency through a combination of promotional, regulatory and fiscal measures, including mandatory fuel efficiency standards to be notified shortly would be a step in greening the Indian cities.
Results also show that the emissions intensity of India’s GDP declined by more than 30% during the period 1994-2007 due to the efforts and policies that India has proactively put in place.
In India, at the sub-national level, several city corporations have taken the lead in reducing carbon emissions. Some cities such as Gorakhpur, Surat, and Indore have taken up pilot projects for adaptation and mitigation of the impact of climate change in their cities. Indore, which has been affected by climate change in the form of rising temperatures and increasing incidence of non-monsoon drought, has identified potential pilot activities such as
underground water storage and a volunteer-based water supply availability tracking system. Various carbon emission-reducing processes are gaining carbon credits in the Ahmedabad Municipal Corporation (AMC). Technologies involved in cutting electricity consumption in street lights, use of LED (light emitting diodes) lighting source, the BRTS mass transit system, green technologies and e-governance are part of this process. AMC has agreements with several companies with a profit-sharing arrangement for carbon credit trade.
Summary and conclusions
India’s carbon emissions are currently are not alarming, given the low share of manufacturing in its GDP, but are likely to increase with the increasing role of manufacturing, urbanization, rising incomes and the use of personal vehicles. The government of India has resorted to a market based approach to containing pollution. In addition, at the sub-national level, cities are also doing their bit to reduce carbon emissions, and increasing green urbanization by making their buildings more energy efficient.
8
References
Central Pollution Control Board, CPCB (2008), Status of Water Supply, Wastewater Generation and Treatment in Class-I Cities and Class-II Towns on India, Control of Urban Pollution Series: CUPS/70/2009-10, New Delhi
Central Pollution Control Board, CPCB (2011), Status of Water Quality in India – 2009, Monitoring of Indian Aquatic Resources Series: MINARS/ /2009-10, New Delhi Greenstone, M. and R. Hanna (2011), Environmental Regulation, Air and Water Pollution,
and Infant Mortality in India, CEEPR Working Paper 2011-014, MIT Centre for Energy and Environmental Policy Research
Kumar, Surender and Shunsuke Managi (2009), Economics of Sustainable Development: The Case of India (New York: Spriger)
Kumar, Surender and Shunsuke Managi (2010) ‘Compensation for environmental services and intergovernmental fiscal transfers: the case of India’, Ecological Economics 68, pp 3052-3059.
Ministry of Finance. 2012. Economic survey 2011-12. New Delhi, India: Ministry of Finance, March
Murty, M. N. and Surender Kumar (2004), Environmental and Economic Accounting for Industry (New Delhi; Oxford University Press).
Sridhar, Kala Seetharam and Om Prakash Mathur. Costs and Challenges of Local Urban Services: Evidence from India’s Cities, New Delhi: Oxford University Press, 2009. Srinivasan, A. (2005), ‘India’ in Asian Perspectives on Climate Regime Beyond 2012:
Concerns, Interests and Priorities, Chapter 3, 19-30, Japan: Institute of Global Environmental Strategies.
World Bank (1999) What a waste: Solid waste management in Asia, Washington, DC. Zhang, Z. (2008), ‘Asian energy and environmental policy: promoting growth while
9
Table 1: Carbon Emissions in India’s Cities
City
CO2 emission per capita (tons)
Corporation level emissions as % of city-level emissions
Asansol 0.25 3.63
Thiruvananthapuram 0.25 22.50
Jabalpur 0.30 7.80
Bhopal 0.31 8.83
Madurai 0.31 8.64
Tiruchirapalli 0.33 6.11
Nashik 0.34 8.94
Gwalior 0.37 6.09
Kochi 0.40 7.53
Indore 0.41 2.28
Kanpur 0.45 3.20
Sangli 0.52 3.40
Agra 0.64 10.29
Lucknow 0.64 20.77
Shimla 0.66 12.50
Nagpur 0.67 7.80
Rajkot 0.67 2.80
Dehra Dun 0.71 7.14
Guntur 0.71 1.72
Mysore 0.72 6.80
Udaipur 0.76 6.33
Bengaluru 0.82 4.14
Patna 0.83 7.10
Bhubaneshwar 0.84 1.17
Vijayawada 0.90 1.20
Chennai 0.91 2.68
Surat 0.91 3.48
Haldia 0.95 NA
Bhavnagar 1.11 2.39
Thane 1.15 2.88
Ahmedabad 1.20 2.91
Pune 1.31 2.16
Raipur 1.32 1.85
Coimbatore 1.37 0.67
Faridabad 1.58 2.06
Jaipur 1.63 4.22
Kolkata 1.83 2.15
Ranchi 1.97 0.06
Gurgaon 2.13 0.27
Vishakapatnam 2.25 0.32
Jamshedpur 2.76 NA
Average, all 0.93 5.30 Average, Metros 1.19 10.39 Average,
10
[image:11.595.72.427.114.323.2]Source: ICLEI-South Asia, Energy and Carbon Emissions Profiles of 54 South Asian Cities, 2009 and Sridhar (2010).
Table 2: Air and Water Pollution in India
Air Quality Water Quality
Year PM SO₂ NO₂ BOD Ln(Fcoli) DO
1990 249.1 19.9 24.9 3.9 6.6 7.2
44 43 43 273 205 275
2000 193.5 16.7 27.8 4 4.9 7.1
68 71 71 313 270 311
2005 210.6 12.7 26.7 4.1 5.9 7.1
97 86 93 310 285 308
2006 202.9 12 25 -- -- --
116 104 115 -- -- --
2007 206.7 12.4 24.9 -- -- --
125 106 124 -- -- --
Notes: Units are ug/m³ for all air pollutants; mg/l for BOD and DO; Ln(MPN/100 ml) for Fcoli.
[image:11.595.75.490.370.488.2]Source: Greenstone and Hanna 2011
Table 3: Wastewater treatment capacity in urban areas in India in 2008 Category No. of
Cities
Total Water Supply ( in MLD)
Wastewater Generation ( in MLD)
Treatment Capacity (in MLD)
Class-I City 498 44,769.05 35,558.12 11,553.68 (32%)
Class-II town 410 3,324.83 2,696.7 233.7 (8%)
Total 908 48,093.88 38254 11787.38 (31%)
Source: CPCB 2008
Table 4: Annual health costs with pre Euro and Euro vehicle emissions standards in Delhi (Rupees in crores at 2000-2001 prices)
Pre Euro Euro I Euro II Euro III
Annual health costs
228 30 20 15
[image:11.595.68.505.550.598.2]