ISSN Online: 2158-7086 ISSN Print: 2158-706X
Patterns of Genetic Diversity of
the White-Nosed Coati Reveals
Phylogeographically Structured
Subpopulations in Mexico
Adrián Silva-Caballero1, Gloria León-Ávila2, David Valenzuela-Galván3, Jesús E. Maldonado4, Jorge Ortega1*
1Laboratorio de Bioconservación y Manejo, Posgrado en Ciencias Quimicobiológicas, Escuela Nacional de Ciencias Biológicas, Instituto Politécnico Nacional, Prolongación de Carpio y Plan de Ayala s/n, Mexico City, México
2Laboratorio de Genética, Posgrado en Ciencias Quimicobiológicas, Escuela Nacional de Ciencias Biológicas, Instituto Politécnico Nacional, Prolongación de Carpio y Plan de Ayala s/n, Mexico City, México
3Centro de Investigación en Biodiversidad y Conservación (CIByC), Universidad Autónoma del Estado de Morelos, Cuernavaca, México
4Center for Conservation Genomics, Smithsonian Conservation Biology Institute, National Zoological Park, Washington DC, USA
Abstract
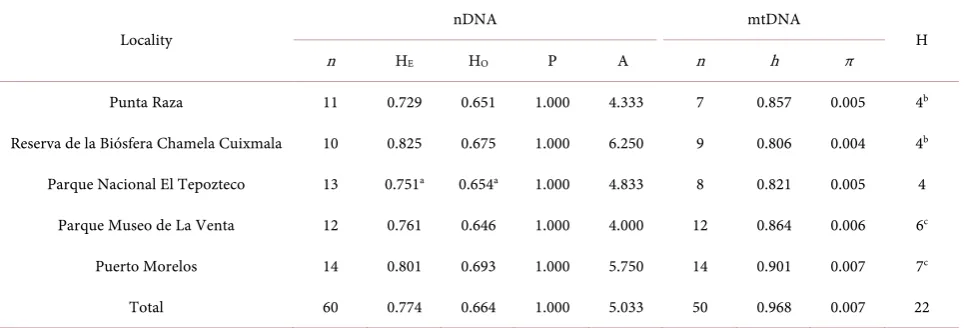
Coatis (Procyonidae; Nasua) are considered the only truly social mesocarni-vore mammals in Neotropical forests. In Mexico, white-nosed coatis (Nasua narica) are suspected to have undergone population reduction due to habitat loss and fragmentation and led to a lack of genetic adaptability and genetic isolation throughout its range. We examined patterns of genetic diversity and connectivity of five populations of Nasua narica distributed throughout Mex-ico (n = 60) by sequencing an ≈ 800 bp fragment of the mitochondrial cy-tochrome-b gene and also by screening 12 microsatellite loci. We found mod-erate to high levels of genetic variability for both genetic markers. We record-ed twenty-two different cytochrome-b haplotypes throughout the 5 samplrecord-ed areas and found that each of the sampled population of white-nosed coatis in Mexico harbors unique haplotypes and only three haplotypes were shared among two different populations that were closer geographically. All popula-tions had high haplotype diversity (h) (0.968 ± 0.008 (SD)) but lower levels of nucleotide diversity (π) of 0.007 ± 0.001 (SD). All microsatellite loci were po-lymorphic in all of the populations and the mean number of alleles per locus was 5.033 ± 1.545 (SD) with expected (HE) and observed (HO) heterozygosity
values of 0.774 and 0.664, respectively. However, low Wright F statistic values suggest the existence of a reduced heterozygosity (FST = 0.203, FIS = 0.134 and
How to cite this paper: Silva-Caballero, A., León-Ávila, G., Valenzuela-Galván, D., Maldonado, J.E. and Ortega, J. (2017) Pat-terns of Genetic Diversity of the White- Nosed Coati Reveals Phylogeographically Structured Subpopulations in Mexico. Na- tural Resources, 8, 31-53.
http://dx.doi.org/10.4236/nr.2017.81003
Received: December 28, 2016 Accepted: January 22, 2017 Published: January 25, 2017
Copyright © 2017 by authors and Scientific Research Publishing Inc. This work is licensed under the Creative Commons Attribution International License (CC BY 4.0).
http://creativecommons.org/licenses/by/4.0/
FIT = 0.310). Significant differences between the five populations confirmed
isolation by distance, which suggests genetic structure among five subpopula-tions.
Keywords
Alleles, Cytochrome b, Heterozygosity, Microsatellites, Nasua narica, Procyonids
1. Introduction
Processes that generate genetic structure of species are important for under-standing their ecology and evolution. In mammalian carnivores this information is crucial for understanding the mechanisms responsible for adaptive divergence and speciation [1][2]. Genetic structure is defined as the non-random distribu-tion of genetic variadistribu-tion among individuals within populadistribu-tions as the result of behavioral traits (forming herds, flocks or colonies; [3][4]), geographical fea-tures (spatial distance or topographical barriers; [5] [6]), or historical factors (colonization, range expansion or isolation; [7]). Among these factors, geo-graphical features appear to be one of the major forces shaping the genetic structure of several species, topographical barriers as mountain ranges [8], water bodies [9], steppes and deserts [10], and human infrastructure [11][12] can be-come determining factors in structuring populations due to their role in re-stricting gene flow [6]. Those geographical barriers impede the movement of genes among populations, which together with the dispersal capabilities and ability to occupy a variety of habitats define the genetic variation within subpo-pulations [2][13]. Moreover, it has been stated that successful conservation of species needs to maintain several populations across its range, in representative ecological and evolutionary conditions [14], which it will only be achieved through understanding the genetic structure of populations [13][15][16].
Paradoxically, even though mammals are among the most studied organisms on the planet [17], there are information gaps for some mammalian species, es-pecially in terms of their degree of variation and genetic diversity [18]. Such is the case of many mesocarnivores species, that despite their ecological impor-tance, they have been understudied in many genetic aspects [17][19][20]. Non-etheless, there are studies in mesocarnivores that have found genetic structure in a variety of ecological conditions, such as American mink (Neovison vison;
[13]), coyotes (Canis latrans; [11]), fishers (Martes pennanti; [21][22]), Eurasian otters (Lutra lutra; [23] [24]), Neotropical otters (Lontra longicaudis; [25]), Tasmanian devils (Sarcophilus laniarius; [15]), and wolverines (Gulo gulo; [26]).
phylogeogra-phy [17][33][34][35], and even taxonomic boundaries [36]. However, genetic markers, even widely used microsatellites, have not been employed to describe the variability and genetic structure of different N. narica populations. This me-socarnivore is highly gregarious, forming social groups or “bands” of up to 20 - 30 females and juveniles [27][37] [38]. Males are solitary individuals and dis-perse once they reach sexual maturity, joining bands briefly only during mating season [27][28][37][38]. Females are highly philopatric and their home ranges are close to and may even include their birth area [27][39] [40]. They do not migrate and their home ranges can change between seasons and years, for both bands and males [28][39][41][42].
It is considered that higher levels of philopatry as well as limited dispersal ca-pabilities, lead to more pronounced fine-scale genetic structure [43][44]. If an-imals do not disperse far away from their natal site, closely related individuals could be form part of the same bands [44]. Moreover, it is considered that large scale habitat loss and fragmentation are threatening N. narica [45]. Therefore it is suspected from that in Mexico N. narica populations have been severely re-duced and they may have even been extirpated in certain areas [45][46]. All the aforementioned combined with the peculiar orographic characteristics of Mex-ico, with a wide variation of reliefs and mountain ranges [47], certainly could lead to genetic isolation of these populations throughout the country.
In this study, we investigated the magnitude and spatial distribution of genetic diversity of N. narica populations in Mexico. Our objective was to explore the patterns of genetic diversity and connectivity of N. narica populations using mi-tochondrial and nuclear DNA markers. We hypothesized that genetic structure would be found, and that could be related to the presence of the geographical barriers across the country.
2. Materials and Methods
2.1. Study Area
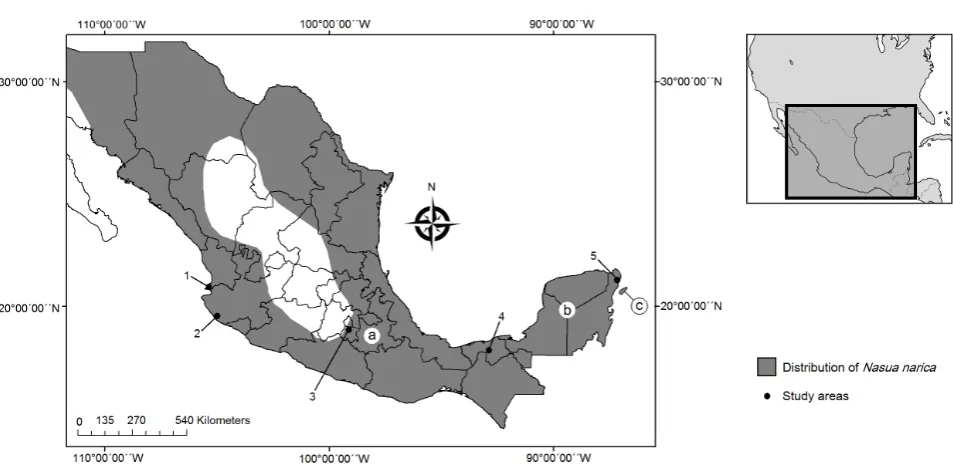
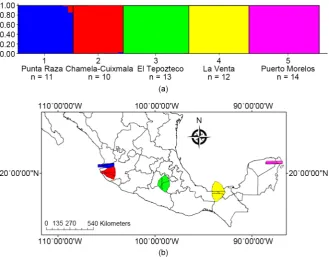
We used samples of N. narica from five study sites in Mexico (Figure 1), where the species is known to be relatively abundant, that were chosen based primarily on their geographic location because they are separated by the main mountain ranges of Mexico (Figure S1) and by insurmountable distances by the migratory patterns of the species: 1) Punta Raza (21˚00'15''N, 105˚17'20''W), Nayarit (n = 11); 2) Reserva de la Biosfera de Chamela-Cuixmala (19˚22'03''N, 104˚56'13''W), Jalisco (n = 10); 3) Parque Nacional El Tepozteco (18˚53'20''N, 99˚02'00''W), Morelos (n = 13); 4) Parque Museo de La Venta (17˚59'21''N, 92˚55'41''W), Ta-basco (n = 12); and 5) Puerto Morelos (20˚51'13''N, 86˚53'55''W), Quintana Roo (n = 14). We considered each sampling site as a separate population of the stu-died species.
2.2. Physical Restraint and Chemical Immobilization
Figure 1. Map of the distribution of N. narica in Mexico (after [37][45]): (a) N. n. molaris; (b) N. n. yucatanica; (c) N. n. nelsoni. Boundaries between subspecies are not shown because subspecies are not well defined. The study areas are marked with a black circle. 1. Punta Raza, Nayarit; 2. Reserva de la Biosfera Chamela-Cuixmala, Jalisco; 3. Parque Nacional El Tepozteco, Morelos; 4. Parque Museo de La Venta, Tabasco; 5. Puerto Morelos, Q. Roo.
and/or fruit (banana, pineapple, mango, etc.). We used an average of 25 traps in each study site, which were laid out in variable length transects; the choice of transects was based on the record of signs (footprints and feces) on the dirt roads and trails of the study areas, traps were set in one particular sampling transect at a study site for 4 to 8 days, or until there were no captures for 3 con-secutive days. Traps were patrolled twice a day, after de dawn and before sunset. Captured animals were immobilized with the use of Zoletil 100® (Virbac México S.A. de C.V.) administered at 10 mg/kg body weight [48] [49]. Captures were done under capture license FAUT-0251 extended by the Mexican government to the third author. All samples were collected following guidelines approved by the American Society of Mammalogists [50].
2.3. Sample Collection
Captured animals were sexed, weighed, measured, sampled, marked, and re-leased within 35 min. Tissue samples were obtained through a small cut from the edge of the ear (approximately 10 mm2) and were fixed in ethanol (96%). Most
of the sampling took place between spring 2011 and autumn 2012.
2.4. Laboratory Procedures
2.4.1. DNA Extraction, Amplification and Sequencing
Genomic DNA from tissue samples was extracted according to the universal and rapid salt-extraction protocol [51]. Quality of DNA was assessed by electropho-resis on 1 percent agarose gels in combination with molecular weight standards.
were performed in a volume of 25 µL with 0.2 µL Platinum Taq DNA polyme-rase (InvitrogenTM), 2.5 µL 10x RXN buffer, 2.5 µL of dNTP’s, 2 µL of each
pri-mer 10 mM, 1.5 µL of 50 mM MgCl2, 5 µL of DNA, and 9.3 µL of bidistilled
wa-ter. PCR protocol consisted of 3-min denaturation at 94˚C, followed by 30 cycles of 94˚C for 30 s, 55˚C for 30 s, and 72˚C for 30 s; with a final 6-min elongation step at 72˚C. PCR products were confirmed by electrophoresis in 2 percent aga-rose gels stained with ethidium bromide using a 100 bp ladder and a negative control. All reactions were performed on a Techne thermal cycler TC-3000. Mi-tochondrial DNA was purified using the Illustra GFX PCR DNA and gel purifi-cation kit (GE Healthcare Co.), cycle sequenced using the BigDye Terminator ver.3.1 (Applied Biosystems Inc.), and done using Applied Biosystems 3730xl automated sequencers (Life Technologies, Thermo Fisher Scientific Inc.).
2.4.2. Microsatellite Amplification and Genotyping
The set of 12 microsatellite primers used in this study was designed specifically for N. narica (Nasua 71, Nasua 193, Nasua 504, Nasua 833, Nasua 895, Nasua 931, Nasua 1050, Nasua 1251, Nasua 1757, Nasua 1785, Nasua 1990, and Nasua 2841—[53]). For these primers, the polymerase chain reactions (PCRs) were performed in a volume of 25 µL with 0.2 µL Platinum Taq DNA polymerase (In-vitrogenTM), 2.5 µL 10x RXN buffer, 2.5 µL of dNTP’s, 2 µL of each primer 10
mM, 2.5 µL of BSA 100x, 1.5 µL of 50 mM MgCl2, 4 µL of DNA, and 9.8 µL of
bidistilled water. PCR protocol beginning with a 5-min denaturation at 94˚C, followed by 30 cycles of: 94˚C for 30 s, 55˚C for 30 s, and 72˚C for 30 s; and a fi-nal 6-min elongation step at 72˚C. All reactions were performed on a Techne thermal cycler TC-3000. PCR products were confirmed by electrophoresis in 1 percent agarose gels stained with ethidium bromide using a 100 bp ladder and a negative control. Products were electrophoresed through an ABI 3730 genetic analyzer and fragment size analysis was performed using GENEMAPPER (Ap-plied Biosystems Inc.), each genotype was confirmed by visual inspection of the electropherograms.
2.5. Data Analysis
2.5.1. Phylogeographic Analysis Based on mtDNA
that inhabits South America [33].
2.5.2. Population Genetic Diversity and Structure Analyses Based on mtDNA
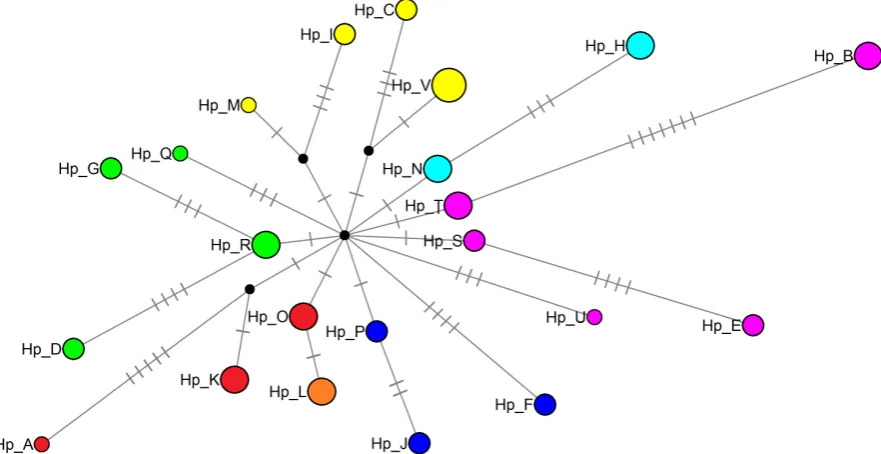
Basic statistics of DNA diversity, nucleotide (π) and haplotype (h) diversities were estimated using DNASP 5.10.01 [58]. We also constructed a haplotype network using the median-joining method implemented in the program NETWORK 4.6 [59]. The subdivision and population structure were examined through paired FST tests [60] and analysis of molecular variance (AMOVA; [61])
in ARLEQUIN 3.5.1.2 [62]. Finally, genetic haplotype of mtDNA equilibrium was tested by Tajima’s D [63] with ARLEQUIN.
2.5.3. Population Genetic Diversity and Structure Analyses Based on Microsatellites
For the microsatellites, genetic diversity was measured by the proportion of po-lymorphic loci (P) and the mean number of alleles per locus (A) by using Ge-netic Data Analysis (GDA) software 1.1 [64]. We calculated expected heterozy-gosity (HE), and observed heterozygosity (HO) according to Nei (1987; [65]), as
implemented in the program GENEPOP 4.0 [66]. Also, we performed an exact test for Hardy-Weinberg equilibrium (HWE) per population, by using Markov Chain Monte Carlo with 10,000 dememorization steps, and estimated deviations from HWE for each population through FIS [67], as well as linkage
disequili-brium using the program GENEPOP with the Bonferroni correction [68]. We used MICROCHECKER 2.2.3 [69], to detect loci containing errors due to stut-tering, short allele dominance, and null alleles through the Brookfield (1996;
[70]) method. To assess genetic differentiation of populations, the Wright’s (1951; [71]) fixation indices were calculated with FSTAT 2.9.3.2. [72].
AMOVA was performed using ARLEQUIN, with 1000 repetitions and confi-dence intervals based on 20,000 repetitions, to assess the proportion of variation found between individuals within populations, followed by intra-population variation. The degree of genetic differentiation among the predefined geograph-ical groups was measured by pairwise FST and RST and tested for statistical
signi-ficance using the ARLEQUIN permutation test (10,000 permutations per com-parison). We computed a statistical certainty of assignment or exclusion for each individual by using the exclusion simulation in GENECLASS2 [73], according to the partial Bayesian criterion of Rannala and Mountain (1997; [74]).
Isolation by distance was evaluated using the subroutine ISOLDE in GENEPOP, which computed a regression of RST on geographic distance [75], and applied the
each set of ten runs of K and employed to determine an optimal K, using 1,000,000 MCMC iterations and a burn-in period of 500,000 steps. We analyzed the mean posterior probabilities [Ln(P|D)] for each K, and accepted the value that provided the best fit to the data [78].
Structure analyses were also performed with another Bayesian method that inferred population genetic structure (BAPS 5.4; [79]). This method utilizes sto-chastic optimization to infer the posterior mode of the number of populations. The program was employed for cluster individuals using spatial mixture. We ran the software with a predefined maximum of K = 2 - 10, and repeated the runs five times in order to check the consistency of the results. For each run, the pro-gram reports the probabilities for different numbers of subpopulations, K ≤ maximum, and we averaged probabilities over the five runs.
3. Results
3.1. Levels of mtDNA Genetic Diversity and Distribution
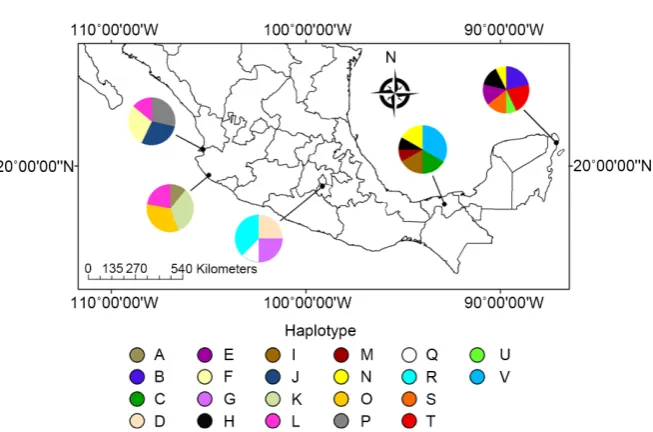
[image:7.595.58.547.557.721.2]We obtained an alignment of 800 bp of the cyt-b gene from 50 sequences ga-thered from specimens of N. narica; 52 variable sites were recorded, of which 42 were parsimonious informative sites. The nucleotide and haplotype diversity were h = 0.968 ± 0.008 and π = 0.007 ± 0.001, respectively (Table 1). We found a total of 22 haplotypes (Figure 2), haplotype V was the most common and found in 4 individuals. Haplotypes H and N were recovered from two localities (Puerto Morelos and La Venta). Haplotype L was found in three individuals from two localities (Punta Raza and Chamela-Cuixmala). Haplotypes A, M, Q and U were only found one time on individuals from Chamela-Cuixmala, La Venta, El Te-pozteco and Puerto Morelos, respectively. The localities with the highest number of haplotypes were Puerto Morelos with seven and La Venta with six, these were the areas with the largest number of collected samples for this genetic marker.
Table 1. Measures of diversity at 12 microsatellite loci (nDNA) and a fragment of Cytochrome-b (mtDNA) gene in five Mexican white-nosed coati populations. Samples per locality (n), expected heterozygosity (HE), observed heterozygosity (HO), Hardy-Wein- berg equilibrium, proportion of polymorphic loci (P), alleles per locus (A), haplotype diversity (h), nucleotide diversity (π), and haplotypes per locality (H).
Locality nDNA mtDNA H
n HE HO P A n h π
Punta Raza 11 0.729 0.651 1.000 4.333 7 0.857 0.005 4b
Reserva de la Biósfera Chamela Cuixmala 10 0.825 0.675 1.000 6.250 9 0.806 0.004 4b
Parque Nacional El Tepozteco 13 0.751a 0.654a 1.000 4.833 8 0.821 0.005 4
Parque Museo de La Venta 12 0.761 0.646 1.000 4.000 12 0.864 0.006 6c
Puerto Morelos 14 0.801 0.693 1.000 5.750 14 0.901 0.007 7c
Total 60 0.774 0.664 1.000 5.033 50 0.968 0.007 22
Figure 2. Distribution of cyt-b haplotypes of N. narica over its entire geographical range. Colors in the pie charts indicate frequency of haplotypes on every study area. From left to right: Punta Raza, Reserva de la Biosfera Chamela-Cuixmala, Parque Nacional El Tepoz-teco, Parque Museo de La Venta, and Puerto Morelos.
3.2. Phylogenetic Relationships and Phylogeographic Analyses
The Hasegawa-Kishino-Yano model (HKY; [80]) provided the best fit for the data set (−lnL = 1489.026). In general, topology estimates from ML and BI were very similar (Figure 3) both produced a phylogenetic reconstruction with high resolution, showing seven clades formed for haplotype clusters according to their membership in the sampled areas. On one end of ML the phylogenetic re-construction are the haplotypes from populations of the Pacific Coast (Punta Raza and Chamela-Cuixmala), and on the other end of the ML reconstruction are haplotypes from central Mexico (El Tepozteco) and populations of Southeast Mexico (La Venta and Puerto Morelos). The BI showed a very slight difference, haplotypes from the Chamela-Cuixmala were closely related to those from the Southeast, while haplotypes from central Mexico remains below the southern populations. Our haplotype network, like the phylogenetic reconstructions, showed clusters according to their membership in the study areas (Figure 4): Punta Raza (blue), Chamela-Cuixmala (red), El Tepozteco (green), La Venta (yellow), Puerto Morelos (pink), and shared haplotypes between La Venta and Puerto Morelos (aqua) and Chamela-Cuixmala and Punta Raza (orange).
The AMOVA results for cyt-b indicated that most of the genetic variability (88.4%) was found between individuals within populations, while between-pop- ulation variation had a relatively low value (11.6%). Population pairwise FST for
[image:9.595.59.534.73.389.2]
(a) (b)
Figure 3. Maximum likelihood phylogram based on cyt-b haplotypes of N. narica (a), and consensus tree from the Bayesian anal-ysis (b). Haplotypes formed clades corresponding to the areas of study as well as its geographically neighboring areas.
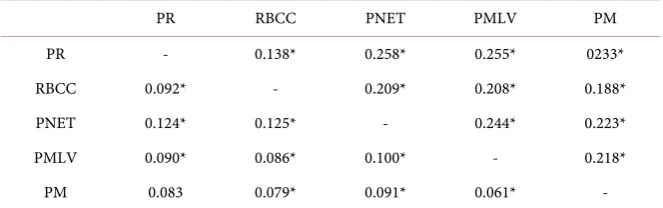
[image:9.595.79.520.437.664.2]Table 2. Pairwise comparison of genetic differentiation among five geographic popula-tions. FST estimates of a fragment of cyt-b gene (below diagonal) and microsatellite loci (above diagonal) from white-nosed coatis in Mexico. Numbers denoted by an asterisk (*) are significantly different from 0 (P < 0.05).
PR RBCC PNET PMLV PM
PR - 0.138* 0.258* 0.255* 0233*
RBCC 0.092* - 0.209* 0.208* 0.188* PNET 0.124* 0.125* - 0.244* 0.223* PMLV 0.090* 0.086* 0.100* - 0.218*
PM 0.083 0.079* 0.091* 0.061* -
Abbreviations: PR = Punta Raza, RBCC = Reserva de la Biosfera Chamela Cuixmala, PNET = Parque Na-cional El Tepozteco, PMLV = Parque Museo de La Venta, PM = Puerto Morelos.
3.3. Population Genetic Diversity and Structure Analyses Based on Microsatellites
We successfully extracted the DNA of 60 samples from individuals from the five different Mexican locations. We amplified the loci from each of the samples, and identified that all loci were polymorphic in all of the populations (P = 1.000), and the mean number of alleles per locus (A) was 5.033 ± 1.545 (SD) (Table 1). The mean HE was 0.774 and the mean HO was 0.664. Only one population, El
Tepozteco, was in HWE disequilibrium (X2 = 41.151, d.f. = 24, P = 0.016). One
pair of microsatellites (Nasua 504, Nasua 1251correct superindex) were found in linkage disequilibrium (P = 0.029).
Results of AMOVA for microsatellites showed that the highest proportion of variation was found within populations (67.04%), followed by variation be-tween-population (21.52%) (Table 3). Fixation indices supported the presence of genetic structure among populations (FST = 0.203), with a relatively high
in-breeding coefficient among them (FIS = 0.134 and FIT = 0.310) (Table 3).
Popu-lation pairwise RST and FST exhibited the lowest value between Punta Raza and
Chamela-Cuixmala (0.668 and 0.138 respectively; P < 0.05) (Table 2 and Table 4), both are located in the Pacific Coast and are the closest sampled locations (ca. 182.5 km). The highest value for pairwise RST (0.995; P < 0.05) was recorded
be-tween Chamela-Cuixmala on the Pacific Coast and Puerto Morelos in Quintana Roo (ca. 1897.6 kma part). The highest value for pairwise FST was recorded
be-tween Punta Raza and El Tepozteco (0.258; P < 0.05), populations separated by 686.7 km. All the comparisons showed significant differences (P < 0.05).
The assignment-exclusion test performed in GENECLASS confirmed the membership of each individual in its respective population, with a single excep-tion: the sample RBCC-004 was assigned to two populations: Punta Raza and Chamela-Cuixmala (10,000 replicates, CI 95%). The results of the Mantel test suggested the presence of isolation by distance between populations of N. narica in Mexico (r2 = 0.232, y = 0.023 + 0.038x, P < 0.05). Also, the Nm had a value of
Table 3. Proportion of genetic variation for nuclear microsatellite loci estimated through AMOVA (FST). The highest percentage of variation was found within populations, fol-lowed by differences between populations.
Microsatellite AMOVA
Source of variation Percentage of variation F coefficients Between populations 21.522 FST 0.203
Within populations 67.041 FIS 0.134
Between individuals within populations 11.437 FIT 0.310
Table 4. Pairwise comparison of genetic differentiation among five geographic popula-tions. RST estimates of microsatellite loci examined from white-nosed coatis in Mexico. Numbers denoted by an asterisk (*) are significantly different from 0 (P < 0.05).
PR RBCC PNET PMLV PM
PR - * * * *
RBCC 0.668* - * * *
PNET 0.982* 0.986* - * *
PMLV 0.992* 0.994* 0.984* - *
PM 0.994* 0.995* 0.991* 0.957* -
Abbreviations: PR = Punta Raza, RBCC = Reserva de la Biosfera Chamela Cuixmala, PNET = Parque Na-cional El Tepozteco, PMLV = Parque Museo de La Venta, PM = Puerto Morelos.
The STRUCTURE program suggested that sampled N. narica populations most likely represented defined groups. Five population clusters [mean LnP(D) = −6405.1] were identified without any prior population information, these clus-ters corresponded to the geographical groups (Figure 5(a)). BAPS program also yielded results suggesting 5 distinct clusters corresponding with the geographical groups (Figure 5(b)). The highest posterior probability was observed for K = 5 [mean log (marginal likelihood) = −3226.70], but in this case does not denote the sharing of alleles between populations of Chamela-Cuixmala and Punta Raza.
4. Discussion and Conclusions
This is the first phylogeographic and population genetics study of N. narica in Mexico. To date, little is known about the patterns of genetic diversity of this species. Previous genetic research efforts have been focused on identifying kin-ship among individuals [27] [28], or included in phylogenetic studies aimed at understanding relationships of different procyonid species [17][33].
[image:11.595.207.540.258.363.2]Figure 5. Genetic structure analyses. (a) Proportional membership of each white-nosed coati in the genetic clusters inferred by STRUCTURE with K = 5, with prior population information (USEPOPINFO = 0). Each individual is represented by a vertical bar, and the length of each bar indicates the probability of membership in each cluster; (b) Clustering of individuals of N. narica obtained by BAPS, from left to right: Punta Raza (blue), Re-serva de la Biosfera Chamela-Cuixmala (red), Parque Nacional El Tepozteco (green), Parque Museo de La Venta (yellow), and Puerto Morelos (pink).
Furthermore, high haplotype diversity coupled with low nucleotide diversity, has been linked with demographic expansions followed by a decline in popula-tion size [82]. This inference is also supported by the results obtained by demo-graphic test, Tajima’s D suggests that populations of N. narica coatis in Mexico previously went through a period of population expansion [83], but now are ex-perience population decline as some authors have proposed [45].
The microsatellite results showed that expected heterozygosity was generally higher than observed heterozygosity, and the overall genetic variation of N. na-rica in Mexico ranged from moderate to high (HE = 0.751 − 0.825, HO = 0.646 −
0.693; P > 0.05). Studies based on microsatellite data in other mesocarnivores found similar levels of heterozygosity: 0.673 in American mink [13], 0.675 in crab-eating raccoons [35], 0.600 in Eurasian otters [23], 0.623 in fishers [21], and 0.623 in ring-tailed coatis [35].
0.248), supports the idea of the low vagility/high philopatric behavior of the spe-cies. Previous studies have concluded that bands of individuals of the genus Na-sua are “extended” families with some unrelated individuals [27] [39][84]. Al-though there have been cases where male individuals have moved more than 20 km between years [85] our results suggest that at least in Mexico, gene flow among the sampled populations is rare and therefore the exchange of alleles among these populations is limited (distances between populations comprises the range of 182.5 km - 1916.2 km).
Several mechanisms that prevent inbreeding in the species have been re-ported: 1) males avoid mating with related females, 2) absence of temporal con-tinuity of a dominant male in the bands, 3) persistence of promiscuity despite “harem” behavior, and 4) variability in mate choice by females [27][28][39]. In addition, female migration occasionally occurs, despite the aggressions from the other members of the band due to the absence of kinship [27][31][39]. Still, our data suggests that the mating system and overlapping of band and home ranges of males [28] [39] are probably the cause for the observed values of inbreeding coefficients (FIS = 0.143 and FIT = 0.318). Although the value of inbreeding at
in-dividuals within populations level was relatively low at inin-dividuals relative to the total populations was relatively high [86] [87]. This may be an effect of males being the major contributors to gene flow [37][39][40][41].
Our results clearly indicated that white-nosed coatis in Mexico are currently not a panmictic population. The Mantel test result showed the existence of ge-netic isolation by distance; this was reinforced by the population pairwise com-parisons (FST and RST) for both genetic markers. Positive results of isolation by
distance have been recorded in other mesocarnivores such as American minks
[13], Eurasian otters [23], fishers [21], wolverines [26], and ring-tailed coatis
[35]. The ring-tailed coati provides an interesting comparison. It has been do-cumented that they have marked genetic structure [35], even though the social groups in South America typically include one adult male throughout the year
[88]. This has the potential to limit the genetic variation between litters, and fi-nally between populations. Considering this, it is not surprising that Mexican populations have shown marked structure because of their unique social system.
years, such as the mountain ranges of the Sierra Madre Occidental (SMOc), Sierra Madre Oriental (SMOr), and Trans-Mexican Volcanic Belt (TMVB) which originated in the Cretaceous-Cenozoic, late-Eocene and mid-Miocene re-spectively [6][91][92] (Figure S1). The SMOc runs parallel to the Pacific Coast, from the border with the United States until the TMVB and is bounded on the west by the Gulf of California and on the east by the Central Highlands [92], virtually isolating Punta Raza and Chamela-Cuixmala. On the other hand, the SMOr runs from the TMVB and it is projected continuously northwest, reaching into the center of Coahuila and Chihuahua, up to the northern border of Mexico
[91], forming a barrier between the populations of the southeast and the rest of the country. Finally, the TMVB extends east-west from the Pacific coast in San Blas, Nayarit and Banderas Bay, Jalisco to the Gulf of Mexico coast at Palma So-la, Veracruz [6], isolating El Tepozteco from the other ones.
The genetic differentiation between the N. narica populations recorded in this study is probably a result of limited gene flow, due to the combination of the demographic decline [45], dispersal capabilities of the species [40], and the iso-lating effects of the geographical barriers [6] [47]. That pattern has been ob-served for other carnivore species [21][26].
The Maximum Likelihood and Bayesian phylogenies revealed similar patterns, with minor changes between the position of clades and support nodes. Accord-ing to the distribution of haplotypes in the phylograms, the cluster from Punta Raza was the most divergent, followed by Chamela-Cuixmala, and finally the populations of El Tepozteco and Yucatán Peninsula, La Venta and Puerto Mo-relos. Separations and divergences observed in the phylogenetic reconstructions are underpinned by the records of the origin and dispersion of this family of procyonids [33] [93] [94] [95]. Fossil evidence suggests that these divergences occurred in tropical and subtropical forests of South and Central America while their dispersal occurred from north to south in the Americas [33][94] and con-sequently in Mexico, which is supported by the order in which the groups di-verge in the phylogenetic trees.
function depends on the genetic integrity and social structure of populations
[19]. Finally, a better understanding of carnivore interactions and their func-tional roles within a whole ecosystem context is crucial before wildlife manage-ment actions are applied, to avoid unforeseen deleterious effects [19].
Based on our results, we can conclude that populations of white-nosed coatis retain a significant level of genetic variability and there is strong evidence of ge-netic structure between populations distributed along various habitats and sepa-rated by well-established biogeographic barriers. Our research provides a first description of the variability and genetic structure of N. narica in Mexico, in-formation that can be an initial basis for setting conservation actions for this species aiming to maintain its genetic diversity and can provide a general framework for this purpose in regard to mesocarnivore species conservation in Mexico. Additional samples from the northern part of this species’ range may help to further elucidate the degree and history of separation between the dif-ferent populations. Future research should focus on obtaining more samples per population and sampling more and closer populations throughout the entire range of the species, to compare heterozygosity patterns, genetic diversity, and observed population structure. If this could be achieved in addition to the im-plementation of a monitoring protocol for population genetic variables, it could allow for early detection of population declines. Certainly, population genetics studies can have relevant implications for the implementation of conservation strategies in Mexico for this and other mesocarnivore species.
Acknowledgements
The first author was supported by Consejo Nacional de Ciencia y Tecnología (CONACyT; fellowship No. 257904). This work was supported by Cleveland Metropark Zoo Scott Neotropical Fund (2012) and Proyecto CONACyT Ciencia Básica (156725). We thank the Escuela Nacional de Ciencias Biológicas from In-stituto Politécnico Nacional (IPN) and Centro de Investigación en Biodiversidad y Conservación-Universidad Autónoma del Estado de Morelos (CIByC-UAEM) for all facilities. We thank Dr. Gerardo Zúñiga and Dr. Norberto Martínez for their valuable insights into the experimental design and data analysis which greatly improved the quality of this manuscript. We also thank Fernando Mon-tiel and Eduardo Sánchez for their field assistance. The scientific collecting per-mit was supplied by Secretaría del Medio Ambiente y Recursos Naturales (SEMARNAT; FAUT-0251).
References
[1] Montiel-Reyes, F., Maldonado, J.E., Del Real-Monroy, M., Martínez-Méndez, N. and Ortega, J. (2014) Non-Invasive Sampling Reveals Fine-Scale Genetic Structure in Black Bear Ursus americanus Populations from Northeastern Mexico. Endan-gered Species Research, 26, 179-188. https://doi.org/10.3354/esr00626
https://doi.org/10.1111/j.1365-294X.2006.03110.x
[3] Altmann, J., Alberts, S.C., Haines, S.A., Dubach, J., Muruthi, P., Coote, T., Geffen, E., Cheesman, D.J., Mututua, R.S., Saiyalel, S.N., Wayne, R.K., Lacy, R.C. and Bru-ford, M.W. (1996) Behavior Predicts Genetic Structure in a Wild Primate Group.
Proceedings of the National Academy of Sciences of the United States of America, 93, 5797-5801. https://doi.org/10.1073/pnas.93.12.5797
[4] Ross, K.G. (2001) Molecular Ecology of Social Behaviour: Analyses of Breeding Sys-tems and Genetic Structure. Molecular Ecology, 10, 265-284.
https://doi.org/10.1046/j.1365-294x.2001.01191.x
[5] Hartl, D.L. and Clark, G.C. (1997) Principles of Population Genetics. Sinauer Asso-ciates, Sunderland.
[6] Ruiz-Sanchez, E. and Specht, C.D. (2013) Influence of the Geological History of the Trans-Mexican Volcanic Belt on the Diversification of Nolina parviflora (Aspara-gaceae: Nolinoideae). Journal of Biogeography, 40, 1336-1347.
https://doi.org/10.1111/jbi.12073
[7] Templeton, A.R. (1998) Nested Clades Analyses of Phylogeographic Data: Testing Hypotheses about Gene Flow and Population History. Molecular Ecology, 7, 381-397. https://doi.org/10.1046/j.1365-294x.1998.00308.x
[8] Hanzen, D.H. (1967) Why Mountain Passes Are Higher in the Tropics. American Naturalist, 101, 233-249. https://doi.org/10.1086/282487
[9] Long, E.S., Diefenbach, D.R., Wallingford, B.D. and Rosenberry, C.S. (2010) Influ-ence of Roads, Rivers, and Mountains on Natal Dispersal of White-Tailed Deer.
Journal of Wildlife Management, 74, 1242-1249.
https://doi.org/10.1111/j.1937-2817.2010.tb01244.x
[10] Wang, A.J. (2009) Fine-Scale Population Structure in a Desert Amphibian: Land-scape Genetics of the Black Toad (Bufo exsul). Molecular Ecology, 18, 3847-3856.
https://doi.org/10.1111/j.1365-294X.2009.04338.x
[11] Riley, S.P.D., Pollinger, J.P., Sauvajot, R.M., York, E.C., Bromley, C., Fuller, T.K. and Wayne, R.K. (2006) A Southern California Freeway Is a Physical and Social Barrier to Gene Flow in Carnivores. Molecular Ecology, 15, 1733-1741.
https://doi.org/10.1111/j.1365-294X.2006.02907.x
[12] Wilson, R.E., Farley, S.D., McDonough, T.J., Talbot, S.L. and Barboza, P.S. (2015) A Genetic Discontinuity in Moose (Alces alces) in Alaska Corresponds with Fenced Transportation Infrastructure. Conservation Genetics, 16, 791-800.
https://doi.org/10.1007/s10592-015-0700-x
[13] Zalewski, A., Piertney, S.B., Zalewska, H. and Lambin, X. (2009) Landscape Barriers Reduce Gene Flow in an Invasive Carnivore: Geographical and Local Genetic Structure of American Mink in Scotland. Molecular Ecology, 18, 1601-1615.
https://doi.org/10.1111/j.1365-294X.2009.04131.x
[14] Redford, K.H., Amato, G., Baillie, J., Beldomenico, P., Bennett, E.L., Clum, N., Cook, R., Fonseca, G., Hedges, S., Launay, F., Lieberman, S., Mace, G.M., Muraya-ma, A., Putnam, A., Robinson, J.G., Rosenbaum, H., Sanderson, E.W., Stuart, S.N., Thomas, P. and Thorbjarnarson, J. (2011) What Does It Mean to Successfully Con-serve a (Vertebrate) Species? BioScience, 61, 39-48.
https://doi.org/10.1525/bio.2011.61.1.9
[15] Jones, M.E., Paetkau, D., Geffen, E. and Moritz, C. (2004) Genetic Diversity and Population Structure of Tasmanian Devils, the Largest Marsupial Carnivore. Mole-cular Ecology, 13, 2197-2209. https://doi.org/10.1111/j.1365-294X.2004.02239.x
and Marine Mammals: Diversity, Threat, and Knowledge. Science, 322, 225-230.
https://doi.org/10.1126/science.1165115
[17] Fulton, T.L. and Strobeck, C. (2007) Novel Phylogeny of the Raccoon Family (Pro-cyonidae: Carnivora) Based on Nuclear and Mitochondrial DNA Evidence. Mole-cular Phylogenetics and Evolution, 43, 1171-1177.
https://doi.org/10.1016/j.ympev.2006.10.019
[18] Lorenzo, M.C., Espinoza, M.E. and García, B.M. (2006) Genética y conservación en mamíferos silvestres mexicanos. In: Pimentel, P.E., Ortiz, M.A.R. and Breña, V.M. Eds., Tópicos de genética, Universidad Autónoma del Estado de México, Toluca, 165-188.
[19] Ritchie, E.G. and Johnson, C.N. (2009) Predator Interactions, Mesopredator Release and Biodiversity Conservation. Ecology Letters, 12, 982-998.
https://doi.org/10.1111/j.1461-0248.2009.01347.x
[20] Roemer, G.W., Gompper, M.E. and Van Valkengurgh, V. (2009) The Ecological Role of the Mammalian Mesocarnivore. BioScience, 59, 165-173.
https://doi.org/10.1525/bio.2009.59.2.9
[21] Kyle, C.J., Robitaille, J.F. and Strobeck, C. (2001) Genetic Variation and Structure of Fisher (Martes pennanti) Populations across North America. Molecular Ecology, 10, 2341-2347. https://doi.org/10.1046/j.1365-294X.2001.01351.x
[22] Wisely, S.M., Buskirk, S.W., Russell, G.A., Aubry, K.B. and Zielinski, W.J. (2004) Genetic Diversity and Structure of the Fisher (Martes pennanti) in a Peninsular and Peripheral Metapopulation. Journal of Mammalogy, 85, 640-648.
https://doi.org/10.1644/BEL-011
[23] Quaglietta, L., Fonseca, V.C., Hájková, P., Mira, A. and Boitani, L. (2013) Fine-Scale Population Genetic Structure and Short-Range Sex-Biased Dispersal in a Solitary Carnivore, Lutra lutra. Journal of Mammalogy, 94, 561-571.
https://doi.org/10.1644/12-MAMM-A-171.1
[24] Tison, J.L., Blennow, V., Palkopoulou, E., Gustafsson, P., Roos, A. and Dalén, L. (2015) Population Structure and Recent Temporal Changes in Genetic Variation in Eurasian otters from Sweden. Conservation Genetics, 16, 371-384.
https://doi.org/10.1007/s10592-014-0664-2
[25] Ortega, J., Navarrete, D. and Maldonado, J.E. (2012) Non-Invasive Sampling of En-dangered Neotropical River Otters Reveals High Levels of Dispersion in the Lacan-tun River System of Chiapas, Mexico. Animal Biodiversity and Conservation, 35, 59-69.
[26] Kyle, C.J. and Strobeck, C. (2001) Genetic Structure of North American Wolverine (Gulo gulo) Populations. Molecular Ecology, 10, 337-347.
https://doi.org/10.1046/j.1365-294x.2001.01222.x
[27] Gompper, M.E., Gittleman, J.L. and Wayne, R.K. (1997) Genetic Relatedness, Coali-tions and Social Behavior of White-Nosed Coatis, Nasua narica. Animal Behaviour, 53, 781-797. https://doi.org/10.1006/anbe.1996.0344
[28] Gompper, M.E., Gittleman, J.L. and Wayne, R.K. (1998) Dispersal, Philopatry, and Genetic Relatedness in a Social Carnivore: Comparing Males and Females. Molecu-lar Ecology, 7, 157-163. https://doi.org/10.1046/j.1365-294x.1998.00325.x
[29] Ratnayeke, S., Tuskan, G.A. and Pelton, M.R. (2002) Genetic Relatedness and Fe-male Spatial Organization in a Solitary Carnivore, the Raccoon, Procyon lotor. Mo-lecular Ecology, 11, 1115-1124. https://doi.org/10.1046/j.1365-294X.2002.01505.x
Mo-lecular Ecology, 20, 409-419. https://doi.org/10.1111/j.1365-294X.2010.04940.x
[31] Hirsh, B.T., Stanton, M.A. and Maldonado, J.E. (2012) Kinship Shapes Affiliative Social Networks but Not Aggression in Ring Tailed-Coatis. PLoS ONE, 7, e37301.
https://doi.org/10.1371/journal.pone.0037301
[32] Hauver, S., Hirsh, B.T., Prange, S., Dubach, J. and Gerth, S.D. (2013) Age, but Not Sex or Genetic Relatedness, Shapes Raccoon Dominance Patterns. Ethology, 119, 1-10. https://doi.org/10.1111/eth.12118
[33] Koepfli, K.P., Gompper, M.E., Eizirik, E., Ho, C.C., Linden, L., Maldonado, J.E. and Wayne, R.K. (2007) Phylogeny of the Procyonidae (Mammalia: Carnivora), Mole-cules, Morphology and the Great American Interchange. Molecular Phylogenetics and Evolution, 43, 1076-1095. https://doi.org/10.1016/j.ympev.2006.10.003
[34] Lonsinger, R.C., Schweizer, R.M., Pollinger, J.P., Wayne, R.K. and Roemer, G.W. (2015) Fine-Scale Genetic Structure of the Ringtail (Bassariscus astutus) in a Sky Island Mountain Range. Journal of Mammalogy, 96, 257-268.
https://doi.org/10.1093/jmammal/gyv050
[35] Tsuchiya-Jerep, M.T.N. (2009) Filogeografia, história demográfica e diversidade molecular de duas espécies neotropicais da família procyonidae (Mammalia, Carnívora): Nasua nasua e Procyon cancrivorus. MSc Dissertation, Pontifícia Un-iversidade Católica Do Rio Grande Do Sul, Porto Alegre.
[36] Helgen, K.M., Kays, R., Helgen, L.E., Tsuchiya-Jerep, T.N., Pinto, C.M., Koepfli, K.P., Eizirik, E. and Maldonado, J.E. (2009)Taxonomic Boundaries and geoGraphic Distributions Revealed by an Integrative Systematic Overview of the Mountain Coatis, Nasuella (Carnivora: Procyonidae). Small Carnivore Conservation, 41, 65-74.
[37] Gompper, M.E. (1995) Nasua narica. Mammalian Species, 487, 1-10.
https://doi.org/10.2307/3504195
[38] Aranda, S.M.J. (2012) Manual para el rastreo de mamíferos silvestres de México. Comisión Nacional para el Conocimiento y Uso de la Biodiversidad (CONABIO). México DF. https://doi.org/10.5962/bhl.title.113211
[39] Gompper, M.E. (1997) Population Ecology of the White-Nosed Coati (Nasua nari-ca) on Barro Colorado Island, Panama. Journal of Zoology, 241, 441-455.
https://doi.org/10.1111/j.1469-7998.1997.tb04836.x
[40] Valenzuela, D. and Ceballos, G. (2000) Habitat Selection, Home Range, and Activity of the White-Nosed Coati (Nasua narica) in a Mexican Tropical Dry Forest. Journal of Mammalogy, 81, 810-819.
https://doi.org/10.1644/1545-1542(2000)081<0810:HSHRAA>2.3.CO;2
[41] Hass, C.C. (2002) Home-Range Dynamics of White-Nosed Coatis in Southeastern Arizona. Journal of Mammalogy, 83, 934-946.
https://doi.org/10.1644/1545-1542(2002)083<0934:HRDOWN>2.0.CO;2
[42] Valenzuela, D. and MacDonald, D.W. (2002) Home-Range Use by White-Nosed Coatis (Nasua narica): Limited Water and a Test of the Resource Dispersion Hypo-thesis. Journal of Zoology, 258, 247-256.
https://doi.org/10.1017/S0952836902001358
[43] Storz, J.F., Bhat, H.R. and Kunz, H.R. (2001) Genetic Consequences of Polygyny and Social Structure in an Indian Fruit Bat, Cynopterus sphinx. I. Inbreeding, Out-breeding, and Population Subdivision. Evolution, 55, 1215-1223.
https://doi.org/10.1111/j.0014-3820.2001.tb00641.x
Dif-ferent Ecological Characteristics. Heredity, 104, 493-501.
https://doi.org/10.1038/hdy.2009.136
[45] Cuarón, A.D., Helgen, K., Reid, F., Pino, J. and Gónzalez-Maya, J.F. (2016) Nasua narica. The IUCN Red List of Threatened Species, Version 2016.2.
http://www.iucnredlist.org/details/41683/0
[46] Glatston, A.R. (1994) The Red Panda, Olingos, Coatis, Raccoons, and Their Rela-tives. Status Survey and Conservation Action Plan for Procyonids and Ailurids. IUCN/SSC Mustelid, Viverrid and Procyonid Specialist Group. International Union for Conservation of Nature and Natural Resources, Switzerland.
[47] Morrone, J.J. (2005) Hacia una síntesis biogeográfica de México. Revista Mexicana de Biodiversidad, 76, 207-252.
[48] Evans, R.H. (2002) Anesthesia and Restraint of Raccoons and Relatives (Carnivora, Procyonidae). http://www.ivis.org
[49] Kollias, G. and Abou, M.N. (2007) Procyonids and Mustelids. In: West, G., Heard, D. and Caulkett, N., Eds., Zoo Animal and Wildlife Immobilization and Anesthesia, Blackwell Publishing, Ames, 417-428. https://doi.org/10.1002/9780470376478.ch36
[50] Sikes, R.S., Gannon, W.L. and the Animal Care and Use Committee of the Ameri-can Society of Mammalogists (2011) Guidelines of the AmeriAmeri-can Society of Mam-malogists for the Use of Wild Mammals in Research. Journal of Mammalogy, 92, 235-253. https://doi.org/10.1644/10-MAMM-F-355.1
[51] Aljanabi, S.M. and Martinez, I. (1997) Universal and Rapid Salt-Extraction of High Quality Genomic DNA for PCR-Based Techniques. Nucleic Acids Research, 25, 4692-4693. https://doi.org/10.1093/nar/25.22.4692
[52] Irwin, D.M., Kocher, T.D. and Wilson, A.C. (1991) Evolution of the Cytochrome b
Gene of Mammals. Journal of Molecular Evolution, 32, 128-144.
https://doi.org/10.1007/BF02515385
[53] Sánchez Garibay, E., Silva-Caballero, A., Del Real-Monroy, M., Lance, S.L., Valen-zuela-Galván, D. and Ortega, J. (2012) Development of 24 Microsatellite Markers for the White Nosed Coati (Nasua narica) Using 454 Sequencing. Conservation Genetics Resources, 4, 661-663. https://doi.org/10.1007/s12686-012-9617-6
[54] Hall, T. (1999) BioEdita User-Friendly Biological Sequence Alignment Editor and Analysis Program for Windows 95/98/NT. Nucleic Acids Symposium Series, 41, 95-98.
[55] Darriba, D., Taboada, G.L., Doallo, R. and Posada, D. (2012) JModelTest 2: More Models, New Heuristics and Parallel Computing. Nature Methods, 9, 772.
https://doi.org/10.1038/nmeth.2109
[56] Guindon, S., Dufayard, J.F., Lefort, V., Anisimova, M., Hordijk, W. and Gascuel, O. (2010) New Algorithms and Methods to Estimate Maximum-Likelihood Phyloge-nies: Assessing the Performance of PhyML 3.0. Systematic Biology, 59, 307-321.
https://doi.org/10.1093/sysbio/syq010
[57] Ronquist, F. and Huelsenbeck, J.P. (2003) MrBayes 3: Bayesian Phylogenetic Infe-rence under Mixed Models. Bioinformatics, 19, 1572-1574.
https://doi.org/10.1093/bioinformatics/btg180
[58] Librado, P. and Rozas, J. (2009) DnaSP v5 a Software for Comprehensive Analysis of DNA Polymorphism Data. Bioinformatics, 25, 1451-1452.
https://doi.org/10.1093/bioinformatics/btp187
[59] Bandelt, H.J., Forster, P. and Röhl, A. (1999) Median-Joining Networks for Infer-ring Intraspecific Phylogenies. Molecular Biology and Evolution, 16, 37-48.
[60] Cockerham, C.C. and Weir, B.S. (1993) Estimation of Gene Flow from F-Statistics.
Evolution, 47, 855-863. https://doi.org/10.2307/2410189
[61] Excoffier, L., Smouse, P.E. and Quattro, J.M. (1992) Analysis of Molecular Variance Inferred from Metric Distance among DNA Haplotypes: Application to Human Mitochondrial DNA Restriction Data. Genetics, 131, 479-491.
[62] Excoffier, L, and Lischer, H.E.L. (2010) Arlequin Suite ver 3.5, a New Series of Pro-grams to Perform Population Genetics Analyses under Linux and Windows. Mole-cular Ecology Resources, 10, 564-567.
https://doi.org/10.1111/j.1755-0998.2010.02847.x
[63] Tajima, F. (1989) Statistical Method for Testing the Neutral Mutation Hypothesis by DNA Polymorphism. Genetics, 123, 585-595.
[64] Lewis, P.O. and Zaykin, D. (2001) GDA (Genetic Data Analysis): Computer Pro-gram for the Analysis of Allelic Data. Versión 1.1, University of Connecticut, Storrs.
http://phylogeny.uconn.edu/software/
[65] Nei, M. (1987) Molecular Evolutionary Genetics. Columbia University Press, New York.
[66] Rousset, F. (2008) Genepop’007: A Complete Re-Implementation of the Genepop Software for Windows and Linux. Molecular Ecology Resources, 8, 103-106.
https://doi.org/10.1111/j.1471-8286.2007.01931.x
[67] Weir, B.S. and Cockerham, C.C. (1984) Estimating F-Statistics for the Analysis of Population Structure. Evolution, 38, 1358-1370. https://doi.org/10.2307/2408641
[68] Rice, W.R. (1989) Analyzing Tables of Statistical Tests. Evolution, 43, 223-225.
https://doi.org/10.2307/2409177
[69] Van Oosterhout, C., Hutchinson, W.F., Wills, D.P.M. and Shipley, P. (2004) MICRO-CHECKER: Software for Identifying and Correcting Genotyping Errors in Microsatellite Data. Molecular Ecology Resources, 4, 535-538.
https://doi.org/10.1111/j.1471-8286.2004.00684.x
[70] Brookfield, J.F.Y. (1996) A Simple New Method for Estimating Null Allele Fre-quency from Heterozygote Deficiency. Molecular Ecology, 5, 453-455.
https://doi.org/10.1111/j.1365-294X.1996.tb00336.x
[71] Wright, S. (1951) The Genetical Structure of Populations. Annals of Eugenics, 15, 323-354. https://doi.org/10.1111/j.1469-1809.1949.tb02451.x
[72] Goudet, J. (1995) FSTAT (Version 1.2): A Computer Program to Calculate F-Statistics. Journal of Heredity, 86, 485-486.
[73] Piry, S., Alapetite, A., Cornuet, J.M., Paetkau, D., Baudouin, L. and Estoup, A. (2004) GeneClass2: A Software for Genetic Assignment and First-Generation Mi-grant Detection. Journal of Heredity, 95, 536-539.
https://doi.org/10.1093/jhered/esh074
[74] Rannala, B. and Mountain, J.L. (1997) Detecting Immigration by Using Multilocus Genotypes. Proceedings of the National Academy of Sciences of the United States of America, 94, 9197-9201. https://doi.org/10.1073/pnas.94.17.9197
[75] Rousset, F. (1997) Genetic Differentiation and Estimation of Gene Flow from F-Statistics under Isolation by Distance. Genetics, 145, 1219-1228.
[76] Mantel, N. (1967) The Detection of Disease Clustering and Generalized Regression Approach. Cancer Research, 27, 209-220.
[77] Barton, N.H. and Slatkin, M. (1986) A Quasi-Equilibrium Theory of the Distribu-tion of Rare Alleles in a Subdivided PopulaDistribu-tion. Heredity, 56, 409-415.
[78] Pritchard, J.K., Stephens, M. and Donnelly, P. (2000) Inference of Population Structure Using Multilocus Genotype Data. Genetics, 155, 945-959.
[79] Corander, J., Marttinen, P., Sirén, J. and Tang, J. (2008) Enhanced Bayesian Model-ling in BAPS Software for Learning Genetic Structures of Populations. BMC Bioin-formatics, 9, 539. https://doi.org/10.1186/1471-2105-9-539
[80] Hasegawa, M., Kishino, H. and Yano, T. (1985) Dating the Human-Ape Split by a Molecular Clock of Mitochondrial DNA. Journal of Molecular Evolution, 22, 160-174. https://doi.org/10.1007/BF02101694
[81] McFadden, K.W. (2004) The Ecology, Evolution and Natural History of the Endan-gered Carnivores of Cozumel Island, Mexico. PhD Dissertation, Columbia Univer-sity, New York.
[82] Grant, W.S. and Bowen, B.W. (1998) Shallow Population Histories in Deep Evolu-tionary Lineages of Marine Fishes: Insights for Sardines and Anchovies and Lessons for Conservation. Journal of Heredity, 89, 415-426.
https://doi.org/10.1093/jhered/89.5.415
[83] Hamilton, M.B. (2009) Population Genetics. Wiley-Blackwell, West Sussex. [84] Costa, E.M.J., Mauro, R.A. and Silva, J.S.V. (2009) Group Composition and Activity
Patterns of Brown-Nosed Coatis in Savanna Fragments, Mato Grosso do Sul, Brazil.
Brazilian Journal of Biology, 69, 985-991.
https://doi.org/10.1590/S1519-69842009000500002
[85] Lanning, D.V. (1976) Density in Movements of the Coati in Arizona. Journal of Mammalogy, 57, 609-611. https://doi.org/10.2307/1379318
[86] Wright, S. (1965) The Interpretation of Population Structure by F-Statistics with Special Regard to Systems of Mating. Evolution, 19, 395-420.
https://doi.org/10.2307/2406450
[87] Wright, S. (1978) Evolution and the Genetics of Populations. Vol. 4. Variability within and among Natural Populations. University of Chicago Press, Chicago. [88] Hirsh, B.T. (2011) Long Term Adult Male Sociality in Ring-Tailed Coatis (Nasua
nasua). Mammalia, 75, 301-304. https://doi.org/10.1515/mamm.2011.030
[89] Freeland, J.R. (2005) Molecular Ecology. Wiley, South Sussex.
[90] Selkoe, K.A. and Toonen, R.J. (2006) Microsatellites for Ecologists: A Practical Guide to Using and Evaluating Microsatellite Markers. Ecology Letters, 9, 615-629.
https://doi.org/10.1111/j.1461-0248.2006.00889.x
[91] Eguiluz de Antuñano, S., Aranda-García, M. and Marrett, R. (2000) Tectónica de la Sierra Madre Oriental, México. Boletín de la Sociedad Geológica Mexicana, 53, 1-26.
[92] Ferrari, L., Valencia, M. and Bryan, S. (2005) Magmatismo y tectónica en la Sierra Madre Occidental y su relación con la evolución de la margen occidental de Nor-teamérica. Boletín de la Sociedad Geológica Mexicana, 57, 343-378.
[93] Wolsan, M. and Lange-Badré, B. (1996) An Arctomorph Carnivoran Skull from the Phosphorites du Quercy and the origin of Procyonids. Acta Palaeontologica Polo-nica, 41, 277-298.
[94] Webb, S.D. (1997) The Great American Faunal Interchange. In: Coates, A.G., Ed.,
Central America: A Natural and Cultural History, Yale University Press, New Ha-ven, 97-122.
https://doi.org/10.1671/0272-4634(2004)024[0709:BAPMCP]2.0.CO;2
[96] Valenzuela, D. (1998) Natural History of the White-Nosed Coati, Nasua narica, in a Tropical Dry Forest of Western of México. Revista Mexicana de Mastozoología, 3, 26-44.
[97] Sáenz, J. (1994) Ecología del pizote (Nasua narica) y su papel como dispersor de semillas en el bosque seco neotropical, Costa Rica. MSc Dissertation, Universidad Nacional Costa Rica, Heredia,
[98] Gómez-Ortiz, Y. and Monroy-Vilchis, O. (2013) Feeding Ecology of Puma Puma concolor in Mexican Montane Forests with Comments about Jaguar Panthera onca.
Wildlife Biology, 19, 173-187. https://doi.org/10.2981/12-092
[99] Hernández-SaintMartín, A.D., Rosas-Rosas, O.C., Palacio-Núñez, J., Tarango- Arambula, L.A., Clemente-Sánchez, F. and Hoogesteijn, A.L. (2015) Food Habits of Jaguar and Puma in a Protected Area and Adjacent Fragmented Landscape of Nor-theastern Mexico. Natural Areas Journal, 35, 308-317.
Figure S1. Map of Mexico showing the main mountain chains in the country. (a) Sierra Madre Occidental; (b) Sierra Madre Oriental, (c) Transvolcanic Belt of central Mexico, (d) Sierra Madre del Sur, (e) Sierra Madre de Chiapas. The study areas are marked with a black circle. 1. Punta Raza, Nayarit; 2. Reserva de la Biosfera Chamela-Cuixmala, Jalisco; 3. Parque Nacional El Tepozteco, Morelos; 4. Parque Museo de La Venta, Tabasco; 5. Puerto Morelos, Q. Roo.
Submit or recommend next manuscript to SCIRP and we will provide best service for you:
Accepting pre-submission inquiries through Email, Facebook, LinkedIn, Twitter, etc. A wide selection of journals (inclusive of 9 subjects, more than 200 journals)
Providing 24-hour high-quality service User-friendly online submission system Fair and swift peer-review system
Efficient typesetting and proofreading procedure
Display of the result of downloads and visits, as well as the number of cited articles Maximum dissemination of your research work
Submit your manuscript at: http://papersubmission.scirp.org/
[image:23.595.60.537.60.301.2]