Munich Personal RePEc Archive
Determinants of Individual Investor
Behaviour: An Orthogonal Linear
Transformation Approach
Chandra, Abhijeet and Kumar, Ravinder
Jamia Millia Islamia (Central University), New Delhi
13 January 2011
Online at
https://mpra.ub.uni-muenchen.de/29722/
Determinants of Individual Investor Behaviour: An Orthogonal Linear
Transformation Approach
Abhijeet Chandra*
and Ravinder Kumar
Abstract
E xpected utility theory views the individual investment decision as a tradeoff between immediate consumption and deferred consumption. But individuals do not always prefer according to the classical theory of economics. Recent studies on individual investor behavior have shown that they do not act in a rational manner, rather several factors influences their investment decisions in stock market. The present study considers this theory of irrationality of individual investors and investigates into their behaviour relating to investment decisions. We examine whether some psychological and contextual factors affect individual investor behaviour and if yes which factors influences most. E xtrapolating from previous literature on economics, finance and psychology, we surveyed individual investors to find what and to what extent affects their investment behaviour. Our conceptual analysis, empirical findings and the perspective framework that we have developed in the present study, provide five major factors that can influence individual investor behaviour in Indian stock market. The findings can be useful in profiling individual investors and designing appropriate investment strategies according to their personal characteristics, thereby enabling them optimum return on their investments.
Keywords: Individual investor, Psychological biases, Investment behaviour, Indian stock market, Behavioural economics.
JE L Code:C38, C91, D03, G11.
*Doctoral Candidate in Finance (Abhijeet.Chandra@ yahoo.com).
Associate Professor in Behavioral Sciences, Department of Commerce & Business Studies, Jamia Millia Islamia
(Central University), New Delhi – 110 025. He can be reached at Drkumar2005@ gmail.com.
INTRODUCTION
For a long time, the investors’ full rationality was the main hypothesis of the most academic research in finance. In fact, it was mainly supposed that stock prices are fixed by rational investors’ anticipations and reactions. Rationality here refers to the two main factors, namely, the exhaustive and objective treatment of available as well as potential information. Because of its simplicity and its success to capture the stock price movements, this famous investor’s rationality hypothesis was for a long time supported by the academic researchers in finance. Nevertheless and since recent movements, the financial academic researchers’ enthusiasm for this hypothesis becomes much weaker. This changing perceptions lead to experimental research by the psychologists by introducing the irrationality of human beings (von Neumann and Morgenstern, 1944). Researchers in finance were then motivated to break with the full rationality hypothesis and to recognise from now on the neutral effect of some psychological biases on the investors’ decisions and reactions, and subsequently the effect of such reactions on the stock price movements. In the present study, the researcher makes an attempt in the behavioural finance research. The present study focuses on the psychological biases influencing individual investors trading in an Indian context.
Recent studies have argued that Prospect Theory (Kahenman and Tversky, 1979) and mental accounting (Thaler, 1985), apart from several other psychological biases, provide possible explanations for investor behaviour (e.g. the disposition effect) and for outstanding asset pricing anomalies such as the equity premium puzzle, the value premium, and the momentum effect. It is noted that the academics related to this new financial psychological research area are contended with borrowing and extrapolating the psychological biases from the famous psychologists’ experiments’ results to investors in stock markets. The extrapolation of the psychological results to financial markets asserts that under the effect of one or a set of natural and human biases, agents in financial markets could not be of full rationality, especially to understand and react to news immediately and appropriately. That’s why the agents appear to over or under react to news, driving by this way, a momentum effect in stock prices, and subsequently in returns.
THE ORE TICAL F RAME WORK
There are a large number of researches in behavioural finance covering the issue of dynamic relationship between individual investor behaviour, trading volume, and movements in stock prices, returns and volatility. This study is a part of a growing literature that examines the dynamic relation between individual investor trading trading and returns. The major studies include Odean (1998, 1999),Choe, Kho and Stulz (1999), Barber and Odean (2000, 2001, 2005), Grinblatt and Keloparju (2000, 2001), Coval, Hirshleifer and Smway (2002), Goetzmann and Massa (2002), Griffin, Harris and Topalogu (2003), Jackson (2003), Andrade, Change and Seasholes (2005), Barber et al. (2005), Barber, Odean and Zhu (2005), Hvidkjaer (2005), Richards (2005), and San (2005).
This may also help in revising the asset pricing theories by incorporating behavioural factors into the existing theories (behavioural asset pricing theories also referred to as Behavioural Asset Pricing Models are being worked upon for their validity in financial economics literature across the world).
Assessing individual behavior thorough questionnaire survey is a well adopted approach in behavioral sciences research. A large number of researchers adopt this approach to identify the significance of several cognitive and other factors on individual behavior. Nagy and Obenberger (1994) examined factors influencing investor behaviour. They developed a questionnaire that included 34 factors such as expected corporate earnings, diversification needs, feelings for firm’s products and services, past performance of stocks, past performance of their own portfolio, stock broker recommendations to name a few. Their findings suggested that classical wealth-maximization criteria are important to investors, even though they employ diverse criteria when choosing stocks for investment. Contemporary concerns such as local and international operations, environmental track record and the firm’s ethical posture appear to be given only cursory consideration. The recommendations of brokerage houses, individual stock brokers, family members and co-workers go largely unheeded. Many individual investors discount the benefits of valuation models when evaluating stocks.
Information has been one of the most important components in determining the behavior of individuals. In case of their behavior in stock market, it becomes even more critical to access and incorporate into their decision making updated information included in financial reports, periodical press releases, media coverage and so on. Researchers have acknowledged the significance of information factor in individual investment behaviour. E pstein (1994) examined the demand for social information by individual investors. The results indicate the usefulness of annual reports to corporate shareholders. The results also indicate a strong demand for information about the product safety and quality, and about the company’s environmental activities. Furthermore, a majority of the shareholders surveyed also want the company to report on corporate ethics, employees relations and community involvement.
behaviour of active investors in the Athens Stock E xchange (ASE ) influencing by the overall trends prevailing at the time of the survey in the ASE .
Fisher and Statman (2000) revealed that the sentiment of Wall Street strategists is unrelated to the sentiment of individual investors or that of newsletter writer (another category of investors provided by them), although the sentiment of the individual investors and newsletter writers groups is closely related. They concluded that sentiment can be useful for tactical asset allocation, and that a negative relationship between the sentiment of each of these three groups and future stock returns, and the relationship is strategically significant for Wall Street strategists and individual investors. Malmendier and Shanthikumar (2003) tried to answer the question: Are small investors naïve? They found that large investors generate abnormal volumes of buyer initiated trades after a positive recommendation only if the analyst is unaffiliated. Small traders exert abnormal buy pressure after all positive recommendations, including those of affiliated analysts. Using the NYSE Traders and Quotations Database, they found that large traders adjust their trading response downward. Hodge (2003) analyzed investors’ perceptions of earnings quality, auditor independence, and the usefulness of audited financial information. He concluded that lower perceptions of earnings quality are associated with greater reliance on a firm’s audited financial statements and fundamental analysis of those statements when making investment decisions.
Individual behavior can lead them act in a totally unexpected way and subsequently they end up seeing their investment performing very poorly in usual case. Kim and Nofsinger (2003) studied individual investors in the Japanese markets and examine their behaviour and performance. They used the market level data and found that Japanese investors own risky and high book-to-market stocks, trade frequently, make poor trading decisions, and buy recent winners. Further, these behaviours and characteristics appear to vary depending on the bull or bear market conditions. They observe that it is primarily during a bull market where individuals tend to hold high book-to-market stocks, as opposed to a bear market where they exhibit an inclination towards high beta stocks. Overall the poor performance by individual investors can largely be explained by this tendency to hold value stocks during advancing markets and high risk stocks during declining market. They conclude that these behaviours reveal at the market level also represents important findings and hence, become one of the important bases of our study of individual investors in India.
tax-loss selling, margin calls, the number of stocks in the portfolio, the difference in the potential proceeds from selling winners and losers, correlations among winners and among losers, and delays in sales order execution do not fully account for the observed behaviour. In addition, the extent to which mixed sales of winners and losers are consistent with the hedonic editing hypothesis is greater than what we could expect under random realizations. The evidence suggests that a psychological error called mental accounting is likely to play a significant role in investors’ trading decisions.
The study conducted by Brown and Cliff (2004) extends much scope for the present study conducted in the Indian context. In their study, Brown and Cliff (2004) investigated investor sentiment and its relation to near-term stock market returns. They find that many commonly cited indirect measures of sentiments are related to direct measures (surveys) of investor sentiment. However, past market returns are also an important determinant of sentiment. Although sentiment levels and changes are strongly correlated with contemporaneous market returns, the tests in this study show that sentiment has little predictive power for near-term future stock returns. Finally, the evidence does not support the conventional wisdom that sentiment primarily affects individual investors and small stocks.
Fischer and Gerhardt (2007) conducted extensive research on individual investor investment decision making. They find that individual investor investment decisions deviate from recommendations of financial theory. They show that these deviations lead to considerable welfare losses. Therefore they conclude that financial advice is potentially correcting factor in investment decision making process and construct a simple model to capture its very impact on individual investors’ investment success, measured in risk-adjusted return and wealth.
After analysis of the existing literature on individual investor behaviour and economic and investment decision making, the main issues reported in the above studies can be summarized as follows:
There is no support for the overreaction hypothesis.
Investor over-reaction to a long series of bad news could produce predictable mispricing of stock.
Classical wealth-maximization criteria are important to investors.
The recommendations of brokerage houses, individual stock brokers, family members and co-workers go largely unheeded.
Investors exhibit a strong demand for information about product safety and quality, and about the company’s environmental activities.
There exist strong forms of the analyst summary recommendation report, i.e. one with additional information supporting the analysts’ position further, reduces the disposition error for gains and also reduces the disposition error for losses.
The behaviour of individual investors caused by underlying sentiments has a significant relationship with the movements in stock prices and hence, with the stock returns.
Net trading by individual investors is a powerful predictor of future prices and returns that is not subsumed by either past returns or past volume.
Most of the studies are carried out in developed economies context. Little evidence has been available from emerging economies. This aspect particularly makes the present research study more relevant in Indian context. Studying Indian individual investors trading behaviour would seem an interesting proposition for both the market stakeholders and the regulators and policy makers.All these issues are relevant enough to initiate an empirical study on individual investor behaviour in an entirely Indian context. Considering these motivations, the researchers attempt to provide evidence for irrational financial behavior of individual investors.
RE SE ARCH OBJE CTIVE S AND ME THODOLOGY
It is evident from the review of literature relevant to the research issues that there is a dynamic relationship between trading volume and stock returns. The relationship between various cognitive and behavioural factors and individual investment behaviour has been one of the most discussed and explored issues among the financial economics and applied finance researchers worldwide. A large number of research studies were run to understand the nature of individual behavior in financial markets, but most of them are undertaken in the stock markets of the United States of America, the United Kingdom, E urope and some other developed economies. Not many studies were pursued in Asian, particularly in Indian context. Given the mixed empirical results on individual investment behaviour especially in emerging market context, more empirical research from other emerging financial markets is needed to better understand the individual behavior regarding investment decision-making. The present study represents one such attempt to investigate the factors influencing individual investor behaviour in Indian Stock Market.
Despite the growing interests of finance researchers in this upcoming and relatively new stream popularly known as behavioural finance, very few studies in India have been undertaken with reference to the behaviour of individual investors. Individual investors are said to be influenced by some psychological biases. These biases tend to affect their behaviour in financial decision making and subsequently their trading behaviour in stock market. It is, therefore, important to identify the factors most influential to individual trading behaviour. Identifying psychological factors affecting individual trading behaviour and then confirming the presence of these factors among Indian individual investors will help establish the fact that Indian individual investors tend to make trading decisions under the influence of specific psychological biases, and that their trading behaviour is further having a significant relationship with stock price movements.
The preceding discussions coupled with an extensive literature review help the researcher identify the following research gaps:
(i) Identifying and confirmation of psychological biases prevailing among Indian investors is required to establish their respective role in trading behaviour of individual investors in Indian stock market;
(ii) E xamination of the extent to which Indian individual investors tend to be influenced by various psychological biases is needed;
(iii) Understanding the individual investor behaviour may further lead to understand the market microstructure better and shift the focus from institution-centric approach to a balanced approach (where individual investors are also viewed as a significant player in stock market).
The framework of this study requires clear definitions in critical realist terms of the objects of analysis. Here we discuss the formal research objectives in order to fill the gaps identified from the detailed literature review. The present study bases its analysis with following objectives:
(i) to identify the psychological biases which determine individual investor trading behaviour;
(ii) to confirm the presence of these psychological biases among Indian individual investors; (These two objectives mak e this study both of exploratory and confirmatory nature.)
(iii) to examine the extent to which these psychological biases are responsible for individual investment behaviour.
legislation and the additional procedure needed to make the stock market more investor-friendly and efficient.
The present study examines the factors that appear to exercise the greatest influence on the individual stock (equity) investors, and includes not only the factors investigated by previous studies and derived from prevailing behavioural finance theories and contextual psychological experiments, but also introduces additional factors generated through personal interviews that are supposed to influence the stockholders’ investment decisions in Indian stock market. Personal interviews were conducted with appropriate inputs from stock brokers, financial advisors, investment consultants, and high net-worth individual investors in order to determine the more relevant factors influencing investor behaviour.
The investigation of academic sources for exploring the behavioural factors influencing investor behaviour includes the academic research in areas of financial economics, behavioural finance and psychology. Some of the important works in this regard are done by Kehneman and Tversky (1974), Denial, Hirshleifer and Subrahmanyam (1998), and Barberis, Shleifer and Vishny (1998). E ach of these works develops some specific sort of theoretical model that attempts to identify some psychological biases influencing investor behaviour; these psychological factors had been extrapolated from the experimental psychological studies. The present study considers eight behavioural factors suggested by academic sources. These behavioural factors are Representativeness ( Kehneman and Tversky, 1974; Debondt and Thaller, 1985; Barberis, 2001), Overconfidence (Fischhoff, Solvic and Lichtenstein, 1977; Alpert and Raiffa, 1984; Tversky, 1990; Wood, 1996; Denial, Hirshleifer and Subrahmanyam, 1998; Gervais et al., 2001a, 2001b; Allen and E vans, 2005), Anchoring (Shiller, 1998; Lebaron, 1999; E vans, 2002), Gambler’s Fallacy (Kehneman and Tversky, 1974; Gevaris et al., 2001a), Availability bias (E llsberg, 1961; Kehneman and Tversky, 19731; Thaller, 1994; Barberis, 2001), Loss Aversion (Rothschild and Stiglitz, 1970; Kehneman and Tversky, 1979; Tversky, 1990; Lebaron, 1999; Filbesk et al., 2005), Regret aversion (Shiller, 1998; Lebaron, 1999; Odean, 1999; Statman, 1999; Fogel and Berry, 2006), and Mental Accounting (Thaler and Shefrin, 1981; Shiller, 1998, Tevrsky, 1999; Rockenbach, 2004).
In addition to these eight behavioural factors extrapolated from academic sources, some other factors are also considered in this study; these factors are suggested by the professional and contextual sources which include stock brokers, financial consultants, and investment advisors. These contextual factors that seem to be influencing individual equity investor behaviour are: (a) Market share and reputation of the firm, (b) Accounting and financial information, (c) Publicly available information through various media, (d) Advocate recommendation including that of brokers, family and friends, and (e) Personal financial need.
(i) Survey Instrument– In the questionnaire are included simple and direct questions in order to avoid any confusion on the part of the respondents; each question is based on some specific scenario relating to stock market investing and equity investment decision-making. These scenarios are very much similar to the situations faced by investors while investment decision-making in stock market. Such scenario-based questions help respondents relate themselves to hypothetical situations in stock market and thus, it would be easier to mark their responses. Since, respondents’ orientation may be reflected in their answers, they are asked direct questions covering all the shortlisted behavioural factors. The survey questionnaire consists of four parts, one each for personal information, use of heuristics, use of prospect theory, and impact of other factors on investment decision-making. Personal information segment asks the respondents to give details about their name, age, gender, education, annual income, and annual investment. This information will help the researcher draw some conclusion on the basis of demographic profile of investor respondents. Second segment, i.e.,
the use of heuristics includes questions covering representativeness, overconfidence, anchoring, gambler’s fallacy, and availability biases. While third segment on the use of prospect theory covers loss aversion, regret aversion, and mental accounting biases. Fourth and final segment is based on other contextual factors suggested by professional and contextual sources, and asks the respondents to rate the impact of five such factors on their investment decision-making. These five factors are as discussed above, namely, market share and reputation of the firm, accounting and financial information, publicly available information through various media, advocate recommendation including that of brokers, family and friends, and personal financial needs.
In the survey instrument, personal information segment needs personal and demographic details of the respondents; but next two segments on behavioural factors consist of questions with five-point Likert scale. The study adopted the five-point Likert scale which seems appropriate and ideal for the survey instrument used in the present study. In fact, the sample respondents were given scenario-based questions to which they were asked to mark their response in a range from 1 (least likely) to 5 (most likely). The survey questionnaire was finalised after consulting five experts, three from academics and two from industry professionals. The validity and reliability of the survey questionnaire was tested using appropriate statistical methods (Cronbach’s Alpha in this case).
(iii) Sample and Data– Data were collected via a survey of about 500 individual investors based in Delhi-NCR. The sample was drawn from the clientele of one of the leading stock brokerage houses† which provided the researcher with access the contact details of their client base. The researcher contacted their client and requested them to participate in the study. Out of total, above 350 individual investors agreed to participate in the survey. The questionnaires were then administered to those individual investors through various media as convenient to them. The questionnaires were distributed through personal contacts, surface mails, e-mails, and also through the executives of the participating brokerage house in some cases.
It is hereby important to mention that the present study adopted the convenient sampling techniquein order to collect the survey responses. But the sample was randomly drawn for the purpose of data collection. The choice of this approach can be explained by following three reasons. First, there is a large number of individual investors scattered across the coverage area of the survey carried out by the researcher. It is very difficult to get the exact number of individual investors. Again these investors are using the stock brokerage and investment advisory services from various stock broking agents and other similar firms. Many of the investors may be the client of multiple brokerage houses simultaneously. The researcher, therefore, opted to consult with only one stock brokerage house with significant client base and good market reputation. Second, the contact details of about 500 individual investors were drawn randomly from the pool of its client base. The only criteria laid down for an individual investor to be included in the sample was that he/she must have an annual income of at least Rs. 500,000 at that point of time with a minimum of Rs. 50,000 of investments in equity. The upper cap of the income as well as equity investment was not set by the researcher. Finally, many of the investors while contacted at initial phase with a request to participate in the survey, declined to respond the survey questions. The reluctance by investors could be attributed to the observation that individual investors tend to be sceptical and perceive the financial matters very sensitive; they were reluctant to reveal their investments and other financial matters for the sake of their financial safety. All these factors made the researcher opt for the convenient sampling technique,but all efforts were taken to keep the sample as random as possible by avoiding any sort of biases associated with the data collection task.
Reliability of Survey Instruments: The content validity of the survey instrument i.e. the questionnaire was verified by discussions with five experts, three academicians and two industry professionals, as it is suggested by Devellis (1991). Accordingly the researcher made changes in terms of eliminating, adding, or rewording some of the items included in the questionnaire. The criterion validity and construct validity were tested using correlation analysis. It is widely accepted that to do a orthogonal rotational transformation analysis variables should correlate fairly well, but not perfectly. The table of correlations matrix was scanned to check the pattern of relationships. An examination of the results of correlations suggests that correlations among variables are not statistically significant enough to indicate any problem among variables themselves. In order to test
† The name of the brokerage house which provided with the details of the individual investors for collecting survey
whether there exists any issue relating to correlations among variable, the study used the ‘rule of thumb’ test suggested by Anderson et al. (1990). They suggest that any correlation coefficient that exceeds the value of 0.8 indicates a potential problem among variables. The result of correlations does not show any such problem.
The reliability of the survey instrument was tested with the help of Cronbach’s Alpha method. The Cronbach’s Alpha method allows us to measure the reliability of different categories. It consists of estimates of how much variation in scores of different variables is attributable to chance or random errors (Selltzm, et al., 1976). The Cronbach’s alpha is a measure of internal consistency, that is, how closely related a set of items are as a group. Cronbach’s alpha can be written as a function of the number of test items and the average inter-correlation among the items:
= . ̅
.( −1). ̅
where N is equal to the number of items, is the average inter-item covariance among the items and ̅
̅
equals the average variance.
It can be seen from the above function that if number of items are increased, the Cronbach’s alpha is also increased. Additionally, if the average inter-item correlation is low, alpha will be low. As the average inter-item correlation increases, Cronbach’s alpha increases as well (holding the number of items constant). As a general rule, a coefficient greater than or equal to 0.5 is considered acceptable and a good indication of construct reliability (Nunnally, 1976). The overall Cronbach’s Alpha for the eight categories is 0.902. The Cronbach’s Alpha shows that these categories for survey instruments are valid and reliable. This suggests that scales used in survey instruments are unidimensional.
researcher in one of his earlier studies on the selection behaviour of mutual fund individual investors (Kumar and Chandra, 2009).
The Principal Component Analysis: The purpose of using principal component analysis is to identify the most meaningful bais to re-express a data set, i.e. the survey response from sample individual investors. We expect that this approach will filter out the noise and reveal hidden structure of individual behaviour.
Let X be the original data set, where each column is a single sample of our data set (i.e.~ X). In the present study, X is an m × n matrix where m = 13 and n = 355. Let Y be another m × n matrix related by a linear transformation P. X is the original data set and Y is a new representation of that data set.
PX = Y …..(1) Also let us define the following quantities:
Piare the rows of P
xiare the columns of X (or individual ). Yiare the columns of Y.
E quation 1 represents a change of basis and thus can have many interpretations. 1. Pis a matrix that transforms Xinto Y.
2. Geometrically, Pis a rotation and a stretch which again transforms Xinto Y.
3. The rows of P, {p1, p2, …, pm} , are set of new basis vectors for expressing the columns of X.
The latter interpretation is not obvious but can be seen by writing out the explicit dot products of PX.
= ⋮⋮ [ ⋯ ⋯ ]
=
. ⋯ ⋯ .
⋮ ⋱ ⋮
⋮ ⋱ ⋮
. ⋯ ⋯ .
The form of each column of Ycan be noted as:
= . ⋮ ⋮ .
We recognize that each coefficient of yiis a dot-product of xiwith the corresponding value row in P. in other words, the jthcoefficient of coefficient of yiis a projection on to the j
th
row of P. this is in fact the very form of an equation where yi is a projection on to the basis of {p1, p2, …, pm} .
The individual investor behaviour is influenced by host of factors, but considering all those factors for the purpose of the present study is well beyond the scope and affordability of the researcher. Here, for the purpose of the present study, 13 commonly used factors were taken into account. The factors were presented in the form of 17 scenario-based questions with a five-point Likert scale to collect opinion from sample investors. The principal components analysis was used to reduce the data collected on 17 variables into smaller number of manageable variables by exploring common dimensions existing among the variables.
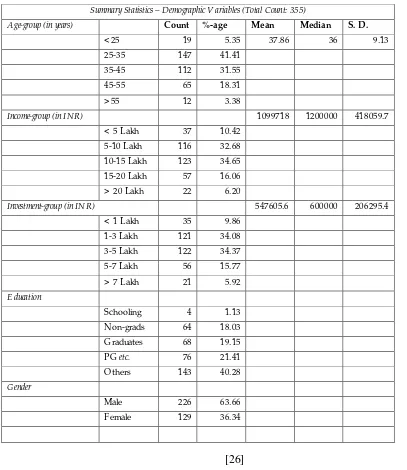
Sample Characteristics: The primary data for the present study consist of the responses from individual investors collected with the help of structured questionnaires. Since this exercise is what the success of the present study is greatly dependent on, the emphasis is on collecting data from diversified group of respondent individual investors. The sample was drawn from the clientele of one of the leading stock brokerage houses which provided the researcher with access to the contact details of their client base. The researcher contacted their clients and requested them to participate in the study. Out of total, more than 350 individual investors agreed to participate in the survey. The questionnaires were then administered to these individual investors through various media as convenient to them. The questionnaires were distributed through personal contacts, mails, e-mails, and also through the executives of the participating brokerage house in some cases.
Survey questionnaire were distributed among about 375 sample individual investors based in Delhi-NCR and 360 responses were received. Out of them, 5 questionnaires were found to be incomplete in some way or other, so, finally 355 responses were used for final analysis. Most of the questionnaires were completed on One-on-one basis. This is why the survey yielded about 95 per cent response rate. Though this is not perfect comparable to the 100 per cent response rate in a study of affluent investors by Capon et al. (1994), but comparable to 98% response rate reported by Al-Tamimi (2005), the 95% response of Chandra (2009), and 80% response in a study of similar stature by Kumar and Chandra (2007).
investors surveyed in the present study were well educated as more than 21 percent had postgraduate education and more than 4o percent were professionally qualified. As far as gender of the respondents is concerned, about 64 per cent of the surveyed investors were male, and remaining 36 per cent of the sample respondents were female. This indicates that female’s participation in investment front is still way below comparable to their male counterparts. This may also be explained by the fact that female investors do not feel comfortable in managing money, though this is not yet statistically proved by any research. This is just an observation. Though Barber and Odean (2001) reported an interesting finding that women are very risk averse while making trading decisions, but men frequently suffle their investment portfolio and make some unwarranted errors, thereby causing monetary losses on their investments.
DISCUSSION AND ANALYSIS
Univariate Analysis
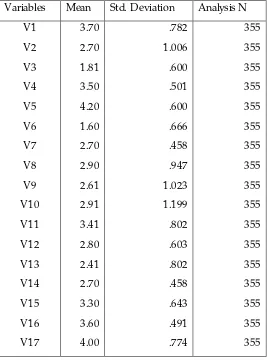
From the summary statistics communicated in the Table 2, the survey data does not remark any typical behaviour that appears significant among Indian individual investor. In fact each variable covered in the survey captures one of the psychological biases identified in the Indian context.
In what follows the researchers look individually for each psychological attitude considered in the survey questionnaire.
Use of Heuristics: Heuristics by definition are the process by which people reach conclusions, usually by what they find for themselves, from available information. This often leads them to develop the thumb rules, but these are not always accurate. These heuristics cause investors commit errors in particular situations. A review of the heuristics identified and tested with the help of the survey questionnaire is certainly helpful in understanding the initial patterns of individual investor behaviour in Indian stock market. A total of five heuristics has been appreciated in the questionnaire by 7 variables. E ach heuristics and its influence on the sample investors will be discussed as following:
E xploring the ‘Representativeness Bias’ Influence: The analysis provides with asymmetric results in respect of the representativeness bias. That is the results show strong evidence for existence of representativeness bias in some aspects and strong evidence for the absence of this psychological bias among Indian individual equity investors. The representativeness bias is appreciated in the questionnaire by V1 and V2. Results show that the sample investors seem to be
E xploring the ‘Overconfidence Bias’ Influence: It is said that investors are vulnerable to the overconfidence barrier. They tend to have too much confidence in the accuracy of their own judgments. As they find out more about a situation, the accuracy of their judgment may well not increase, but their confidence will, as they equate quantity with quality. Confidence also tends to increase if they are given incentives to perform well. When participating investors were asked whether they use their predictive skills deemed to have obtained from their experience from their investment portfolios, in order to time and outperform the market. The overconfidence tendency seems not to be popular among the respondent investors.
E xploring the ‘Anchoring Bias’ Influence:Anchoring heuristics refers to individuals’ tendency to base estimates and decisions on known ‘anchors’ or familiar positions, with an adjustment relative to this starting point. They are better atrelative think ingas compared to absolute think ing. This heuristics is found significantly among individual investors. During the survey of individual investors, they were asked whether their trading was influenced by recent experiences about price in the market, and whether they use the purchase price of stocks as a reference point while making trading decisions. Results indicate that investors are more likely to react in the defined manner and they are very much likely to be influenced by their recent experiences; the trading decisions of about 53.2 per cent sample investors is well influenced by their price experiences in the recent past. Remaining of the investors i.e.46.8 per cent investors were most unlikely to be influenced by past prices while making trading decisions. On the other hand, it is also observed that large portion of surveyed investors were suffering from anchoring bias, as they used their purchase price as a reference point for their trading decisions.
E xploring the ‘Gambler’s F allacy’ E ffect: This heuristics is appreciated in the questionnaire by the variable V6and the results for this variable support the overconfidence bias influence among the
surveyed investors. For the purpose of survey, respondents were asked whether they would be able to anticipate the end of good or poor returns at the stock market. It is worth noticing that this question was specially referring to the anticipation of market returns. This relatively poor score shown in univariate statistics indicates those investors are least likely to anticipate about stock market returns. The frequency statistics also show that only 35.5 per cent of respondents were of view that they could successfully anticipate the market returns whether it would be good or poor at the market index. The value is very much similar to that of the variable capturing the overconfidence bias, where investors were asked whether they could predict the timing to outperform the market. It provides the evidence that less number of investors surveyed were seemingly able to anticipate the market returns.
while individuals taking trading decisions in the markets. Survey results show that sample investors do not hold it good for their investment decision-making. The above-average-score of this factor shows that they are likely to be swayed away by media reports and join the bandwagon. And frequency statistics also support this finding that about 57.7 per cent individual investors seem to be taking their investment/trading decisions on the basis of the readily available information about their choices. This figure leads us to believe that more investors are swayed away by the vividly publicized information about any stock and choose to buy that stock above those with less media attention.
Use of the Prospect Theory: The Prospect Theory is one of the pillars upon which the much of the behavioural economics rests. This theory was proposed by Kahneman and Tversky (1979) while expounding the risk theory. This section captures the evidence of the existence of the psychological biases among the sample investors.
E xploring the ‘Loss Aversion Bias’ Influence: The results of the analysis show the asymmetric evidence for the loss aversion bias. The numbers give strong evidence for investors being risk averse when faced with sure gains and weak evidence for investors being risk takers when faced with sure loss. Investors tend to react to the stock markets under the grip of greed and fear. They become greedy in a bullish market, but become fearful when the market is falling. The results connote that sample investors are likely to be risk averse when faced with sure profits. About 55 per cent of sample respondents seem to become risk averse when they are faced with a sure profit. On the other hand, the variable V9 is appreciated in the questionnaire to capture the risk-seeking nature of
investors. The mean value of this variable is 2.606 (S.D. = 1.023); it provides evidence for the likelihood of risk-seeking attitude when faced with sure loss. Summary statistics shows that only 48.6 per cent of sample respondents seem to be risk-seeking when faced with sure loss. According to these data, the researcher believes that most of the sample investors (about 55 per cent) chose to become risk averse when faced with sure gains, but lesser of them (only 48 per cent around), on the contrary, tend to become risk-seeker in case faced with sure loss.
E xploring the ‘Regret Aversion Bias’ Influence: As per the Prospect Theory, losses are three times more painful as compared to the pleasure experienced by a gain of similar magnitude. What is the reason behind this anomaly? The answer is that people hate regret and losses produce regret. Sometimes, with the sole view of insuring themselves against future losses and subsequent regret, people weigh only the negatives and let the potential of regret influence their decision-making process. The univariate statistics here show some evidence for the influence of this contextual behavioural tendency on Indian individual investors. This behavioural tendency is appreciated in the survey questionnaire by the variables V10 and V11. The variable V10 traduces individual investors’
variable V5: the Anchoring Bias). This view is supported by the data on variable V11 (Mean score =
3.406, S.D. = 0.802). This variable traduces investors’ tendency to book profits on the stocks that have increased in value even if the prospect of its gaining higher value in near future is significant.
E xploring the ‘Mental Accounting Bias’ Influence: The mental accounting error is appreciated in the questionnaire by the variable V12. This variable V12traduces individuals’ tendency to treat each
element in their investment portfolio separately. Sample respondents were asked whether they would treat it as overall loss if two out of ten stocks in their investment portfolio are reduced in their value significantly. The mean score of this variable 2.80 (S.D. = 0.603) indicates that individual investors seem to taking the losses separately, not as overall loss on the entire portfolio. Most of the respondent investors consider loss on stocks separately rather calculating it as loss on the portfolio. Frequency statistics for this variable shows that 64.2 per cent of sample respondents believe that if any stock in their portfolio has depreciated in its value, this loss must be attributed to that asset only and it cannot be adjusted against the value of the entire portfolio. The data from this survey provides strong evidence for mental accounting effect on Indian individual investors. This can be explained by the observation that lack of proper awareness and access to right source of information make them more conservative and hence they get influenced by mental accounting error. Though this trend is not tested by statistics, it is the observation made by the researcher during the survey.
E xploring the ‘Contextual F actors’ Influence: The present study also examines the impact of contextual factors in addition to the psychological factors, on individual investors behaviour. Psychological factors were identified and extracted from psychological experiments and available literature, while contextual factors were taken into account after interactions with industry professionals. They suggested five such contextual factors that seem to be having influence on investor behaviour in stock markets. These contextual factors are: mark et share and reputation of the firm
(V13), accounting and financial information (V14), publically available information through various media (V15),
advocate recommendations including those from brok ers, family and friends(V16), and personal financial needs(V17).
While collecting data through questionnaires, sample respondents were asked to rate the likelihood of impact of these listed factors while making investment/trading decisions. The rating scale for these five factors was five-point Likert scale, 1 being the least likely to influence the decisions and 5 being the most likely to influence their decisions.
available information through various media, personal needs, and advocate recommendations have significant mean scores of 3.299 (S.D. = 0.643), 3.597 (S.D. = 0.491), and 4.000 (S.D. = 0.774) respectively. It can be said that sample investors are giving significant weight to all factors except market share and firm’s reputation, and accounting and financial information.
The observations of five contextual factors’ influence on investor behaviour give asymmetric results wherein investors seem to be giving more importance to some factors than to others. It is seen that personal needs and advocate recommendations are highly rated by investors as compared to market share and accounting information. The results from these observations are not concluding about the significance of the factors influencing investor behaviour in Indian stock market. It is, therefore, important to run more sophisticated analytical methods in order to find a crystal clear picture of factors influencing individual investor behaviour in Indian stock market.
Multivariate Analysis
With an objective to determine the suitability of data for factor analysis, the Kaiser-Meyer-Olkin Measure of Sampling Adequacy (MSA) and the Bartlett’s Test of Sphericity were applied. The Kaiser-Meyer-Olkin (KMO) Measure of Sampling Adequacy is a statistic that indicates the proportion of variance in the variables that might be caused by the reduced factors. Kaiser (1974) recommends that a bare minimum of 0.5 and that values between0.5 and 0.7 are mediocre, values between 0.7 and 0.8 are good, values between 0.8 and 0.9 are great and values above 0.9 are superb (See Hutcheson & Sofroniou, 1999, pp. 224-225). The results from these tests are given in Table 3:
Table 3: KMO and Bartlett’s Tests Kaiser-Meyer-Olkin Measure of Sampling
Adequacy
0.932
Bartlett’s Test of Sphericity
Approx. Chi-Square 13292.550
df 136.000
Sig. 0.000
High value of KMO (0.932) indicates that a factor analysis is quite useful for the data being used in this study. The KMO figures provide strong evidence for sampling adequacy for these data. Similarly, the significant value for Bartlett’s test of sphericity is 0.000 which indicates that there exist significant relationships among variables. The output of KMO and Bartlett’s tests supports the view that factor analysis is very much useful for the present data.
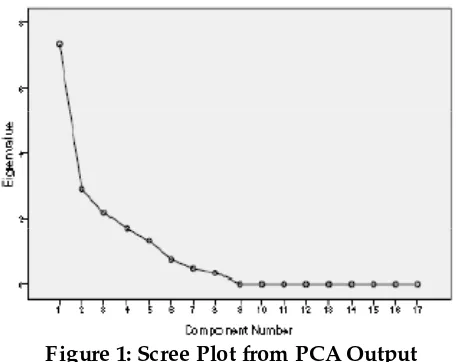
Determining the Number of Meaningful Components to Retain: The PCA approach suggests that the number of components extracted is equal to the number of variables being analyzed, necessitating that it is to be decided just how many of these components are truly meaningful and worthy of being retained for rotation and interpretation. In general, it is expected that only the first few components will account for meaningful amounts of variance, and that the later components will tend to account for only trivial variance. The next step of the analysis is, therefore, to determine how many meaningful components should be retained for interpretation. Among others, following three criteria may be used for the purpose (Cattell, 1966, Stevens, 1986): the eigen value-one criterion, the scree test, and the proportion of variance accounted for. First, in the Principal Components Analysis, the eigen value-one criterion, also known as the Kaiser criterion is one of the most commonly used criteria for solving the number-of-components problem. With this approach, any component with an eigen value greater than 1.00 is retained for rotation and interpretation. Second, with the scree test (Cattell, 1966), the eigen values associated with each component are plotted and observed for a “break” between the components with relatively large eigen value and those with small eigen values. The components that appear beforethe break are assumed to be meaningful and are retained for rotation; those appearing afterthe break are assumed to be unimportant and are not retained. A third criterion in solving the number-of-factors problem involves retaining a component if it accounts for a specified proportion (or percentage) of variance in the data set. An alternative criterion is to retain enough components so that the cumulative percent of variance accounted for is equal to some significant value. When the ‘cumulative percent of variance accounted for’ is used as a criterion for solving the number-of-components problem, it is suggested to retain enough components so that the cumulative percent of variance accounted for at least 70% (and sometimes 80%).
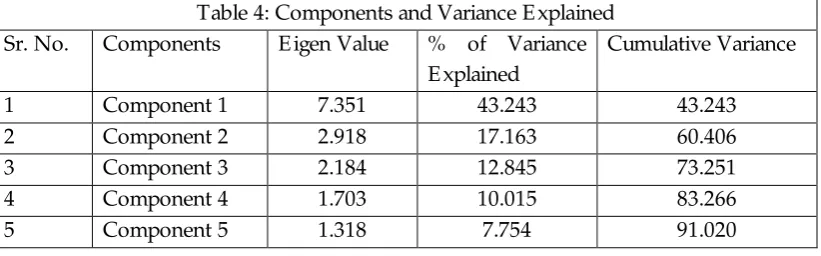
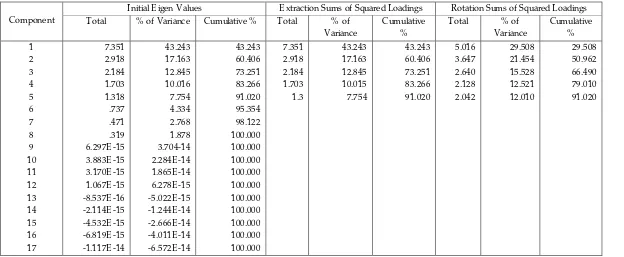
Following the above mentioned criteria for solving the number-of-components problem in this study, the components matrix is formed for further orthogonal rotation using Varimax rotation algorithm which is standard rotation method (Kaiser, 1958). The multivariate analysis extracts obviously 17 behavioural components, but only five components were retained for rotation and interpretation, as these five components were judged sufficient to explain the significant data variance and also qualified the above mentioned criteria for solving the number-of-components problem. In fact, all the five components so selected seem to explain above 91% of total data
[image:20.595.95.506.575.703.2]variance, and the remaining variance is explained by other variables as given in Table 4: Table 4: Components and Variance E xplained
Sr. No. Components E igen Value % of Variance E xplained
Cumulative Variance
1 Component 1 7.351 43.243 43.243
2 Component 2 2.918 17.163 60.406
3 Component 3 2.184 12.845 73.251
4 Component 4 1.703 10.015 83.266
An observation of the table above provides an insight that only these five components extracted from the Principal Components Analysis are significant enough to retain for rotation and further interpretation as all these components qualified the criteria of the eigen value-one, the variance accounted for (or the cumulative variance above 80%), and also the scree plot break. As can be seen, the variance proportion explained begins to decrease from sixth component onward (figure 1). Moreover, the correlation coefficients of these pertinent five factors or components with the initial variables are higher than 0.5.
F igure 1: Scree Plot from PCA Output
E ach of the principal components selected for rotation and interpretation are given a suitable label based on the statements loaded under each component. To interpret and to give a title to each behavioural factor/component, the initial variables’ definitions were examined carefully along with their respective correlations with the concerned factors. Then only, a common interpretation for each variable was arrived at for further rotation and interpretation.
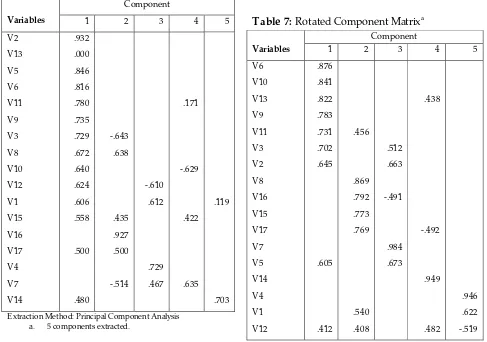
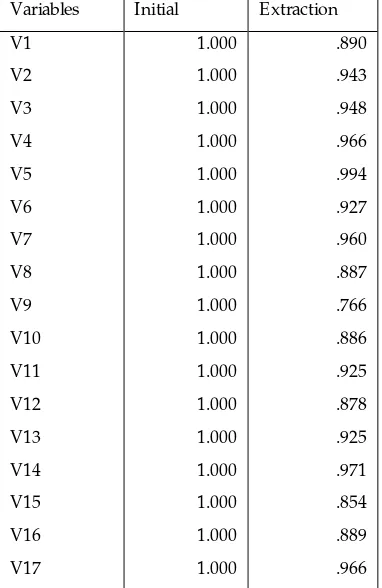
The Behavioural Factors Defined: According to the extracted coefficients these five pertinent behavioural components were named as follows: prudence and precaution attitude, conservatism, under confidence, informational asymmetry, and financial addiction. The total variance accounted for, by all the five factors with eigen value greater than 1 is 91.02% which sufficiently significant, and the remaining variance is explained by the other variables. Among the five factors, the first factor accounts for around 43.24% of variance which is the prime factor influencing investment behaviour of any Indian individual investor. The detailed values obtained from the PCA tests for these five factors with labels, factor loadings and communalities for various statements included as variables are given in the Tables 5-10.
[Insert Tables]
[image:21.595.182.410.214.395.2]Prudence and Precaution Attitude: The first component is prudence and precaution attitude as the statements or variables included under this component are related to it. This component is an important factor because it accounts for more than 43% of data variance. E ven after rotation, this component represented by these variables accounts for 29.5% of data variance
.
E ach variable included under this factor is associated with a different kind of behavioural attitude. These variables underline the symmetric behavioural attitude of risk aversion and calculated trading decisions. So, in summary this behavioural factor traduces the prudent and cautious attitude of Indian individual investors in the stock market. In fact the Indian individual investors tend to use trend analysis for their trading decisions. Their decisions are also based on the firm’s market share and reputation; but they also tend to use their purchase price as reference point (which provides sufficient evidence for the existence of the prospect theory). Although they showed risk seeking attitude in certain loss-making circumstances, they tend not to hesitate in profit booking whenever such opportunities arise. In certain instances, they would prefer to retain the losers in their portfolios. This prudence attitude shown by the surveyed investors may be justified by an excess risk aversion and insufficient familiarization with the stock market which might frighten them at times.Conservatism: According to the multivariate analysis results, the sample investors seem to be conservative rather than adaptive. This behavioural component accounts for about 17.16% of data variance explained. The rotation sums of squared loadings show that this component accounts for about 21.45% of data variance after orthogonal rotation of component matrix. It is, therefore, evident that this component is second most influential factor/component in case of Indian individual investor behaviour in stock market. The underlying variables underline the investor behavioural tendency to be attached to the past data and/or events and also the traditional approaches to take trading decisions by a layman investor. Investors under the influence of this behavioural factor/component tend to be risk averse most of the time, and derive their trading decisions based on what is recommended by their acquaintances and their past trading experiences in the market. One of the factors which affect them is their personal financial needs. Results indicate that they are not confident enough to time and outperform the market using their predictive skills and they rarely bother about the colourful stocks (i.e. the stock which are much talked-about and presented with flying colours in the investment circle). So, Indian individual investors seem to be significantly influenced by the conservatism psychological bias.
also considered as ‘hot stock’, rather objectively evaluating the alternative. So, under confidence affects their trading decisions to the extent that they change easily their positions and quickly revise their decisions as soon as they see any new ‘hot stock’; this reflect their under confidence in their own decisions and ability. It can, therefore, be said that individual investors in India are influence by the under confidence psychological bias.
Informational Asymmetry: The next important component derived from the multivariate analysis is named as informational asymmetry. This component explains the asymmetric pattern of distribution and usage of information among the sample investors. The component accounts for about 10% of data variance before rotation and about 12.5% of data variance after Varimax rotation of variables. The set of variables explaining this component leads to infer that individual investors are suffered from informational inferiority complex. They tend to rely heavily on the easily available and accessible information. They are influenced by the information hovering around them and which can be easily used by investors for their decisions; rather they don’t tend to check the reliability of the information and prefer to those piece of information which are easy to incorporate into their decisions. Instead of incorporating all the publically available information as suggested by the standard definition of market efficiency theory, investors tend to discount the information that seems complex to incorporate into their decision-making process, and adopts only those easily available and adjustable. They don’t practice information mapping whereby information is classified according to the sources and their reliability, and then being considered for decision-making on top-down basis. Though Indian individual investors are seen using different sources for their informational needs, they lack the objectivity in rationally using the appropriate ones. So, they are influenced by the informational asymmetry psychological bias.
SUMMARY & CONCLUSION
In the present paper, principal components analysis is carried out on the data collected from survey of sample individual investors, to extract the factors influencing Indian individual investor behaviour in stock market. E specially the psychological biases which may drive their trading behaviour were identified. The paper started with the twin objectives of identification and verification of the psychological biases considered to drive a momentum effect by influencing investor behaviour in stock market.
In fact a wide array of behavioural financial literature was scanned in order to extrapolate the psychological and contextual factors influencing individual investor trading behaviour. The results and conclusions resorted from the behavioural financial literature and noted psychologists’ experiments as well as from the discussions with stock market practitioners provided with thirteen psychological and contextual biases captured by seventeen variables. Then it tried to explore the investor trading behaviour by directly addressing to the investor. To fulfill this objective the questionnaire technique was used. The questionnaire comprised of scenario based questions relating to all psychological and contextual biases.
References
1. Al-Tamimi, Hussein A Hassan (2005), Factors Influencing Individual Investor Behaviour: An E mpirical Study of the UAE Financial Markets, University of Sharjah work ing paper.
2. Andrade, Sandro C., Charles Chang, and Mark S. Seasholes (2005), Trading shocks, assets prices, and the limits of arbitrage, University of California, Berk eley Work ing paper.
3. Barber, Brad M., and Terrance Odean, (2000), Trading is hazardous to your wealth: The common stock investment performance of individual investors,Journal of Finance55, 773-806. 4. Barber, Brad M. and Terrance Odean (2001), Boys will be Boys: Gender, Overconfidence,
and Common Stock Investment, Quarterly journal of E conomics,Vol.116, pp. 261-292.
5. Barber, Brda M., and Terrance Odean (2005), All the glitters: The effect of attention and news on the buying behaviour of individual and institutional investors, University of California, Davis Work ing paper.
6. Barber, Brad M., Yi-Tsung Lee, Yu-Jane Liu, and Terrance Odean (2005), Who loses from trade? E vidence from Taiwan, University of California, Davis Work ing paper.
7. Brown, G.W. and Michael T. Cliff (2004), “Investors Sentiment and the Near-term Stock Market”, Journal of E mpirical Finance, Vol. 11, pp. 1-27.
8. Capon, Noel, Gavan J. Fitzsimons, and Rick Weingarten (1994), Affluent Investors and Mutual Fund Purchase, International Journal of Bank Mark eting, Vol. 12, No. 3, pp.17-25.
9. Cattell, R.B. (1966), The Scree Test for the Number of Factors, Multivariate Behavioural Research, Issue 1, pp. 245-276.
10. Chandra, Abhijeet (2009), Individual Investor Trading Behaviour and the Competence E ffect, The ICFA I Journal of Behavioural Finance,Vol.VI, No.1, pp.56-70.
11. Choe, Hyuk, Bong-Chan Kho, and Rene M. Stulz (1999), Do foreign investors destabilize stock returns: Theory and evidence, Journal of Financial E conomics,72, 485-518.
12. Coval, Joshua D., David A. Hirshleifer, and Tyler Shumway (2002), Can individual investors beat the market? Harvard University Work ing paper.
13. Develis, Robert F. (1991). Scale Development: Theory and Applications, Sage Publications California.
14. E pstein, M.J. (1994) “Social Disclosure and the Individual Investor”, A ccounting, A uditing and A ccountability Journal, Vol. 4, pp. 94-109.
15. Fisher, Kenneth L., and Meir Statman (2000), “Investor Sentiment and Stock returns”,
A ssociation for Investment Management and Research, pp. 16-23.
16. Fischer, Rene, and Ralf Gerhardt (2007), “Investment Mistakes of Individual Investors and the impact of Financial Advice”, E uropean Business School Work ing Paper.
17. Graham, John R., Harvey Campbell R. and Huang Hai (2004), Investor Competence, Trading Frequency and Home Bias, Duk e University work ing paper.
18. Griffin, John M., Jeffery H. Harris, and Selim Topaloglu (2003), The dynamics of institutional and individual trading, Journal of Finance,58, 2285-2320.
20. Hodge, F. D. (2003), “Investors’ Perceptions of E arnings Quality, Auditor Independence, and the Usefulness of Audited Financial Information”, A ccounting Horizons, Vol. 17, pp. 37-48.
21. Hvidkjaer, Soeren (2005), Small trades ad the cross-section of returns, Working paper, University of Maryland.
22. Jackson, Andrew (2003), The aggregate behaviour of individual investors, L ondon Business School work ing paper.
23. Kadiyala, P. and R Rau (2004), “Investor Reaction to Corporate E vent Announcements: Underreaction or Overreaction?” Journal of Business, Vol. 77, pp. 357-386.
24.
H.F. Kaiser (1958): "The varimax criterion for analytic rotation in factor
analysis."
Psychometrik a23: 187–200.
25. Kehneman, Denial and Amos Tversky (1973), Availability: A Heuristics for Judging Frequency and Probability, Cognitive Psychology, 5, 207-232.
26. Kanhneman, Daniel and Amos Tversky (1979), Prospect Theory: An Analysis of Decision Under Risk, E conometrica, March 1979.
27. Kim, K.A., and John R. Nofsinger (2003), “The Behaviour and Performance of Individual Investors in Japan”,
28. Krishnan, R. and D. M. Brooker (2002), “Investors Use of Analysts’ Recommendations”,
Behavioural Research in A ccounting, Vol. 14, pp. 129-158.
29. Kumar, Ravinder and Abhijeet Chandra (2007), Individual Investor Sentiment and Asset Pricing, Synergy – the Journal of Management, Vol.9, no.2, pp.1-10.
30. Kumar, Ravinder and Abhijeet Chandra (2009), Selection Behaviour of Individual Investors: E vidence from Mutual Fund Investment, Proceedings of the International Finance Conference, IIM Calcutta, 3-5 December 2009.
31. Lim, Sonya Seongyeon (2004), “Do Investors Integrate Losses and Segregate Gains? Mental Accounting and Investors Trading Decisions” DePaul University Work ing paper.
32. Malmendier, Ulrike, and D. Shanthikumar (2003) “Are Small Investors Naïve?”, Stanford University Work ing Paper.
33. Merikas, A. and D. Prasad (2003), “Factors Influencing Greek Investor Behaviour on the Athens Stock E xchange”, paper presented at the A nnual Meeting of the A cademy of Financial Services, Denver (Colorado, USA), October 2003.
34. Nagy, R. A. and R. W. Obenberger (1994) “Factors Influencing Investors Behaviour”,
Financial A nalyst Journal, Vol. 50, pp. 63-68.
35. Nunnally, C. J. (1976), Psychometric Theory, McGraw Hill New York .
36. Odean, Terrance (1998), Are investors reluctant to realize their losses? Journal of Finance, 53, 1775-1798.
37. Odean, Terrance (1999), Do investors trade too much? A merican E conomic Review, 89, 1279-1298.
39. San, Granit (2005), Who gains more by trading – individuals or institutions? Working paper, Tel Aviv University.
40. Selltiz, C., L.S. Wrightsman and W. Cook (1976), Research Methods in Social Relations¸
Holt, Rinehart and Winston, New York.
41. Shlens, Jonathon (2009). A tutorial on principal components analysis. (http://www.snl.salk.edu/~ shlens/pca.pdf accecced on February 14, 2011.)
42. Stevens, J. (1986), A pplied Multivariate Statistics for the Social Sciences, Hillsdale, NJ: Lawrence E rlbaum Associates.
[image:27.595.63.470.292.762.2]43. Zoghalami, Faten, and Hamadi Matoussi (2009), A Survey of Tunisian Investors,International Research Journal of Finance and E conomics, Issue 31, pp. 66-81.
Table 1: Summary Statistics of Survey Respondents
Summary Statistics – Demographic V ariables (Total Count: 355)
A ge-group (in years) Count %-age Mean Median S. D.
< 25 19 5.35 37.86 36 9.13 25-35 147 41.41
35-45 112 31.55 45-55 65 18.31 > 55 12 3.38
Income-group (in INR) 1099718 1200000 418059.7
< 5 Lakh 37 10.42 5-10 Lakh 116 32.68 10-15 Lakh 123 34.65 15-20 Lakh 57 16.06 > 20 Lakh 22 6.20
Investment-group (in INR) 547605.6 600000 206295.4
< 1 Lakh 35 9.86 1-3 Lakh 121 34.08 3-5 Lakh 122 34.37 5-7 Lakh 56 15.77 > 7 Lakh 21 5.92
E ducation
Schooling 4 1.13 Non-grads 64 18.03 Graduates 68 19.15 PG etc. 76 21.41 Others 143 40.28
Gender
Table 2: Descriptive Statistics
Variables Mean Std. Deviation Analysis N
V1
V2
V3
V4
V5
V6
V7
V8
V9
V10
V11
V12
V13
V14
V15
V16
V17
3.70
2.70
1.81
3.50
4.20
1.60
2.70
2.90
2.61
2.91
3.41
2.80
2.41
2.70
3.30
3.60
4.00
.782
1.006
.600
.501
.600
.666
.458
.947
1.023
1.199
.802
.603
.802
.458
.643
.491
.774
355
355
355
355
355
355
355
355
355
355
355
355
355
355
355
355
Table 5: Total Variance E xplained
Component
Initial E igen Values E xtraction Sums of Squared Loadings Rotation Sums of Squared Loadings Total % of Variance Cumulative % Total % of
Variance
Cumulative %
Total % of Variance Cumulative % 1 2 3 4 5 6 7 8 9 10 11 12 13 14 15 16 17 7.351 2.918 2.184 1.703 1.318 .737 .471 .319 6.297E -15 3.883E -15 3.170E -15 1.067E -15 -8.537E -16 -2.114E -15 -4.532E -15 -6.819E -15 -1.117E -14 43.243 17.163 12.845 10.016 7.754 4.334 2.768 1.878 3.704-14 2.284E -14 1.865E -14 6.278E -15 -5.022E -15 -1.244E -14 -2.666E -14 -4.011E -14 -6.572E -14 43.243 60.406 73.251 83.266 91.020 95.354 98.122 100.000 100.000 100.000 100.000 100.000 100.000 100.000 100.000 100.000 100.000 7.351 2.918 2.184 1.703 1.3 43.243 17.163 12.845 10.015 7.754 43.243 60.406 73.251 83.266 91.020 5.016 3.647 2.640 2.128 2.042 29.508 21.454 15.528 12.521 12.010 29.508 50.962 66.490 79.010 91.020
Table 6: Component Matrixa
Variables
Component
1 2 3 4 5
V2 V13 V5 V6 V11 V9 V3 V8 V10 V12 V1 V15 V16 V17 V4 V7 V14 .932 .000 .846 .816 .780 .735 .729 .672 .640 .624 .606 .558 .500 .480 -.643 .638 .435 .927 .500 -.514 -.610 .612 .729 .467 .171 -.629 .422 .635 .119 .703
[image:30.595.63.550.121.463.2]E xtraction Method: Principal Component Analysis a. 5 components extracted.
Table 7: Rotated Component Matrixa
Variables
Component
1 2 3 4 5
V6 V10 V13 V9 V11 V3 V2 V8 V16 V15 V17 V7 V5 V14 V4 V1 V12 .876 .841 .822 .783 .731 .702 .645 .605 .412 .456 .869 .792 .773 .769 .540 .408 .512 .663 -.491 .984 .673 .438 -.492 .949 .482 .946 .622 -.519