Munich Personal RePEc Archive
Provision of renewable energy using
green certificates: market power and
price limits
Amundsen, Eirik S. and Nese, Gjermund
Department of Economics - University of Bergen
2002
W
ORKING
P
APERS IN
E
CONOMICS
No. 25/02
E
IRIK
S. A
MUNDSEN
AND
G
JERMUND
N
ESE
P
ROVISION
OF
R
ENEWABLE
E
NERGY
U
SING
G
REEN
C
ERTIFICATES
: M
ARKET
P
OWER
AND
P
RICE
L
IMITS
D
epartment of
E
conomics
________________________
Provision of Renewable Energy using Green
Certi
fi
cates: Market Power and Price Limits
∗
Eirik S. Amundsen
†and Gjermund Nese
‡December 19, 2002
Abstract
We formulate an analytic equilibrium model for simultaneously func-tioning electricity market and a market for Green Certificates. The major focus of the paper is the effect of market power in a Green Certificate system. One of the main results from the analysis is that the certificate system faced with market power basically may collapse into a system of per unit subsidies.
1
Introduction
Many countries have adopted the goal to enhance the role of renewable sources in energy supply. It is, for example, a stated goal by the EU to raise the share of electricity based on renewable generation sources from 14 to 22% of total electricity generation by 2010 (see EU/COM (2000)).1 Typically, in order to
promote the generation of green electricity, the relative cost disadvantage of en-vironmentally friendly electricity generation technologies has been compensated by the national authorities through different kinds of subsidy schemes. One ex-ample is thefixed-price system used in e.g. Spain and Germany, in which the producers of green electricity get a specifiedfixed price per unit of their electric-ity, independent of the quantity they generate. Other subsidy alternatives are investment subsidies and tax reductions for producers of green electricity. The
∗Financial support from the Nordic Energy Research (SNF-Projects No. 3156/3157), and
the Research Council of Norway: the Research Foundation/SAMSTEMT (SNF-Projects No. 3082/3135 and RCN-Project No. 138903/730 and No. 145734/730) is gratefully acknowledged. The authors want to thank Jørgen Birk Morthensen, University of Copenhagen, for valuable comments. The paper has also benefitted from a presentation at the Department of Economics, University of Copenhagen. The usual disclaimer applies.
†Department of Economics, the University of Bergen, Fosswinckelsgt. 6, N-5007 Bergen,
Norway. Tel.: +47 55 58 92 05, Fax: +47 55 58 92 10, e-mail: eirik.amundsen@econ.uib.no
‡Institute for Research in Economics and Business Administration (SNF), Breiviksveien
40, N-5045 Bergen, Norway. Tel.: +47 55 95 95 21, Fax: +47 55 95 94 39, e-mail: gjer-mund.nese@snf.no
1
liberalization of the electricity markets has, however, induced an extra challenge on the countries in their choice of policy measures to promote the provision of green electricity, as the means must be in accordance with market principles. One idea which has been adopted as a possible alternative in many countries is the introduction of a market for Green Certificates (from this point referred to as GCs). The Netherlands has already, since 1998, used a system of ”green labelling”, which is a voluntary version of the GC-system. Sweden and Den-mark are examples of countries that are close to actually introducing a Den-market for GCs, as it is the intention of both the Swedish and the Danish authorities to have GC systems fully effective by 2003. It seems likely that in the long run all the Member States will support a common EU standard for the markets for GCs. In addition to the EU Member States, countries like Australia, China, India and the US are also considering the introduction of GCs. Despite its popularity, it seems fair to say that the general functioning of the GC market has not yet been fully understood. However, research contributions have been made by e.g. Voogt et al. (1999), Morthorst (2000 and 2001), Amundsen and Mortensen (2001, 2002), Bye et al. (2002) and Jensen and Skytte (2002).
In short, the GC market consists of sellers and buyers of certificates. The sellers are the producers of electricity using renewable sources. The producers are each allowed to sell an amount of certificates corresponding to the electricity they feed into the electricity network. The purchasers of certificates are con-sumers/distribution companies that are required by the government to hold a certain percentage of certificates corresponding to their total consumption/end-use deliveries of electricity.2 The GCs are seen as permits for consuming
elec-tricity. Hence, this system implies that the producers using renewable energy sources receive both the wholesale price and a certificate for each kWh fed into the electricity network. In this way the GC system is supposed to induce new investments in green electricity generation. An additional indirect effect of in-creasing the provision of green electricity will be to reduceCO2 emission if the
development of renewable energy technologies is substituting energy production from fossil fuelfired plants.
In the following we formulate an analytic equilibrium model for a GC sys-tem. A basic assumption in the model is that the ”percentage requirement” for the possession of certificates of consumers/distribution companies functions as a check on total electricity consumption, as the total number of certificates avail-able are constrained by the total capacity of renewavail-able technologies.3 Hence, a requirement of e.g. 20% implies that total consumption can be no larger than
five times the electricity produced from renewable sources, unless the price of certificates tends to increase above an upper price bound specified by the au-thorities. This price bound, which is used in most of the proposed GC systems, functions as a penalty which the consumers must pay if they don’t fulfil the
2
Italy is an exception in this respect as the Italian system is supposed to put the purchase obligation on the producers.
3
percentage requirement, i.e. to be allowed to consume more electricity thanfive times the amount of certificates they have bought. In the model we also repre-sent a lower price bound for the certificate price. This price bound is relevant in case the production of green electricity exceeds the demand for certificates. If this is the case, the State will buy the excess supply of certificates at a price corresponding to the lower price bound. Not all the countries considering the introduction of a GC system will include a minimum price of the certificates, but the proposed Danish GC system is using such a lower price bound. We will concentrate on the analysis of the market itself and do not in this setting ad-dress the question of whether such a system is economically sound as compared with other alternatives of stimulating the generation of green electricity. Fur-thermore, we do not consider any uncertainty orfinancial markets for forwards or futures trade in certificates, nor do we consider an international system with trade of GCs.
The major focus of this paper is the effect of market power in a GC system. We will use our model to characterize the equilibrium conditions for various levels of competition in the electricity and the GC markets. We will start by assuming perfect competition in both the electricity and the GC markets and thereafter go through the three cases of market power in either one or both of the markets. In addition we look at a case with a monopolistic company that controls both generation technologies. Throughout the paper we assume Nash-Cournot (NC-) behavior.4 As will be shown, the GC system does not always
produce straight forward results. It turns out that the existence of market power to a large extent will drive the certificate price to either the lower or the upper price bound and thereby reduce the GC system to a system of direct subsidies financed through excise taxes. As market power is likely to exist in many cases, this is a result that should be given serious consideration in the discussions and development of alternative GC systems. In our analysis we focus particularly on the generation of green electricity under different assumptions of competition in the markets. One interesting result from this analysis is that market power in the generation of black electricity can actually promote an increase in the generation of green electricity as compared with the result under perfect competition. Among the other surprising results are that an increase in the percentage requirement, and an introduction of aCO2tax on the producers
of black electricity in combination with a GC system, actually both can have the effect as to reduce the generation of green electricity.
Thefirst section of the paper presents the model. The next section presents and analyses the equilibrium in the case of perfect competition in both the electricity and the GC market. Thereafter follows the cases of market power in the generation of black electricity, market power in the generation of green electricity, market power in both generation technologies, and market power in the joint generation of green and black electricity. In section 8 we introduce
4
aCO2 tax on the producers of black electricity and analyze the effects on the
generation of green and black electricity. Finally, the last section summarizes and concludes.
2
The model
The following model is designed to capture a long run situation for the simul-taneous functioning electricity market and a market for GCs.5 We will use the
following list of variables:
p= consumer price of electricity
s= price of GCs
s= upper price bound of GCs
s= lower price bound of GCs
q= wholesale price of electricity
x= total consumption of electricity
y = generation of black electricity
z = generation of green electricity
α= percentage of green electricity consumption
gd = demand for GCs t=CO2 tax
We apply the following general functions: The inverse demand function is:
p(x), with ∂p(x)
∂x =p
0<0.
The cost function for the producers of black electricity is assumed given by:
c=c(y), withc0(y)>0 andc00(y)>0.
The rationale for choosing an increasing long run marginal cost function for this industry, is that the expansion of output may drive up the price of
CO2-emission permits orCO2-taxes to comply with nationalCO2-emission
con-straints. The cost function for the producers of green electricity is assumed given by:
h(z), withh0(z)>0 andh00(z)>0.
The rationale for choosing an increasing long run marginal cost function for this industry is that good sites for wind-mills may be in scarce supply by nature. The two groups of producers deliver electricity to a common wholesale mar-ket, from where distribution companies purchase electricity for end-use deliver-ies. The distribution companies are assumed to act as profit maximizers.
In the model we have two markets, one market for electricity and one market for GCs. As we work our way through the different market structures we will apply the subscriptscand m to the endogenous variables in order to indicate
5
whether the markets are competitive, or if there is market power involved in one or both of the generation technologies. The first subscript will correspond to the market structure among the producers of black electricity, while the second subscript is used to describe the market structure in the generation of green electricity. qcc will thus refer to the wholesale price of electricity in the case of perfect competition among both kinds of electricity producers. In the case of market power in the generation of black electricity and perfect competition among the producers of green electricity, the variable for the wholesale price will beqmc, and so on. In addition we will use the subscriptM for the case where
we consider market power in the joint generation of black and green electricity. We start by considering a market with perfect competition all around.
3
Perfect competition
For the case of perfect competition in both markets all the profit maximizing market participants are price takers. In order to simplify the presentation we are suppressing the subscripts concerning the market structure at this point. The producers of black electricity act as if they jointly maximize:
M axΠ(y) =qy−c(y) .
Thefirst order condition for an optimum in the competitive market is:
q∗=c0(y) .
For each unit of green electricity generated there will be issued one certificate. The producers of green electricity will sell all their certificates and will thus earn the wholesale price plus the GC-price per unit of electricity they generate.6
Jointly they act as to maximize:
M axΠ(z) = [q+s]z−h(z) . Thefirst order condition is:
q+s=h0(z).
For each unit of electricity bought and sold to the end users the distribution companies will have to pay the wholesale price plus a proportionαof the cer-tificate price in accordance with the percentage requirement. The distribution companies are throughout the article assumed not to enjoy any market power. Hence, jointly they act as to maximize:
M axΠ(x) =px−[q+αs]x.
6
Thefirst order condition is:
p=q+αs. In the market for GCs the demand is given by:
gd =αx.
3.1
cc-equilibrium
Given the objective functions and thefirst order conditions we can specify the equilibrium for the competitive markets. The key variables used in the analysis are the equilibrium price, generated quantities of black and green electricity and total consumption of electricity. These will depend on whether the price of GCs in equilibrium,s∗, is within the specified price interval, i.e. s < s∗ < s, or on either the upper or lower price bound. As long as the price of GCs is within the interval, total consumption of electricity is given byx= zα∗. This quantity constraint implied by the percentage requirement is sometimes referred to as the allowable consumption level. In the case ofs∗ =s, the demand for GCs is less
thanz∗, and there is an excess supply of GCs. It is assumed (as in the Danish
GC-proposal) that the State guarantees to buy the otherwise unsold certificates at a price equal tos. This means that total electricity consumption is decreasing compared with the preceding case. If the price of GCs in equilibrium turns out to be equal to the upper price bound, s, demand for certificates exceeds the maximum possible supply. In this case the consumers are allowed to buy more black electricity if they pay a ”fine” equal to s per unit of extra electricity consumption. Including now the subscripts for market form, and assuming thatc0(ycc∗) andh0(zcc∗) are representing the aggregate marginal cost functions, we have the following result for the key variables in equilibrium under perfect competition:
• For the case ofs < s∗cc< s
p(x∗cc) =q∗cc+αs∗cc (1)
x∗cc=ycc∗ +z∗cc= z∗cc
α (2)
q∗cc+s∗cc=h0(zcc∗) (3)
• For the case ofs∗cc=s
p(x∗cc) =qcc∗ +αs (5)
x∗cc=y∗cc+zcc∗ > z∗cc
α (6)
qcc∗ +s=h0(z∗cc) (7)
qcc∗ =c0(ycc∗) (8)
• For the case ofs∗cc=s
p(x∗cc) =qcc∗ +αs (9)
x∗cc=y∗cc+zcc∗ < z∗cc
α (10)
qcc∗ +s=h0(z∗cc) (11)
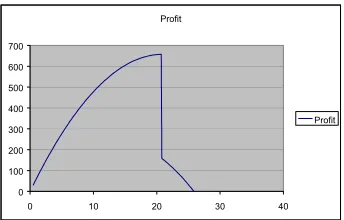
qcc∗ =c0(ycc∗) (12) The cc-equilibrium solution is illustrated for the case of s < s∗cc < s in Figure1. The quantity constraint implied by the percentage requirement is seen to drive a wedge equal toαs∗cc between the electricity price and the marginal cost of electricity generation. The system thus involves a transfer of consumer-and producer surplus from black electricity generation to a subsidy of green electricity generation.
3.2
Analysis
In the proposed GC-systems, the ”percentage requirement” is perceived as a policy instrument affecting the level of green electricity in end use consumption. Unlike price-fixation (that leaves quantity an endogenous variable) or quantity
fixation (that leaves price an endogenous variable) the ”percentage requirement” neitherfixes price nor quantity and thus leaves both variables to be endogenously determined. The following proposition shows that it is not in general true that an increase of the ”percentage requirement” leads to an increased generation of green electricity in equilibrium. It does, however, lead to a reduced generation of black electricity, and therefore - from (4), (8) or (12) - a reduced wholesale price of electricity. As the effect on green electricity is indeterminate, the effect on total consumption and end user price is also indeterminate.7
Proposition 1 Under perfect competition in the electricity and the certificate
markets, the ”percentage requirement”, α, has the following effects: i) if s < s∗
cc < s, then dy
∗ cc
dα < 0 while sign
³dz∗ cc
dα
´
and sign³dx∗cc
dα
´
are indeterminate,
andii)if s∗cc=sor s∗cc=s, then dz∗cc
dα <0,
dy∗cc
dα <0,
dx∗cc
dα <0.
Proof. i) Inserting (3) and (4) into (1) yields the electricity price as a
linear combination of marginal costs of the two groups of generation technolo-gies in equilibrium, i.e. p(x∗cc) = (1−α)c0(y∗cc) +αh0(z∗cc). Take the im-plicit derivatives of this expression with respect to α and arrive at: dzcc∗
dα = αs∗
cc+x∗cc
h
(∂p/∂x)−(1−α)c00(y∗ cc)
i
D ,
dy∗ cc
dα =
(1−α)s∗ cc+x∗cc
h
αh00(z∗
cc)−(∂p/∂x)
i
D , and
dx∗ cc
dα =
s∗cc+x∗cc
h
αh00(z∗cc)−(1−α)c
00
(y∗cc)
i
D , withD=
h∂p
∂x−(1−α)
2c00
(ycc∗)−α2h00
(zcc∗)i<
0. Inspection of signs verifies the above claims.
ii) Insert (8) in (7) or (12) in (11). Take the implicit derivative with re-spect to αand get h00(z∗
cc)dz
∗ cc
dα =c 00
(y∗
cc)dy
∗ cc
dα . As marginal costs are assumed
increasing it follows: signdz∗cc
dα = sign
dy∗cc
dα = sign
dx∗cc
dα . The last equality
fol-lows as dx∗cc
dα =
dz∗ cc
dα +
dy∗ cc
dα . But the signs cannot be non-negative. To see this
insert (8) in (5) and take the implicit derivative with respect to α to obtain
∂p
∂x
dx∗cc
dα =c 00
(y∗
cc)dy
∗ cc
dα +es, wherees=sors. As
∂p
∂x <0we must have dx∗cc
dα <0
for this equation to hold. Hence, signdz∗cc
dα =sign
dy∗ cc
dα =sign
dx∗ cc
dα <0for this
case.
7
4
Market power in the generation of black
elec-tricity
We now look at the case where the producers of black electricity enjoy market power. We assume that these producers act as a Nash Cournot (NC)-playing oligopolist (or a perfectly co-ordinated cartel) facing the producers of green electricity as a competitive fringe. We further assume that the NC-playing producers of black electricity consider both the quantity of green electricity and the number of GCs as given, represented byz. The producers of black electricity will therefore in their generation decision also consider the simultaneous effect their quantity decision has on the price of GCs, because this price affects the wholesale price of electricity (q=p−αs). We are considering a one-shot game so the NC-playing oligopolist will not be able to react on the response from the producers of green electricity, i.e. the producers of black electricity are not Stackelberg leaders. In the NC-equilibrium none of the producers will want to change their quantity decision.
Again we are suppressing the subscripts indicating market form as we go through the model specification. The NC-playing producers of black electricity is faced with the following residual demand function for wholesale electricity:
q=q(x) =p(x)−αs(x) , wherex=y+z, and the following optimization problem:
M axΠ(y, z) =q(x)y−c(y) .
In equilibrium the profit maximizing oligopolistic generator of black electric-ity will therefore equate marginal revenue with marginal cost:
∂Π
∂y =
∂q(x)
∂y y+q−c
0
(y) = 0. Or more precisely:
∂Π
∂y =
· ∂p
∂x−α
∂s
∂y
¸
y+q−c0(y) = 0.
Observe that a marginal change of the generation of black electricity may affect the wholesale price through both the electricity market and the GC mar-ket. The effect through the electricity market is an ordinary effect on consumer price, while the effect through the GC market stems from the induced change of demand for certificates following from a marginal change in the generation of black electricity (e.g. an increase in the generation of black electricity by one unit will, in equilibrium, increase the demand of electricity by one unit and the demand for certificates by α units). Considering the effect of a marginal change of demand on the price of GCs,α∂s
∂y, this is clearly zero as long as the
the marginal revenue is discontinuous at this point, see Figure 1. At this point the total demand is equal to zα∗, which is the only level of demand where we actually get a certificate price within the price interval. A marginal change in the demand of GCs from the allowable consumption level will drive the price of GCs either to the lower bound (if the demand decreases) or to the upper bound (if the demand increases). In equilibrium the consumers will never buy more certificates than they actually need, they always buy an amount of certificates equal toαx. So if the demand falls below z∗
α there is an excess supply of certifi
-cates and the certificate price reaches the lower bound. Similarly there will be an excess demand for certificates if the demand for electricity increases above the level z∗
α. An excess demand for certificates implies that the certificate price
reaches the upper bound.
4.1
mc-equilibrium
In the case of market power in the generation of black electricity we have the following equilibrium solution for the key variables:
p(x∗mc) =qmc∗ +αs∗mc (13)
x∗mc=y∗mc+z∗mcSz
∗
mc
α (14)
q∗mc+s∗mc=h0(zmc∗ ) (15)
·∂p(x∗
mc)
∂x −α
∂s(x∗
mc)
∂y
¸
ymc∗ +q∗mc=c0(ymc∗ ) (16) In equation (14), <, = and>refer to the cases s∗mc=s, s < s∗mc < sand
s∗mc=s, respectively. Note that (16) reduces to ∂p(x∗mc)
∂x y∗mc+q∗mc=c
0
(ymc∗ ) in the cases ofs∗cc=s ands∗cc=s, because, as argued above, ∂s(x∗mc)
∂y = 0 if the
GC-price is at one of the price bounds.
4.2
Analysis
We will now compare the mc-equilibrium with the cc-equilibrium. We will do this by looking at three different cases. The cases will differ with respect to whether the price of the GCs in the competitive case is at one of the price bounds or if it is within the price interval. In each of the cases we identify the cc-equilibrium and consider the effect of introducing market power in the generation of black electricity. The main results are highlighted in Proposition 2 and 3.
Proposition 2 Assume the producers of black electricity act as a NC-playing oligopolist (or a perfectly co-ordinated cartel) facing green producers as a com-petitive fringe, then - in equilibrium - there willi) never be established an in-termediate certificate price such that s < s∗mc < s, but ii) there may be an equilibrium certificate price at the lower or the upper price bound, i.e. s∗mc=s
ors∗mc=s.
Proof. i)To show that we cannot haves < s∗mc< s, assumeyˆis a solution
satisfying thefirst order conditions for the producers of black electricity and that
ˆ
y+z= z
α wherez is the quantity of green electricity that the producers of black
electricity, in accordance with the NC-assumption, consider as given. Clearly, if y <yˆ, then s∗
mc=s, due to excess supply of certificates (i.e. z >α(y+z))
and if y > yˆ, then s∗
mc = s, due to excess demand for certificates. Denote
the marginal revenue function, g(y, z), by g(y, z) = ∂∂qyy +q. Observe that
g(y, z) = ∂∂pxy +q for y 6= ˆy as ∂∂ys = 0 for such values. Clearly, g(y, z)
is discontinuous at yˆ as lim
y→yˆ−g(y, z) =
∂p
∂xyˆ+ ˆq− and ylim→yˆ+g(y, z) =
∂p
∂xyˆ+
ˆ
q+ where qˆ− = lim
y→yˆ−q = p(ˆy+z)−αs and qˆ
+ = lim
y→ˆy+q = p(ˆy+z)−αs.
However, as Π(ˆy, z) = qyˆ−c(ˆy), profit maximization will lead the producers of black electricity to secureqˆ− (by an infinitesimal quantity reduction of black
electricity) implying the corner solution, i.e. s∗
mc=s. An example is illustrated
in Figure 2.
ii) To show that the GC-price may be at either the upper or the lower price bound, it suffices to give examples satisfying the assumptions of the model. Ex-amples are provided in appendix B and illustrated in Figure 3 and 4.
In Figure 2, 3 and 4 we have illustrated the profit curves of the NC-playing producers of black electricity for three possible equilibrium solutions of the model. Figure 2 helps illustrating the point made in Proposition 2i), that there will neve be established an intermediate GC-price in the mc-case. In Figure 3, the equilibrium certificate price is at the lower price bound, while in Figure 4 the price of GCs in equilibrium is established at the upper price bound. The
figures are based on a simple numerical model satisfying the assumptions we have made about the electricity market. The model is specified in Appendix A. The specific parameter values and solutions of the model illustrated in the
the lower price bound. If the generation of black electricity increases above the point where the profit curve drops, total consumption is above the allowable consumption level and the certificate price jumps to the upper price bound.
In the numerical example behind Figure 2, the model generates an interme-diate GC-price. However, the NC-playing producers of black electricity will not stay at the allowable consumption level implied by the intermediate GC-price. The profit curve shows that profit maximization will lead to an infinitesimal reduction in the quantity of black electricity from the allowable consumption level, inducings∗
mc=s. Hence, Figure 2 ilustrates the point made in the formal
proof above. In Figure 3 the profit curve has a global maximum at the left of the allowable consumption level. We will therefore get an equilibrium GC-price at the lower price bound. In Figure 4, however, the global maximum is to the right of this point, i.e. the GC-price is at the upper price bound.
F igure 2,3 and 4 here
The following proposition shows that market power exercised by the pro-ducers of black electricity may actually lead to an increase of the generation of green power, as compared with the competitive equilibrium, and that this is definitely true if the competitive equilibrium GC-price is at its lower bound. The generation of black electricity will, however, always decrease compared with the competitive equilibrium.
Proposition 3 Under the assumptions of the model: i)if s∗
cc=s thenzmc∗ > z∗
cc,ii)if s∗cc> sthensign(zmc∗ −zcc∗)is indeterminate andiii)ymc∗ < ycc∗.
Proof. i) To obtain a contradiction, assume z∗
mc ≤zcc∗. ¿From (11) and
(15)we have: h0(z∗
cc) = q∗cc+s≥qmc∗ +s∗mc =h
0
(z∗
mc), implying qcc∗ ≥qmc∗ .
From(12)and(16): q∗
cc=c
0
(y∗
cc)≥c
0
(y∗
mc)−∂∂pxy∗mc=qmc∗ . Hence,ycc∗ > ymc∗ .
So that x∗
cc = ycc∗ +zcc∗ > x∗mc = z∗mc+y∗mc and p(x∗cc) < p(x∗mc).
How-ever, successive substitution from the two sets of first order conditions yields:
p(x∗
cc) = (1−α)q∗cc+αh
0
(z∗
cc) and p(x∗mc) = (1−α)q∗mc+αh
0
(z∗
mc). As qcc∗ ≥qmc∗ and z∗cc≥ z∗mc, this clearly gives p(x∗cc)≥p(x∗mc); a contradiction. Hence, we must havezmc∗ > z∗cc.
ii)Examples satisfying the assumptions of the model are provided in appendix C.
iii)To obtain a contradiction, assumey∗mc≥ycc∗. Then from(4)(or (8)or
(12)) and (16), q∗
mc > qcc∗. We now consider each possible case with respect to
the value ofs∗
ccfor the cc-equilibrium.
Assumefirsts∗
cc=s. Then, asq∗mc> qcc∗ ands∗mc≥s, we have from(9)and
(13)that p(x∗
mc) =q∗mc+αs∗mc > p(x∗cc) =q∗cc+αs. However, from(11) and
(15)we haveh0(z∗
cc) =qcc∗ +s < q∗mc+s∗mc=h
0
(z∗
mc)so thatzmc∗ > z∗cc. Hence,
as by assumption y∗
mc≥y∗cc, we must havex∗mc=y∗mc+zmc∗ > y∗cc+zcc∗ =x∗cc
so thatp(x∗
mc)< p(x∗cc). That contradicts the above assumption thatp(x∗mc)< p(x∗
cc). Hence, ymc∗ < ycc∗ ass∗cc=s.
Next, assume s∗
cc > s. Consider first the possibility that s∗mc = s. Then,
qcc∗ +αs∗cc, and h0(zcc∗) = q∗cc+scc∗ < q∗mc+s = h0(z∗mc) so that zmc∗ > zcc∗,
x∗mc> x∗cc and the contradicting result that p(x∗mc)< p(x∗cc).
It remains to consider the case where s∗cc > s and smc∗ = s. As s∗cc > s, we must have zcc∗
z∗
cc+y∗cc ≤α or(1−α)z
∗
cc≤αycc∗, and, furthermore, as s∗mc =s
we must have (1−α)z∗
mc > αy∗mc. Then, as by assumption ymc∗ ≥ y∗cc, we
have (1−α)z∗
cc < αy∗cc ≤ αy∗mc < (1−α)z∗mc, so that zmc∗ > z∗cc. Hence, x∗
mc =y∗mc+zmc∗ > ycc∗ +zcc∗ =x∗cc, so that p(x∗mc)< p(x∗cc). However,
suc-cessive substitutions from the two sets offirst order conditions yield: p(x∗
mc) =
(1−α)q∗
mc+αh
0
(z∗
mc)andp(x∗cc) = (1−α)qcc∗ +αh
0
(z∗
cc). Asq∗mc> q∗cc and z∗
mc> zcc∗ we havep(xmc∗ )> p(x∗cc), that contradicts the above conclusion.
Hence, we arrive at thefinal conclusion thaty∗
mc< y∗cc.
Compared to the perfect competition equilibrium, market power in the gen-eration of black electricity will always reduce the gengen-eration of black electricity (as shown in proposition 3 iii)) and increase the wholesale price of electricity. Even (as stated in Proposition 3i) and ii)) if the green electricity producers may increase their generation, it can be shown that this increase will never fully compensate for the reduction in generation of black electricity. Thus, total quantity of electricity generated will decrease. This leads unambiguously to an increased end-user price and lower consumption. The market power obviously makes the producers of black electricity better offas they are able to increase their profit as oligopolists (or a cartel) as compared with the competitive solu-tion, and the consumers will always be the losers in this situation due to lower consumption and higher price. Whether the producers of green electricity will gain or loose compared with a competitive market will, however, depend on the price of GCs that would be generated in a competitive market. As stated by Proposition 3ii), introduction of market power in the generation of black electricity can actually increase the generation of green electricity also in the cases where the competitive market generates a certificate price at the upper bound, s∗
cc =s, or within the price interval. However, the effect on the green
5
Market power in the generation of green
elec-tricity
In this section we consider a NC-playing oligopolistic generator of green electric-ity (or a perfectly co-ordinated cartel) facing a competitive fringe of producers of black electricity. The NC assumption is here implying that the producers of green electricity consider the quantity of black electricity as given (represented below asy) when making decisions as to how much green electricity to generate and how many GC’s to sell in the certificate market. As NC-players, the pro-ducers of green electricity will recognize that the certificate price will be affected by the number of certificates they sell in the GC market. Therefore they will consider if it can be profitable to hold back some of the certificates they gen-erate. To be able to separate the number of certificates sold from the number of certificates generated we introduce a variablewrepresenting the former (zis still representing the number of generated certificates). The profit maximizing generator of green electricity then maximizes the following objective function:
M axΠ(z, w, y) =qz+sw−h(z) , s.t. w≤z. We consider two cases: a)w=zand b) w < z:
a) First order condition:
∂Π
∂z =
∂(q+s)
∂z z+q+s−h
0
(z) = 0. Or more precisely:
∂Π
∂z =
·∂p
∂x+ (1−α)
∂s
∂z
¸
z+q+s−h0(z) = 0. b) First order conditions:
∂Π
∂z =
∂q
∂zz+q+
∂s
∂zw−h
0
(z) = 0 and
∂Π
∂w =
∂q
∂wz+
∂s
∂ww+s= 0.
5.1
cm-equilibrium
We have then the following equilibrium solution for the key variables in case a), i.e. z=w:
p(x∗cm) =qcm∗ +αs∗cm (17)
x∗cm=y∗cm+z∗cmSzcm∗
· ∂p(x∗
cm)
∂x + (1−α)
∂s(x∗
cm)
∂z
¸
zcm∗ +q∗cm+scm∗ =h0(zcm∗ ) (19)
q∗cm=c0(ycm∗ ) (20) As in the specification of the mc-equilibrium, the operators<, = and>in equation (18) refer to the casess∗cm=s,s < scm∗ < sands∗cm=s, respectively. Note that (19) reduces to ∂p(x∗cm)
∂x z∗cm+qcm∗ +s∗cm = h
0
(z∗cm) in the cases of
s∗cm=sands∗cm=s.
5.2
Analysis
As will be shown in proposition 5, it will never be profitable for the producers of green electricity to hold back some of the generated certificates from the market. We will therefore not go into detail about the equilibrium solution of the case where w < z, but rather concentrate on the main results from case a). These are highlighted in Proposition 4,5 and 6.
Proposition 4 shows that the result regarding non-existence of intermediate certificate prices carries over from the mc-equilibrium to the case of co-ordinated oligopolistic behavior of the producers of green electricity.
Proposition 4 Assume the producers of green electricity act as a NC-playing
oligopolist (or a perfectly co-ordinated cartel) facing a competitive fringe of pro-ducers of black electricity, then - in equilibrium - there willi)never be established an intermediate certificate price such thats < s∗
cm< s, butii)there may be an
equilibrium certificate price at the lower or the upper price bound, i.e. s∗
cm=s
ors∗
cm=s.
Proof. i)To show that we cannot haves < s∗
cm< s, assumezˆandwˆ, with
ˆ
w ≤ zˆ, satisfy the optimality conditions for the producers of green electricity and thaty+ ˆz= wˆ
α wherey is the quantity of black electricity that the producers
of green electricity, in accordance with the NC-assumption, consider as given. We consider two cases: a)w <ˆ zˆand b)wˆ= ˆz.
a) Clearly, if z < zˆ (for given values of y and wˆ) then s∗
cm = s, due to
excess supply of certificates (i.e. w >ˆ α(y+z)) and if z > zˆ, then s∗cm = s, due to excess demand for certificates. Denote the marginal revenue function,
g(z, y,wˆ), by g(z, y,wˆ) = ∂∂qzz+∂∂szwˆ+q. Observe that g(z, y,wˆ) = ∂∂xpz+q
for z 6= ˆz as ∂∂zs = 0 for such values. Clearly, g(z, y,wˆ) is discontinuous at
ˆ
z as lim
z→zˆ−g(z, y,wˆ) =
∂p
∂xˆz+ ˆq− and z→limzˆ+g(z, y,wˆ) =
∂p
∂xˆz+ ˆq+ where qˆ− =
lim
z→ˆz−q=p(y+ ˆz)−αs andqˆ
+ = lim
z→ˆz+q=p(y+ ˆz)−αs. The profit function
is Π(ˆz, y,wˆ) = qzˆ+swˆ−h(ˆz). Rewrite this as Π(ˆz, y,wˆ) = p(y+ ˆz) ˆz +
s( ˆw−αzˆ)−h(ˆz)and observe that the assumption ofy+ ˆz= wˆ
α impliesw >ˆ αzˆ.
Hence, profit maximization will lead the producers of green electricity to secure
ˆ
q+(by an infinitesimal quantity increase of green electricity) implying the corner
b) In this case y+ ˆz = αˆz. Clearly, if z < ˆz, then s∗cm =s, due to excess demand for certificates (i.e. z <α(y+z)) and if z >ˆz, then s∗cm =s, due to excess supply of certificates. Denote the marginal revenue function, g(z, y), by
g(z, y) =³∂(q∂+zs)´z+q+s. Observe that g(z, y) = ∂∂pxz+q+s forz6= ˆz as
∂s
∂y = 0for such values. Clearly, g(z, y)is discontinuous atzˆaszlim→zˆ−g(z, y) =
∂p
∂xzˆ+ ˆq−+sandzlim→zˆ+g(z, y) =
∂p
∂xzˆ+ ˆq++swhereqˆ−= limz→ˆz−q=p(y+ ˆz)−αs
andqˆ+= lim
z→ˆz+q=p(y+ ˆz)−αs. However, asΠ(ˆz, y) = (q+s) ˆz−h(ˆz), profit
maximization will lead the producers of green electricity to secure qˆ− (by an infinitesimal quantity reduction of green electricity) implying the corner solution
s∗
cm=s.
ii) To show that the GC-price may be at either the upper or the lower price bound, it suffices to give examples satisfying the assumptions of the model. Ex-amples are provided in appendix D and illustrated in Figure 5 and 6.
As in the mc-case we will illustrate two possible equilibrium solutions for the GC-price, one at the lower price bound and one at the upper price bound. In Figure 5 and 6 we have illustrated the profit curves of the producers of green electricity for two sets of assumed parameter values. The numerical examples behind thefigures are presented in Appendix D. In thefigures, the profit curves are illustrated assuming that the NC-playing producers of green electricity con-sider the quantity of black electricity as given. Fixing the quantity of black electricity at the equilibrium level and varying the quantity of green electric-ity, produces the profit curves illustrated in Figure 5 and 6. Again the profit curves drop discontinuously at the point of the allowable consumption level. As opposed to the mc-case, quantity levels below the allowable consumption level will in the cm-case generate a GC-price at the upper price bound. For such low quantities of green electricity, there will be an excess demand for GCs. For higher quantities of green electricity, the GC-price is at the lower bound. As the profit curve in Figure 5 has its global maximum at the right of the allow-able consumption level, the GC-price in equilibrium is at the lower price bound. Figure 6, on the other hand, illustrates an equilibrium GC-price at the upper price bound. As in the mc-case, the drop in the profit curves illustrates that an interior GC-price will not be an equilibrium.
F igure 5 and 6 here
Proposition 5 shows that the producers of green electricity will never sell less certificates than they generate. Intuitively, the relationship between the number of certificates sold and the equilibrium solution is disconnected when the generator of green electricity act as a NC-oligopolist. Hence, selling an additional certificate has no influence on the market equilibrium and only adds to the profit.
Proposition 5 Assume the producers of green electricity act as a NC-playing
pro-ducers of black electricity, then - in equilibrium - it will never pay to sell less certificates than the amount generated. Formally, we must have wcm∗ =z∗cm.
Proof. To obtain a contradiction, assume w∗cm < zcm∗ in equilibrium. We
know the equilibrium implies eithers∗cm=sors∗cm=sand that the number of certificates is not binding, i.e. wcm∗ 6=α(y∗cm+z∗cm). Consider the abovefirst order condition ∂∂Πw = ∂∂wqz+∂∂wsw+s= 0. Ass∗cm is at either the lower or the upper price bound and the number of certificates is not binding we must have
∂q
∂w = 0and ∂∂ws = 0, such that ∂∂Πw =s >0. Hence, profits may be increased by
selling all the certificates.
Market power among the producers of green electricity necessarily leads to a reduction of green electricity generation. However, Proposition 6 shows that the generation of black electricity may increase as compared with the competitive equilibrium and that this is definitely true if the competitive equilibrium GC-price is at its upper bound.
Proposition 6 Under the assumptions of the model: i)z∗
cm< z∗ccii)ifs∗cc=s
theny∗
cm> ycc∗ andiii) ifs∗cc< sthensign(ycm∗ −y∗cc)is indeterminate.
Proof. i)To obtain a contradiction, assume z∗cm≥z∗cc. We consider each
possible case with respect to the value ofs∗cc for the cc-equilibrium.
Assume first s∗cc = s. Then, as by assumption, z∗cm ≥ z∗cc and s∗cm ≤s∗cc, we have from(7) and(19) qcm∗ =h0(zcm∗ )−s∗cm−dpdxz∗cm> h
0
(z∗cc)−s=qcc∗. By successive substitutions from the two sets offirst order conditions we arrive at p(x∗
cm) = (1−α)qcm∗ +α
h
h0(z∗
cm)−dxdpzcm∗
i
and p(x∗
cc) = (1−α)qcc∗ +
αh0(z∗
cc). As zcm∗ ≥ zcc∗ and qcm∗ > qcc∗, we have p(x∗cm) > p(x∗cc). However,
using (8) and (20) we get c0(y∗
cm) = q∗cm > qcc∗ = c
0
(y∗
cc) so that y∗cm > ycc∗.
Consequently, x∗
cm = ycm∗ +zcm∗ > y∗cc+zcc∗ = x∗cc, so that p(x∗cm)< p(x∗cc).
This contradicts the above conclusion that p(x∗
cm) > p(x∗cc). Hence, we must
havez∗
cm< z∗ccass∗cc=s.
Next, assumes∗
cc< s. Considerfirst the possibility thats∗cm=s. We follow
the same line of reasoning as above to arrive atq∗
cm> qcc∗, as we have from(3),
(11)and(19)thatq∗
cm=h
0
(z∗
cm)−s−dpdxzcm∗ > h
0
(z∗
cc)−s∗cc=qcc∗. Furthermore,
by successive substitutions from the two sets offirst order conditions we arrive at p(x∗cm) = (1−α)qcm∗ +αhh0(z∗cm)−dxdpzcm∗ i and p(x∗cc) = (1−α)qcc∗ +
αh0(zcc∗). Inspection of signs yields p(x∗cm)> p(x∗cc). However, using (4),(12)
and(20)we getc0(y∗cm) =qcm∗ > qcc∗ =c0(ycc∗)so thaty∗cm> y∗cc. Consequently,
xcm∗ =y∗cm+zcm∗ > y∗cc+z∗cc=x∗cc, so thatp(xcm∗ )< p(x∗cc). This contradicts the above conclusion thatp(x∗cm)> p(x∗cc).
It remains to consider the case where s∗cc < s and s∗cm = s. As s∗cc < s
we must have (1−α)z∗
cc ≥αycc∗, and, furthermore, as s∗cm =s we must have
αy∗
cm > (1−α)zcm∗ . Then, as by assumption, zcm∗ ≥ zcc∗ we have αycm∗ >
(1−α)z∗
cm≥(1−α)zcc∗ ≥αycc∗, so thatycm∗ > ycc∗. Hence,x∗cm=y∗cm+z∗cm> y∗
cc+zcc∗ = x∗cc, such that p(x∗cm) < p(x∗cc). However, using (4), (12) and
(20) we get q∗
cm = c
0
(y∗
cm) > c
0
(y∗
cc) = q∗cc. From the following expressions
(derived above): p(x∗cm) = (1−α)qcm∗ +αhh0(zcm∗ )−dpdxzcm∗
i
(1−α)q∗cc+αh0(zcc∗), we are forced to conclude that p(x∗cm) > p(x∗cc), that contradicts the above conclusion thatp(x∗cm)< p(x∗cc).
Hence, we arrive at thefinal conclusion thatzcm∗ < zcc∗ for all cases.
ii) To obtain a contradiction, assume y∗cc ≥ y∗cm. ¿From (8) and (20) we haveqcc∗ ≥qcm∗ , and from(5)and(17)we havep(x∗cc)≥p(x∗mc), which implies
x∗cc≤x∗cm. Then from(6)and(18)we haveycc∗ +zcc∗ ≤y∗cm+z∗cm. Asycm∗ ≤ycc∗, by assumption, we havezcm∗ ≥zcc∗ that is proven to be wrong in i). Hence, we must havey∗
cm> y∗cc.
iii) Examples satisfying the assumptions of the model are provided in ap-pendix E.
Market power in the generation of green electricity always induces reduced generation of green electricity and a higher end user price, as compared with the competitive case. The producers of green electricity will always earn a higher profit in the case where they enjoy market power as compared with the cc-equilibrium. On the other hand, also the producers of black electricity may be better offthan in the competitive case, and this will always be so in the case of s∗cc = s. The reason is that the wholesale price of electricity will increase in the cm-equilibrium in the case ofs∗cc=s, as the generation of black electricity increases compared with the competitive solution. However, the effect on the wholesale price in the two other cases, i.e. s∗cc =s ands < s∗cc< s, is inconclusive because of the indeterminacy of the change in the generation of black electricity. Therefore the effect on the profit of the producers of black electricity is indeterminate in these cases.
6
Market power in the generation of both black
and green electricity
In this section we will assume that there is market power in both generation technologies. We will therefore have a market in which both the producers of black and green electricity act as NC-playing oligopolists.
The optimization problems for the producers of black and green electric-ity are identical to the mc-case and the cm-case, respectively. This gives the followingfirst order condition for the NC-playing producers of black electricity:
∂Π
∂y =
· ∂p
∂x−α
∂s
∂y
¸
y+q−c0(y) = 0.
For the profit maximizing generator of green electricity we consider two cases: a)w=z and b)w < z:
a) First order condition:
∂Π
∂z =
·∂p
∂x+ (1−α)
∂s
∂z
¸
∂Π
∂z =
∂q
∂zz+q+
∂s
∂zw−h
0
(z) = 0 and
∂Π
∂w =
∂q
∂wz+
∂s
∂ww+s= 0.
6.1
mm-equilibrium
We have then the following equilibrium solution for the key variables in case a), i.e. z=w:
p(x∗mm) =qmm∗ +αs∗mm (21)
x∗mm=y∗mm+z∗mmSz
∗
mm
α (22)
· ∂p(x∗
mm)
∂x + (1−α)
∂s(x∗
mm)
∂z
¸
z∗mm+q∗mm+smm∗ =h0(zmm∗ ) (23)
· ∂p(x∗
mm)
∂x −α
∂s(x∗
mm)
∂y
¸
y∗mm+q∗mm=c0(ymm∗ ) (24) Again,<, = and>in equation (22) refer to the casess∗
mm=s,s < s∗mm< s
and s∗
mm = s, respectively. For the cases of s∗mm = s and s∗mm =s, we have
∂s(x∗ mm)
∂z =
∂s(x∗ mm)
∂y = 0. Thus, (23) (24) are reduced to
∂p(x∗ mm)
∂x z∗mm+qmm∗ +
s∗
mm=h
0
(z∗
mm) and ∂p(x
∗ mm)
∂x ymm∗ +qmm∗ =c
0
(y∗
mm), respectively.
6.2
Analysis
As in the preceding section, it will be shown (Proposition 7) that it will never be profitable for the producers of green electricity to hold back some of the generated certificates from the market. We concentrate therefore on the main results from case a). These are highlighted proposition 7 and 8.
Proposition 7 shows that, like in the mc- and cm-equilibrium, the certificate market collapses in the sense that the GC-price will never be established at an intermediate level. It may, however, be established at the upper price bound. We further show that again it will not be profitable for the producers of green electricity to utilize their market power to hold back some of the certificates they generate.
Proposition 7 Assume both the producers of black and green electricity act as
a NC-playing oligopolists, then - in equilibrium - there willi)never be established an intermediate certificate price such thats < s∗mm< s, butii)there may be an equilibrium certificate price at the lower or the upper price bound, i.e. s∗
mm=s
ors∗
Proof. i) The proof follows the same line of reasoning as in the mc- and cm-equilibrium above.
ii) To show that the GC-price may be at either the upper or the lower price bound, it suffices to give examples satisfying the assumptions of the model. Ex-amples are provided in appendix F. An illustration of a possible equilibrium is provided in Figure 7.
iii)The proof forwmm∗ =zmm∗ is following the same line of reasoning as in the proof for proposition 5.
In Figure 7 we have illustrated a possible equilibrium solution of the numer-ical model specified in Appendix A. Figure 7 shows the best response curves for the two types of producers in the mm-case for an equilibrium solution with the GC-price at the lower price bound. Thefigure is based on the example
speci-fied in thefirst part of Appendix F. The best response curve for the producers of green electricity, R(y), is found by fixing the quantity of black electricity at different levels and then identifying the profit maximizing quantity of green electricity at each of these levels. The best response curve for the producers of black electricity, R(z), is produced in the same way, except that we then
fix the quantity of green electricity. The equilibrium quantities of black and green electricity is found at the intersection of the best response curves, which confirms the NC-equilibrium solution presented in Appendix F for the assumed parameter values.
F igure 7 here
Proposition 8 states that in the case of market power in both generation tech-nologies the development of the output levels of both black and green electricity is indeterminate as compared with the competitive solution.
Proposition 8 Under the assumptions of the model we have that
sign(ymm∗ −ycc∗) and sign(z∗mm−z∗cc) are both indeterminate, irrespective of whethers < s∗cc< s,s∗cc=s ors∗cc=s.
Proof. It suffices to give examples satisfying the assumptions of the model.
Examples are provided in appendix G.
7
Market power in the joint generation of green
and black electricity
In this section we will assume that there is only one generator of electricity. This generator will be able to generate from both renewable and non-renewable sources. The objective function for this generator is:
M axΠ(z, w, y) =q(z+y) +sw−h(z)−c(y) , s.t. w≤z. We consider two cases: a)w=zand b) w < z:
a) First order conditions:
∂Π
∂z =
∂(q+s)
∂z x+q+s−h
0
(z) = 0 and
∂Π
∂y =
∂q
∂yx+q−c
0
(z) = 0. Or more precisely:
∂Π
∂z =
· ∂p
∂x+ (1−α)
∂s
∂z
¸
x+q+s−h0(z) = 0 and
∂Π
∂y =
·∂p
∂x−α
∂s
∂y
¸
x+q−c0(y) = 0. b) First order conditions:
∂Π
∂z =
∂q
∂zx+q+
∂s
∂zw−h
0
(z) = 0,
∂Π
∂y =
∂q
∂yx+q+
∂s
∂yw−c
0
(y) = 0 and
∂Π
∂w =
∂q
∂wx+
∂s
∂ww+s= 0.
7.1
M-equilibrium
We have then the following equilibrium solution for the key variables in case a), i.e. z=w:
p(x∗M) =q∗M+αs∗M (25)
x∗M =yM∗ +z∗M S z
∗
M
α (26)
·∂p(x∗
M)
∂x + (1−α)
∂s(x∗
M)
∂z
¸
· ∂p(x∗
M)
∂x −α
∂s(x∗
M)
∂y
¸
x∗M+q∗M =c0(y∗M) (28) In equation (26), the operators <, = and > refer to the cases s∗
M = s, s < s∗
M < s and s∗M = s, respectively. Remember that, (27) and (28) are
reduced to ∂p(x∗M)
∂x x∗M +q∗M +s∗M = h
0
(zM∗ ) and ∂p(x∗M)
∂x x∗M +q∗M = c
0
(yM∗ ), respectively, in the cases ofs∗M =sands∗M =s.
7.2
Analysis
As will be shown below, it will never be profitable for the generator to hold back some of the generated certificates from the market. We will therefore not go into detail about the equilibrium solution of the case wherew < z, but rather concentrate on the main results from case a). We highlight these results in Proposition 9 and 10. Proposition 9 shows that although there does not exist intermediate equilibrium certificate prices in any of the preceding cases of market power, there will indeed exist such prices when there is joint (monopolistic) market power for black and green electricity producers.
Proposition 9 Assume the producers have both green and black technologies at
their disposal and act as a monopolist, then - in equilibrium - a certificate price may be established at i)an intermediate level, i.e. s < s∗
M < s orii)either of
the price bounds, i.e. s∗
M =sor s∗M =s. Furthermore, we haveiii)wM∗ =zM∗ .
Proof. i)To show that there may be interior certificate prices,s < s∗
M < s,
it suffices to give an example. This is provided in Appendix H. The essential reason for the existence of such interior prices is that the monopolist is indif-ferent with respect to securing the high, the low or some intermediate certificate price (and correspondingly for the wholesale price) for the case where the op-timal solution satisfies xˆ= ˆy+ ˆz = αwˆ with wˆ ≤ zˆ. To see this, consider the profit function for the monopolistΠ(ˆz,y,ˆwˆ) =qxˆ+swˆ−c(ˆy)−h(ˆz). This may be rewritten: Π(ˆz,y,ˆwˆ) =pxˆ+ ( ˆw−αxˆ)s−c(ˆy)−h(ˆz). However, as xˆ= wαˆ
the profit function reduces to Π(ˆz,y,ˆ wˆ) =pxˆ−c(ˆy)−h(ˆz). Hence, the value ofs does not matter. Intuitively, a larger certificate price is exactly offset by a smaller wholesale price for this case.
ii) To show that there may be a GC-price at either the upper or the lower price bound, it suffices to give examples satisfying the assumptions of the model. Examples are provided in appendix H.
iii)The proof forw∗
M =zM∗ is following the same line of reasoning as in the
proof for proposition 5.
As observed in Proposition 9, the profit function for the monopolist reduces to Π(z, w, y) = p(x)x−c(y)−h(z) as s < s∗
M < s. Hence, the first order
Proposition 10 Under the assumptions of the model: yM∗ < y∗ccandzM∗ < zcc∗.
Proof. The proposition is proved by considering the following complete set
of cases: a) s∗cc=s,b)s∗cc=s c)s < s∗cc< s
a) To obtain a contradiction, assume yM∗ ≥ ycc∗. Substitute (12) into (11)
and(28) into (27) to obtain s =h0(z∗
cc)−c
0
(y∗
cc) ≤h
0
(z∗
M)−c
0
(y∗
M) =s∗M.
Asy∗
M ≥ycc∗, we must havezM∗ ≥zcc∗, so thatx∗M ≥x∗cc and p(x∗M)≤p(x∗cc).
However, successive substitution of the two sets of equilibrium conditions yields
p(x∗
M) = (1−α)c
0
(y∗
M) +αh
0
(z∗
M)− ∂∂pxx∗M and p(x∗cc) = (1−α)c
0
(y∗
cc) +
αh0(z∗
cc). Using z∗M ≥ zcc∗ and y∗M ≥ ycc∗ clearly gives p(x∗M) > p(x∗cc) that
contradicts the above result. Hence, we havey∗M < ycc∗. Next, we showzM∗ < zcc∗. As s∗cc = s, we must have(1−α)z∗cc>αycc∗. Consider the possibility that
s∗M > s (we consider s∗M = s below). If this is to be the case, then αy∗M ≥
(1−α)zM∗ so that (1−α)zcc∗ >αycc∗ >αy∗M ≥ (1−α)zM∗ . Hence, we must havezM∗ < zcc∗. It remains to show the case ofs∗M =s. Substitute(12)into(11)
and(28)into(27) to obtain s∗
cc=s=h
0
(z∗
cc)−c
0
(y∗
cc) =h
0
(z∗
M)−c
0
(y∗
M) = s=s∗
M. Clearly,yM∗ < y∗cc implieszM∗ < zcc∗. This completes the proof of case a).
b) To obtain a contradiction, assume z∗
M ≥z∗cc. Substitute (8) into(7) and
(28)into(27)to obtains=h0(zcc∗)−c0(ycc∗)≥h0(zM∗ )−c0(y∗M) =s∗M. Clearly,
z∗M ≥z∗cc impliesy∗M ≥ycc∗ so that x∗M ≥x∗cc andp(x∗M)≤p(x∗cc). From here on the proof follows the last part of the proof under a). Hence, we must have
z∗M < z∗cc. Next, we showy∗M < ycc∗ for this case. As s∗
cc = s, we must haveαycc∗ >(1−α)zcc∗. Consider the possibility that s∗
M < s(we considers∗M =sbelow). If this is to be the case, then(1−α)zM∗ ≥
αy∗
M so that αy∗cc > (1−α)zcc∗ > (1−α)zM∗ ≥ αyM∗ . Hence, we must have y∗
M < ycc∗. It remains to show the case ofs∗M =s. Substitute (12)into(11)and
(28)into(27)to obtains∗
cc=s=h
0
(z∗
cc)−c
0
(y∗
cc) =h
0
(z∗
M)−c
0
(y∗
M) =s=s∗M.
Clearly,z∗
M < zcc∗ impliesy∗M < ycc∗. This completes the proof of caseb). c) Observe that if s < s∗
cc < s; then z
∗ cc
α =
y∗cc
1−α = x∗cc. Hence, from the
relationshipp(x∗
cc) = (1−α)c
0
(y∗
cc) +αh
0
(z∗
cc)we have p(x∗
cc) = (1−α)c
0
((1−α)x∗
cc)+αh
0
(αx∗
cc). Next, consider the possibility
that s < s∗
M < s (the possibilities that s∗M = s and s∗M = s are considered
below).We then know that p(x∗M) + dpdxx∗M = c0(y∗M) = h0(zM∗ ). This may be rewritten: p(x∗
M) = (1−α)c
0
(y∗
M) +αh
0
(z∗
M)−dxdpx∗M. However, as s < s∗M < s we know that z∗M
α =
y∗ M
1−α = x∗M. Inserting these relationships in the
above expression we arrive at p(x∗M) = (1−α)c0((1−α)x∗M) +αh0(αx∗M)−
dp
dxx∗M. Hence, p(x∗M)−p(x∗cc) = (1−α)
h
c0((1−α)x∗
M)−c
0
((1−α)x∗
cc)
i
+
αhh0(αx∗M)−h0(αx∗cc)i−dp
dxx∗M. To obtain a contradiction assume: x∗M ≥x∗cc.
Observe that the l.h.s. of the above expression is non-positive, while the r.h.s. is strictly positive. Hence, we must have x∗
M < x∗cc and y∗M = (1−α)x∗M <
(1−α)x∗
cc=ycc∗ andzM∗ =αx∗M <αx∗cc=zcc∗, i.e. yM∗ < ycc∗ andz∗M < z∗cc.
Next, consider the case ofs∗
c0(y∗cc)< h0(z∗M)−c0(y∗M) =s. Clearly, the assumption that y∗M ≥y∗ccimplies
z∗M ≥z∗ccso thatx∗M > x∗ccandp(x∗M)< p(x∗cc). From here, we follow the part of the proof undera)showing that we cannot havep(x∗M)≤p(x∗cc). Hence, we must have yM∗ < ycc∗. We know that this also implies zM∗ < z∗cc. To see this, observe that s < s∗cc < s implies (1−α)zcc∗ =αycc∗ and that s∗M = s implies αy∗M > (1−α)zM∗ . Hence, (1−α)zcc∗ =αycc∗ > αyM∗ > (1−α)zM∗ , so that
z∗M < z∗cc.
To complete the proof we now consider s∗
M =s. To obtain a contradiction,
assume z∗
M ≥zcc∗. Substituting (12) into (11)and (28)into (27)we get s∗cc = h0(z∗
cc)−c
0
(y∗
cc)> h
0
(z∗
M)−c
0
(y∗
M) =s. Clearly, as by assumptionz∗M ≥z∗cc
we must also havey∗
M ≥y∗ccandx∗M ≥x∗ccso that p(x∗M)≤p(x∗cc). From here
we follow the part of the proof undera)showing that we cannot have p(x∗M)≤
p(x∗cc). Hence, we must havezM∗ < zcc∗.
Finally, we show that z∗M < zcc∗ implies yM∗ < ycc∗ for the case of s∗M = s. Observe that s < s∗cc < s implies αy∗cc = (1−α)z∗cc and that s∗M =s implies
(1−α)zM∗ > αyM∗ . Hence, αy∗cc = (1−α)z∗cc > (1−α)z∗M > αyM∗ , so that
yM∗ < ycc∗.
As expected, the case of joint market power will reduce the generation of both green and black electricity as compared with the competitive solution. The joint market power will also increase the profit from both generation technologies. As stated in proposition 7 above, the certificate price may go in both directions in this case.
8
Compatibility of GCs and
CO
2taxes
Assume the producers of black electricity are subject to a CO2 tax, t, per
unit kWh generated. Under perfect competition this gives rise to the following modification of thefirst order condition for the producers of black electricity:
q=c0(y) +t. (4’, 8’, 12’) Otherwise, the conditions remain the same. The next proposition shows that - contrary to what one should expect - an increase of theCO2 tax leads
to a reduction of the generation of green electricity, provided that the ”percent-age requirement” is binding and that there is an intermediate certificate price. Hence, theCO2tax does not stimulate the generation ofCO2-free electricity in
this setting. However, if the certificate price is at the price bounds it will stim-ulate the generation of green electricity. To see this use condition (40) instead
of (4), (80) instead of (8) and (120) instead of (12).
Proposition 11 Under the assumptions of the modeli) dz∗cc
dt <0and dy∗cc
dt <0,
provided thats < s∗cc < sandii) dz∗cc
dt >0and dy∗
cc
dt <0, provided thats∗cc =s
ors∗cc=s.