Munich Personal RePEc Archive
The Wake of Crises and Devaluations
Reinhart, Carmen and Goldstein, Morris and Kaminsky,
Graciela
University of Maryland, College Park, Department of Economics
2000
Online at
https://mpra.ub.uni-muenchen.de/45135/
The Wake of Crises and Devaluations
Assessing Financial Vulnerability: An Early Warning System for Emerging Markets Notes from Chapter 7
Morris Goldstein, Graciela L. Kaminsky, and Carmen M. Reinhart (Washington, DC: Institute for International Economics, 2000)
The preceding sections have predominantly focused on the antecedents of financial
crises. Namely, the emphasis has been on the ability of a variety of indicators, including the
credit ratings, to anticipate crises and characterize the extent to which a country is vulnerable.
An application of the signals methodology to recent data also offered some insights as to where
currency and banking sector problems may be brewing. In this section, we begin with the
premise that, whether anticipated or not, financial crises occur and, once they do, policymakers
and market participants become concerned about their consequences for economic activity. In
light of Asia’s recent woes, there is much speculation as to how long it will take those economies
to recover from such destabilizing shocks and what the consequences for inflation over the near-
and medium-term will be. In what follows, we review the historical experience in the aftermath
of currency and banking crises. The emphasis is on assessing the economy’s speed and capacity
to return to “normal.”
The recovery process
We next wish to assess how the various indicators we have stressed in our discussion
behave following the financial crises and, in particular, how many months elapse before their
define periods of “tranquility” as the periods that exclude the 24 months before and after
currency crises. In the case of banking crises, the 24 months before the banking crisis beginning
and 36 months following it are excluded from tranquil periods. For each indicator, we tabulate
its average behavior during “tranquil” periods. We then compare the post-crisis behavior of the
indicator to its average in periods of tranquility.
Table 7.1 summarizes the results for that exercise for currency and banking crises
separately, as we have stressed that banking crises have tended to be more protracted affairs. The
number given is the average number of months that it takes that variable to reach its norm during
tranquil periods. In parentheses, we note whether the level or growth rate of the variable remains
above or below its norm in the post-crisis period.
Several features are worth noting. First, the analysis of the data does bear out that
banking crises have more lingering deleterious effects on economic activity than currency crises.
This is evident in several of the indicators. While the 12-month change in output remains below
its norm in periods of tranquility for (on average) 10 months following the currency crash, it
takes nearly twice that amount of time to recover following the banking crisis. This more
sluggish recovery pattern is also evident in imports, which take about 2 ½ years to return to their
norm. The weakness in asset prices, captured here by equity returns that are below the norm,
persist for 30 months on average for banking crises, more than twice the time it takes to recover
from a currency crash.
There are hypotheses that may explain the more protracted nature of the recovery
following the banking crises. It is the case that the bulk of the banking crises in this sample were
also accompanied by currency crises, and that the “twin” crises are more severe, as argued in
Table 7.1 The aftermath of financial crises
(Average number of months it takes a variable to return to “normal” behavior after the crisis)1
Indicator Banking crisis Currency crisis
Bank deposits 30 (below) 12 (above)
Domestic credit/GDP2 15 (above) 9 (above)
Exports 20 (below) 8 (below)
“Excess” M1 balances 9 (above) 8 (below)
Imports 29 (below) 18 (below)
Lending-deposit rate ratio 0 3 (above)
M2 multiplier 7 (above) 21 (below)
M2/reserves 15 (above) 7 (above)
Output 18 (below) 10 (below)
Real exchange rate 8 (below-overvalued) 23 (above-undervalued)
Real interest rate3 15 (above) 7 (below)
Real interest rate differential 15 (above) 7 (below)
Stock prices 30 (below) 13 (below)
Terms-of-trade 4 (below) 9 (below)
1
We note in parentheses whether the variable remained below or above the norm during periods of tranquility.
2
Domestic credit/GDP remains above normal levels largely as a result of the decline in GDP following the crisis.
3
The disparity between the post-crisis behavior of real interest rates lies in the fact that a large share of the currency crises occurred in the 1970s, when interest rates were controlled and not very informative about market conditions.
the case, and these hypotheses are not mutually exclusive, that a currency crisis may cut off
external sources of funding, while a banking crisis cuts off both external and domestic sources of
funding for households and firms. In other words, the credit crunch is more severe. A third
possibility has to do with the distribution of crises across the sample. The currency crises are
roughly evenly distributed between the pre- and post-liberalization periods, while the banking
crises are bunched in the 1980s and 1990s. To the extent that crises have become more severe
issue we will take up later.
Secondly, the table highlights that there are likely to be important sectoral differences in
the pace of recovery, depending also on the type of crisis it is. For instance, following the
devaluations that characterize the bulk of the currency crises, exports recover relatively quickly
and ahead of the rest of the economy at large. However, following banking crises exports
continue to sink for nearly two years following the onset of the crisis. This may be possibly due
[image:6.612.77.525.360.468.2]to a persistent overvaluation, high real interest rates, or a “credit crunch” story.
Table 7.2 The protracted nature of banking crises: Time elapsed from beginning of crisis to its peak
Descriptive statistics Number of months
Mean 19
Minimum 0
Maximum 53
Standard deviation 17
Source: Based on Kaminsky and Reinhart (1996).
Table 7.2 highlights the protracted nature of banking crises by showing the average
number of months elapsed from the beginning of the crisis to its zenith for the 26 banking crises
studied in the Kaminsky and Reinhart (1996) sample. Hence, on average it take a little over a
year-and-a-half for a banking crisis to ripen; in some instances it has taken over four years. This
protracted profile is, in part, due to the fact that often the financial sector problems do not begin
with the major banks, but rather, with more risky finance companies. As the extent of leveraging
that lead to higher interest rates and lower asset values. Defaults increase and the problems
spread to the larger institutions. If there are banks runs, such as in Venezuela in 1994, the spread
to the larger institutions may take less time.
However, the information presented in Table 7.2 does not fully disclose the length of
time that the economy may be weighed down by banking sector problems, as it does not provide
information on the time elapsed between the crisis peak and its ultimate resolution.
Rojas-Suarez and Weisbrod (1996), who examine the resolution of several banking crises in Latin
America, highlight the sluggishness of the resolution process in many episodes. The Japanese
banking crisis, which has spanned most of the 1990s and is ongoing, is a recent example of this
sluggish recognition/admission/resolution process.
We next focus on the evolution in the aftermath of crises of two of the most closely
followed macroeconomic indicators. Table 7.3 presents the time profile of pre- and post-crises
GDP growth and inflation. We distinguish between the moderate inflation and high inflation
countries; the latter encompass mostly Latin American countries. The numbers for all countries
represent an average of the 89 currency crises in our sample.
While devaluations are usually perceived to be expansionary in industrial countries, this
is reflected in the assumed policy trade-off in many second generation models of currency crises,
which stress the policymakers conflict between the credibility losses incurred if the peg is
abandoned and the economic gains from devaluation. This may be an adequate representation
for industrial countries--witness the sharp recovery in the United Kingdom following its
floatation of the pound during the ERM crisis. However, as Table 7.2 highlights devaluations, at
There are numerous theoretical explanations for this phenomenon.1
Table 7.2 Inflation and growth in the aftermath of currency crises
Indicator average of t-1
and t-2
t t+1 t+2 t+3
Real GDP growth: all countries
3.3 1.0 1.8 3.1 2.9
Real GDP growth: moderate inflation
countries1
3.5 2.1 2.4 3.3 4.0
Real GDP growth: high-inflation countries
3.0 -0.6 1.0 3.1 1.7
Inflation: moderate
inflation countries 14.0 15.7 18.0 15.7 14.8
High inflation countries 270.9 732.8 394.8 707.4 964.7
1
Moderate inflation countries are those with inflation rates below 100 percent in all years surrounding the crisis; high inflation countries are those in which inflation exceeded 100 percent in at least one year.
Typically, devaluations are associated with recessions which are manifested in either an
outright contraction in output or a slowdown relative to trend. The recessions appear to be more
severe among the high inflation countries. This may be because inflation itself has adverse
effects on growth (see Fischer, 1993) or because high inflation countries may be even more
deprived from access to international credit than their low inflation counterparts. The evidence
presented in Cantor and Packer (1996a) does, indeed, show that credit ratings penalize high
inflation. It takes about two years to return to the pre-crisis growth rate.
These results are further borne out by the existing empirical literature that has examined
the consequences of devaluations. Table 7.3 presents a brief synopsis of the results that emerge
from these papers. In most cases, devaluations are found to be contractionary, with its negative
impact diminishing, usually, within two years.2 Morley (1992) concludes that the reason some
of the earlier studies which are largely focused on devaluations during the 1950s and 1960s find
milder recessions and even positive output consequences is that many of those devaluation
episodes occurred in the context of trade liberalization and exchange market reform--not in the
context of balance of payments crises as most of the devaluations for the later sample. In this
regard, greater weight has to be placed on the more recent episodes, if one wishes to infer what
the implications for Asia are.
As to inflation, devaluations are, as predicted by theory, inflationary. Table 7.2 shows
that inflation pick up in the two years following the devaluation in both moderate- and
high-inflation countries. The increase is far more dramatic for high-high-inflation countries, where
inflation remains at a substantially higher level following the crisis (usually because of recurring
devaluations at an accelerating rate). For the moderate-inflation countries inflation returns to its
pre-crisis rate in about three years. These patterns are consistent with those found by
Borensztein and DeGregorio (1998) for their 19 devaluation episodes in low- and high-inflation
countries. The results of the various empirical studies presented in Table 7.3 are fairly consistent
in this regard. To summarize, devaluations are inflationary, the passthrough is incomplete
(hence, these lead to real depreciations), and the inflationary consequences for
moderate-inflation countries appear to disappear somewhere between two and three years following the
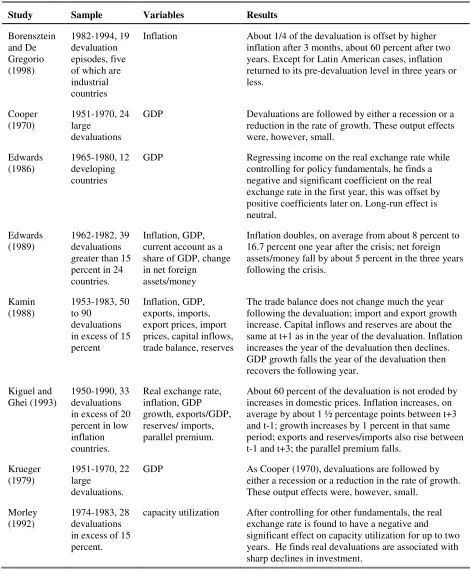
Table 7.3. The wake of devaluations: A review of the literature
Study Sample Variables Results
Borensztein and De Gregorio (1998) 1982-1994, 19 devaluation episodes, five of which are industrial countries
Inflation About 1/4 of the devaluation is offset by higher inflation after 3 months, about 60 percent after two years. Except for Latin American cases, inflation returned to its pre-devaluation level in three years or less. Cooper (1970) 1951-1970, 24 large devaluations
GDP Devaluations are followed by either a recession or a reduction in the rate of growth. These output effects were, however, small.
Edwards (1986)
1965-1980, 12 developing countries
GDP Regressing income on the real exchange rate while controlling for policy fundamentals, he finds a negative and significant coefficient on the real exchange rate in the first year, this was offset by positive coefficients later on. Long-run effect is neutral.
Edwards (1989)
1962-1982, 39 devaluations greater than 15 percent in 24 countries.
Inflation, GDP, current account as a share of GDP, change in net foreign
assets/money
Inflation doubles, on average from about 8 percent to 16.7 percent one year after the crisis; net foreign assets/money fall by about 5 percent in the three years following the crisis.
Kamin (1988)
1953-1983, 50 to 90
devaluations in excess of 15 percent
Inflation, GDP, exports, imports, export prices, import prices, capital inflows, trade balance, reserves
The trade balance does not change much the year following the devaluation; import and export growth increase. Capital inflows and reserves are about the same at t+1 as in the year of the devaluation. Inflation increases the year of the devaluation then declines. GDP growth falls the year of the devaluation then recovers the following year.
Kiguel and Ghei (1993)
1950-1990, 33 devaluations in excess of 20 percent in low inflation countries.
Real exchange rate, inflation, GDP growth, exports/GDP, reserves/ imports, parallel premium.
About 60 percent of the devaluation is not eroded by increases in domestic prices. Inflation increases, on average by about 1 ½ percentage points between t+3 and t-1; growth increases by 1 percent in that same period; exports and reserves/imports also rise between t-1 and t+3; the parallel premium falls.
Krueger (1979)
1951-1970, 22 large
devaluations.
GDP As Cooper (1970), devaluations are followed by either a recession or a reduction in the rate of growth. These output effects were, however, small.
Morley (1992)
1974-1983, 28 devaluations in excess of 15 percent.
Some caveats
The preceding discussion has suggested a “representative time profile” for the recovery
process in the wake of currency and, to a lesser extent, banking crises. This “representative time
profile” suggests growth will return to normal within two years of the crisis and the inflationary
consequences of the devaluation will abate within three years. Yet, this pattern would hardly
describe the recovery protracted process of many of the Latin American economies during the
1980s, even Chile’s relatively more rapid recovery.3
Obviously, the speed at which the economy recovers will be heavily influenced by how
policymakers respond to the crisis as well as be external conditions. The high level of
international real interest rates in the 1980s (the highest levels since the 1930s) were hardly
conducive to speeding the recovery process. In what follows, we will argue, as in Kaminsky and
Reinhart (1998), that the severity of the crisis may also play an important role in determining the
swiftness or sluggishness of the healing process. Furthermore, the 1997-98 crises in Asia are
significantly more severe that the historical crises in that region. Hence, extrapolation from past
patterns, if those patterns have changed, may be of limited use.
3 Chile’s inflation rate was in single digits when it abandoned its crawling peg policy in
To analyze this issue formally, we measure the severity of currency and banking crises as
in Kaminsky and Reinhart (1996). For banking crises, the measure of severity is simply given by
the cost of the bailout of the banking sector expressed as a share of GDP. For currency crises,
we construct an index that gives equal weights to reserve losses and currency depreciation. This
index is centered on the month of the currency crisis and it combines the percentage decline in
foreign exchange reserves in the six months prior to the crisis, since reserve losses typically
occur before the central bank capitulates and the depreciation of the currency in the six months
following the abandonment of the existing exchange rate arrangement, be it a peg or a band.
This latter component captures the magnitude of the currency meltdown.
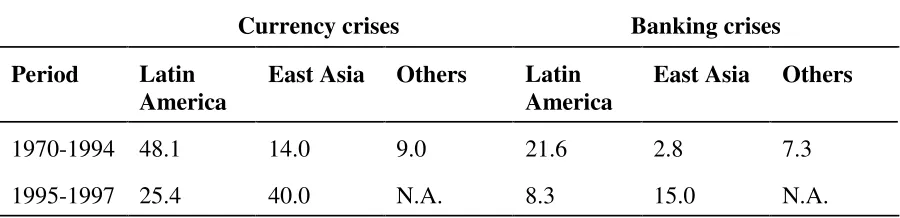
Table 7.5 presents these measures of severity for the 76 currency crises and 26 banking
crises in the Kaminsky-Reinhart sample. For the 1970-1994 sample currency and banking crises
were far more severe in Latin America than elsewhere. The crises in East Asia, by contrast, were
relatively mild and not that different by these metrics from the crises in the European countries
that largely represent the “others” group. This divergence may also help explain the subpar
performance of the high inflation countries during the recovery process (Table 7.2). The picture
that emerges during 1995-1997 is distinctly different. The Latin American crises include those
of Mexico and Argentina in late 1994 and early 1995. While the latter, did not devalue, it
sustained major reserve losses associated with a series of bank runs that left the level of bank
deposits by mid-March 1995 about 18-19 percent below their level prior to the devaluation of the
Both in terms of this measure of the severity of the currency crisis, as well as the
estimated costs of bailing out the banking sector, the severity of the Asian crises surpasses that
of their Latin American counterparts in the 1990s and it is a significant departure from its
historic regional norm. Hence, to the extent that the initial virulence of the disease influences
the speed of the healing process, the recovery for Asia may be more protracted or more anemic
[image:14.612.77.527.294.403.2]than the historic norm.
Table 7.5 The severity of crises: Then and now
Currency crises Banking crises
Period Latin America
East Asia Others Latin America
East Asia Others
1970-1994 48.1 14.0 9.0 21.6 2.8 7.3
1995-1997 25.4 40.0 N.A. 8.3 15.0 N.A. Source: Kaminsky and Reinhart (1998a).
REFERENCES
Agenor, Pierre-Richard, Jagdeep S. Bhandari, and Robert P. Flood. 1992. “Speculative Attacks and Models of Balance of Payments Crises.” IMF Staff Papers 39 (June), 357–94.
Bank of International Settlements. 1998. The Maturity, Sectoral, and Nationality Distribution of International Bank Lending. Basle: Bank for International Settlements.
Berg, Andrew, and Catherine Patillo. 1999. “Are Currency Crises Predictable? A Test.” forthcoming in Journal of International Money ad Finance, (August).
Blanco, Herminio, and Peter M. Garber. 1986. “Recurrent Devaluation and Speculative Attacks on the Mexican Peso.” Journal of Political Economy, 94 (February ), 148–66.
Calomiris, Charles, 1997. The Post Modern Bank Safety Net: Lessons from Developed and Developing Countries. Washington, DC: American Enterprise Institute.
Calvo, Guillermo A. 1998. “Varieties of Capital-Market Crises.” In Guillermo A. Calvo and M. King The Debt Burden and Its Consequences for Monetary Policy. New York:
MacMillan Press.
Calvo, Guillermo A., Morris Goldstein. 1996. “What Role for the Official Sector? “In
Guillermo A. Calvo, Morris Goldstein, and Eduard Hochreiter Private Capital Flows to Emerging Markets After the Mexican Crisis, Washington: Institute for International Economics, 233-82.
Calvo, Guillermo A., and Enrique Mendoza. 1996. “Mexico's Balance-of-Payments Crisis: A Chronicle of A Death Foretold,” Journal of International Economics 41, No. 3/4, (November), 235-264.
Calvo, Sara, and Carmen M. Reinhart. 1996. “Capital Flows to Latin America: Is There
Evidence of Contagion Effects?.” In Guillermo A. Calvo, Morris Goldstein, and Eduard Hochreiter Private Capital Flows to Emerging Markets After the Mexican Crisis, Washington: Institute for International Economics, 151–71.
Cantor, Richard, and Frank Packer. 1996a. “Determinants and Impact of Sovereign Credit Ratings,” Federal Reserve Bank of New York Economic Policy Review, (October), 1-15.
Cantor, Richard, and Frank Packer. 1996b. “Sovereign Risk Assessment and Agency Credit Ratings,” European Financial Management, Vol. 2, 247-56.
Caprio, Gerald, Jr. and, Klingebiel, Daniela. 1996a. “Bank Insolvency: Bad Luck, Bad Policy, or Bad Banking?” in Annual World Bank Conference on Development Economics. Washington, DC: The World Bank, 79-104.
.Caprio, Gerald, Jr. and, Klingebiel, Daniela. 1996b. “Bank Insolvency: Cross-country Experiences.” Unpublished paper.
Cooper, Richard. 1971. “Currency Devaluation in Developing Countries.” In G. Ranis,
Government and Economic Development, New Haven: Yale University Press.
Corsetti, Giancarlo, Paolo Pesenti, and Nouriel Poubini. 1997. "What Caused the Asian Currency and Financial Crisis?". Unpublished paper.
Cumby, Robert, and Sweder van Wijnbergen. 1989. “Financial Policy and Speculative Runs with a Crawling Peg: Argentina 1979–81,” Journal of International Economics 17 (August), 111–27.
Demirguç-Kunt, Asli, and Enrica Detragiache. 1998. “Banking Crises Around the World: Are There Any Common Threads.” IMF Staff Papers, (March).
Diamond, Douglas, and Phillip Dybvig. 1983. “Bank Runs, Liquidity, and Deposit Insurance.”
Diebold, Francis and Glen Rudebusch. 1989. “Scoring the Leading Indicators.” Journal of Business 62, No. 3 (July), 369-91.
Dooley, Michael P. 1997. “A Model of Crises in Emerging Markets.” National Bureau of Economic Research Working Paper No. 6300. Cambridge: National Bureau of Economic Research
Dornbusch, Rudiger, Ilan Goldfajn, and Rodrigo O. Valdés. 1995. “Currency Crises and Collapses,” Brookings Papers on Economic Activity, No. 2, 219–95.
Doukas, John. 1989. “Contagion Effect on Sovereign Interest Rate Spreads.” Economic Letters 29, 237-41.
Edwards, Sebastian. 1986. “Are Devaluations Contractionary?” Review of Economics and Statistics 68, 501-08.
Edwards, Sebastian. 1989. Real Exchange Rates, Devaluation, and Adjustment: Exchange Rate Policy in Developing Countries. Cambridge, Massachusetts: MIT Press.
Eichengreen, Barry, Andrew Rose, and Charles Wyplosz. 1995. “Exchange Market Mayhem: The Antecedents and Aftermath of Speculative Attacks.” Economic Policy 21 (October), 249–312.
Eichengreen, Barry, Andrew Rose, and Charles Wyplosz. 1996. “Contagious Currency Crises,” National Bureau of Economic Research Working Paper 5681, (July).
Eichengreen, Barry, Andrew Rose. 1997. “Staying Afloat When the Wind Shifts: External Factors and Emerging-Market Banking Crises.” Unpublished paper.
Eschweiler. 1997. Did the Market See the Asian Crisis Coming? Unpublished paper.
Fischer, Stanley. 1993. “The Role of Macroeconomic Factors on Growth,” Journal of Monetary Economics 32 (3), 395-415.
Frankel, Jeffrey A., and Andrew K. Rose. 1996. “Exchange Rate Crises in Emerging Markets.”
Furman, Jason, and Joseph E. Stiglitz. 1998. “Economic Crises: Evidence and Insights from East Asia.” Forthcoming in Brookings Papers on Economic Activity 2, (June).
Galbis, Vicente. 1993. “High Real Interest Rates Under Financial Liberalization: Is There a Problem?.” International Monetary Fund Working Paper WP/93/7, January.
Gavin, Michael, and Ricardo Hausman. 1996. “The Roots of Banking Crises: The
Macroeconomic Context.” In Banking Crises in Latin America. Washington, DC: Inter-American Development Bank, 27-63.
Gerlach, Stefan, and Frank Smets. 1994. “Contagious Speculative Attacks.” CEPR Discussion Paper No. 1055, (November), London: Center for Economic Policy Research.
Goldstein, Morris. 1996. “Presumptive Indicators/Early Warning Signals of Vulnerability to Financial Crises in Emerging Market Economies.” Unpublished paper.
Goldstein, Morris. 1997. “The Case for an International Banking Standard.” Policy Analyses in International Economics 47, (April), Washington, DC: Institute for International
Economics.
Goldstein, Morris. 1998a. “Early Warning Indicators and The Asian Financial Crisis” Unpublished paper.
Goldstein, Morris, 1998b. The Asian Financial Crisis: Causes, Cures, and Systemic
Implications.”Policy Analyses in International Economics 55, (June), Washington, DC: Institute for International Economics.
Goldstein, Morris. 1998. “Commentary: The Causes and Propagation of Financial Stability: Lessons for Policy makers. In Federal reserve Bank of Kansas City Maintaining
Financial Stability in a Global Economy. Kansas City: Federal Reserve Bank of Kansas City.
Goldstein, Morris. 1998. “Banking Crises: International Experience. In Gerard Caprio, George Kaufman, and Danny Leipziger Preventing Banking Crises. Chicago: Federal Reserve Bank of Chicago; Washington, DC: The World Bank. Forthcoming.
and Policy Options.” Bank for International Settlements Economic Paper No. 46, (October). Basle: Bank for International Settlements.
Goldfajn, Ilan, and Rodrigo O.Valdés. 1995 “Balance of Payments Crises and Capital Flows: The Role of Liquidity.” Unpublished paper.
Goldfajn, Ilan, and Rodrigo O.Valdés. 1998. “Are Currency Crises Predictable?,” European Economic Review, forthcoming.
Honohan, Patrick. 1997. “Banking System Failures in Developing and Transition Countries: Diagnosis and Prediction.” Bank for International Settlements Working Paper No. 39, (January).
International Monetary Fund. 1997a. International Capital Markets, (September). Washington: International Monetary Fund.
International Monetary Fund. 1998a. World Economic Outlook, (May). Washington: International Monetary Fund.
International Monetary Fund. 1998b. International Capital Markets, (September). Washington: International Monetary Fund.
International Monetary Fund. 1998c. World Economic Outlook, (October). Washington: International Monetary Fund.
Kamin, Steven B.. 1988. “Devaluation, External Balance, and Macroeconomic Performance: A Look at the Numbers,” Studies in International Finance, No. 62, (August). Princeton: Princeton University, Department of Economics, International Finance Section.
Kamin, Steven B., and John H. Rogers. 1997. “Output and the Real Exchange Rate in Developing Countries: An Application to Mexico,” Unpublished paper.
Kaminsky, Graciela L., and Carmen M. Reinhart. 1996. “The Twin Crises: The Causes of Banking and Balance-of-Payments Problems,” International Finance Discussion Paper No. 544, (March). Washington: Board of Governors of the Federal Reserve.
Forthcoming in American Economic Review.
Kaminsky, Graciela, and Carmen M. Reinhart. 1998a. “Financial Crises in Asia and Latin America: Then and Now.” American Economic Review 88, No.2 ( May). 444-48.
Kaminsky, Graciela, and Carmen M. Reinhart. 1998b. “On Crises, Contagion, and Confusion.” Unpublished paper.
Kiguel, Miguel A., and Nita Ghei. 1992. “Devaluation in Low-Inflation Economies,” Policy Research Working Paper 1224. Washington: The World Bank.
Krueger, Anne O. 1978. Liberalization Attempts and Consequences, Cambridge, MA: Ballinger.
Krugman, Paul. 1979. “A Model of Balance of Payments Crises.” Journal of Money, Credit, and Banking 11 (August), 311–25.
Krugman, Paul. 1998. “What Happened to Asia?.” Unpublished paper.
Larraín, Guillermo, Helmut Reisen, and Julia von Maltzan. 1997. “Emerging Market Risk and Sovereign Credit Ratings,” OECD Development Centre Technical Papers No. 124, (April). Paris: The Organisation for Economic Co-operation and Development.
Lee, Suk Hun. 1993. “Are the Credit Ratings Assigned by Bankers Based on the Willingness of Borrowers to Repay?,” Journal of Development Economics 40, (April), 349-59.
Leiderman, Leonardo, and Alfredo Thorne. 1996. In Private Capital Flows to Emerging Markets After the Mexican Crisis, ed. by Guillermo A. Calvo, Morris Goldstein, and Eduard Hochreiter Washington, DC: Institute for International Economics, 1–43.
Lizondo, Saul, and Peter J. Montiel. 1989. “Contractionary Devaluation in Developing Countries: An Analytical Overview.” IMF Staff Papers 36 (March), 182-227.
Meese, Richard A., and Kenneth Rogoff. 1983. “Empirical Exchange rate Models of the Seventies: Do They Fit Out of Sample?” Journal of International Economics 14 (February), 3-24.
Mishkin, Frederic S. 1996. “Understanding Financial Crises: A Developing Country Perspective,” in Annual World Bank Conference on Development Economics, Washington, DC: World Bank, 29-62.
Moore, Geoffrey H. 1959. “The 1957-58 Business Contractions: New Model or Old? American Economic Review 49 (May), 292-308.
Morley, Samuel A.1992. “On the Effect of Devaluation During Stabilization Programs in LDCs,” Review of Economics and Statistics 74 No.1 (February), 21-7.
Obstfeld, Maurice, and Kenneth Rogoff. 1995. “The Mirage of Fixed Exchange Rates,” Journal of Economic Perspectives 9, (Fall), 73-96.
Radelet, Steven, and Jeffrey Sachs. 1998. “The East Asian Financial Crisis: Diagnosis, Remedies, Prospects,”Brookings Papers on Economic Activity, 1.
Rojas-Suarez, Liliana. 1998. “Early Warning Indicators of Banking Crises: What Works for Emerging Markets? With Applications to Latin America,” Unpublished paper.
Rojas-Suarez, Liliana, and Steven R. Weisbrod. 1995. Financial Fragilities in Latin America: The 1980s and 1990s. International Monetary Fund Occasional Paper 132, (October). Washington,DC: International Monetary Fund.
Rose, Andrew K., and Lars E.O. Svensson. 1994. “European Exchange Rate Credibility Before the Fall.” European Economic Review 38 (May), 1185-1216.
147–215.
Stock, James H., and Mark W. Watson. 1989. “New Indices of Coincident and Leading Economic Indicators.” NBER Macroeconomics Annual, 351-93.
Sundararajan, V. and Baliño, Tomas. 1991. Banking Crises: Cases and Issues. Washington, DC: International Monetary Fund.
Valdés, Rodrigo O. 1997. “Emerging Markets Contagion: Evidence and Theory.” Unpublished paper.
Velasco, Andres. 1987. “Financial and Balance of Payments Crises: A Simple Model of the Southern Cone Experience.” Journal of Development Economics 27 (October ), 263–83.
Wolf, Holger C. 1997. “Regional Contagion Effects in Emerging Markets.” Princeton University Working Papers in International Finance, G-97-03, (October).
APPENDIX A: DATA AND DEFINITIONS
Crisis index: The index is a weighted average of exchange rate and reserve changes, with
weights such that the two components of the index have equal conditional volatilities. Since
changes in the exchange rate enter with a positive weight and changes in reserves have a
negative weight attached, readings of this index that were three standard deviations or more
above the mean were cataloged as crises. For countries in the sample that had hyperinflation,
the construction of the index was modified. While a 100 percent devaluation may be traumatic
for a country with low-to-moderate inflation, a devaluation of that magnitude is commonplace
during hyperinflations. A single index for the countries that had hyperinflation episodes would
miss sizable devaluations and reserve losses in the moderate inflation periods, since the historic
mean is distorted by the high-inflation episode. To avoid this, we divided the sample according
to whether inflation in the previous six months was higher than 150 percent and then
constructed an index for each subsample. Our cataloging of crises for these countries coincides
fairly tightly with our chronology of currency market disruptions. Eichengreen, Rose, and
Wyplosz (1995) also include interest rates in this index, however, our data on
market-determined interest rates for developing countries does not span the entire sample.
The indicators:
Sources: International Financial Statistics (IFS), International Monetary Fund; Emerging
Market Indicators, International Finance Corporation (IFC); World Development Indicators, the
World Bank, when data was missing from these sources, central bank bulletins and other
country-specific sources were used as supplements. Unless otherwise noted, we used 12-month
percent changes.
2. Domestic credit/nominal GDP: IFS line 52 divided by IFS line 99b (interpolated). Monthly
nominal GDP was interpolated from annual or quarterly data.
3. Real interest rates on deposits: IFS line 60l, monthly rates, deflated using consumer prices
(IFS line 64) expressed in percentage points.
4. The ratio of lending rates to deposit rates: IFS line 60p divided by IFS line60l; was used in
lieu of differentials to ameliorate the distortions caused by the large percentage point spreads
observed during high inflation. In levels.
5. “Excess” real balances: M1 (IFS line34) deflated by consumer prices (IFS line 64) less an
estimated demand for money. The demand for real balances is determined by real GDP
(interpolated IFS line99b), domestic consumer price inflation, and a time trend. Domestic
inflation was used in lieu of nominal interest rates, as market-determined interest rates were not
available during the entire sample for a number of countries; the time trend (which can enter
log-linearly, linearly, or exponentially) is motivated by its role as a proxy for financial
innovation and/or currency substitution. Excess money supply (demand) during pre-crisis
periods (mc) is reported as a percent relative to excess supply (demand) during tranquil times
(mt)--that is, 100 x (mc-mt)/mt.
6. M2 (in US dollars)/reserves (in US dollars): IFS lines 34 plus 35 converted into dollars
(using IFS line ae) divided by IFS line 1L.d.
7. Bank deposits: IFS line 24 plus 25.
8. Exports (in US dollars): IFS line 70.
9. Imports (in US dollars): IFS line 71.
(IFS line 75). For those developing countries where import unit values (or import price indices)
were not available, an index of prices of manufactured exports from industrial countries to
developing countries was used.
11. The real exchange rate: This measure used is based on consumer price indexes (IFS lines
64) and is defined as the relative price of foreign goods (in domestic currency) to the price of
domestic goods. If the central bank of the home country pegs the currency to the dollar
(Deutsche mark), the relevant foreign price index is that of the United States (Germany). Hence,
for all the European countries the foreign price index is that of Germany while for all the other
countries, consumer prices in the United States were used. The trend was specified as,
alternatively, log-linear, linear, and exponential; the best fit among these was selected on a
country-by-country basis. Deviations from trend during crisis periods (dc) were compared to
the deviations during tranquil times (dt) and are shown in Figures 2 and 3 as a percent of the
deviations in tranquil times (i.e.,100 x (dc-dt)/dt).
12. Reserves: IFS line 1L.d.
13. Domestic-foreign interest rate differential on deposits: Monthly rates in percentage
points. IFS lines 60l. Interest rates in the home country are compared with interest rates in the
United States (Germany) if the domestic central bank pegs the currency to the dollar (Deutsche
14. Output: For most countries, the measure of output used is industrial production (IFS
line 66). However, for some countries (the commodity exporters) an index of output of
primary commodities is used (IFS lines 66aa).
15: Stock returns (in dollars): IFC global indices are used for all emerging markets; for
industrial countries the quotes from the main bourses are used.