http://dx.doi.org/10.4236/jsip.2015.62016
Effect of Diversity and Filtering on the
Performance of Wavelet Packets Base
Multicarrier Multicode CDMA System
Maryam M. Akho-Zahieh, Nasser Abdellatif
Department of Electrical and Computer Engineering, Applied Science Private University, Amman, Jordan Email: [email protected], [email protected], [email protected]
Received 13 April 2015; accepted 24 May 2015; published 28 May 2015 Copyright © 2015 by authors and Scientific Research Publishing Inc.
This work is licensed under the Creative Commons Attribution International License (CC BY).
http://creativecommons.org/licenses/by/4.0/
Abstract
In Wavelet Packets Based Multicarrier Multicode CDMA system, the multicode (MCD) part ensures the transmission for high speed and flexible data rate, the multicarrier (MC) part ensures the flex-ibility of handling multiple data rates, and wavelet packets modulation technique contributes to the mitigation of the interference problems. The CDMA system can suppress a given amount of in-terference. In this paper, the receiver employs suppression filter (SF) to mitigate the effect of nar-row-band jammer interference and diversity techniques to reduce multiple access interference. The framework for the system and the performance evaluation are presented in terms of bit error rate (BER) over a Nakagami fading channel. Also, we investigate how the performance is influ-enced by various parameters, such as the number of taps of the SF, the ratio of narrow-band inter-ference bandwidth to the spread-spectrum bandwidth, the diversity order, the fading parameter and so on. Finally, the performance of the system is compared with the performance Sinusoidal (Sin) based MC/MCD CDMA system.
Keywords
Wavelet Packets, Multicarrier, Multicode, Diversity, Suppression Filter
1. Introduction
user signals.
It is well known that the inherent processing gain of CDMA system will, in many cases, provide the system with a sufficient degree of narrow-band interference rejection capability. However, if the interference signal is powerful enough, the conventional receiver is ineffective in mitigating this problem. Interference suppression filter (SF) can be employed to reject the narrow-band interference. A wiener-type filter, described in [3], employs a tapped delay line structure to first predict and then subtract out the narrow-band interference. The technique of diversity combining can provide an attractive means for improving system performance by utilizing the signal components of different uncorrelated paths.
In this paper, the WP-MC/MCD-CDMA overlayed with a narrow-band interference binary phase shift keying (BPSK) waveform is analyzed. It is shown that the system performance is improved when the receiver consists of SF combined with diversity. The performance of the system is compared with the Sinusoidal (Sin) based multicarrier multicode CDMA system denoted as Sin-MC/MCD-CDMA.
2. System Model and Description
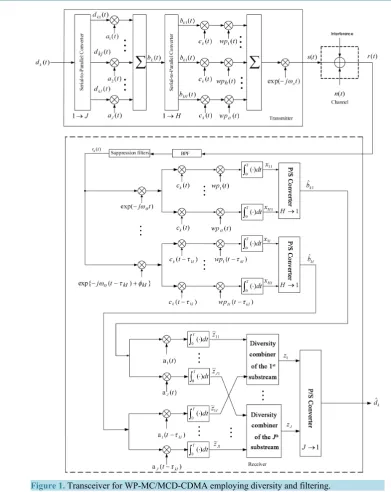
The transceiver block diagram for the system under consideration is shown in Figure 1. The transmitter consists of two parts, multicode part and wavelet packet part, while the receiver consists of a bandpass filter (BPF), tap suppression filter, correlators (multicode and wavelet packet) and the diversity combiner. At the transmitting side for the kth user, the bit stream
( )
( )
i
k i k T JH
T
d t d t i
JH
∞ =−∞
= −
∑
∏
with bit duration TJH is serial-to-
parallel (S/P) converted into J parallel substreams
( )
i(
)
kj i kj T H
d t ∞ d t iT H
=−∞
=
∑
∏
− . To reduce the inter-substream interference (ISSI) resulting from the interference between the J substreams themselves, each sub- stream with bit duration T
H is coded by an orthogonal signal
( )
(
)
10 c
c N i
j i j T c
a t =
∑
=−a∏
t iT− , where Nc is thecode length and c c
T T
HN
= is the chip duration. To maintain orthogonality of the coding signals, the maximum
number of substreams J is limited to Nc. The coded substreams are added and the resulting signal
( )
J1( ) ( )
k j j kj
b t =
∑
=a t d t is again S/P converted into H superstreams, b tkh( )
=∑
Jj=1dkjh( ) ( )
t a tj . The next step is the spreading of the H coded superstream by( )
n01(
)
n N i
k i k T n
c t −c t iT
=
=
∑
∏
− which is the pseudo-random noise (PN, processing gain) sequence of the kth user. The length of code and chip duration aren
N and
n n
T T
N
= , respectively. Note that i j a , i
kj
d and i k
c which are the ith bits ∈ ±
{ }
1 with probabilities( )
1( )
1 12
P =P − = . The spreading superstreams will be used to modulate a wavelet packets wp th
( )
=∑
iw t iTh(
− n)
, where w th( )
is as given in [1]. The resultant superstreams are summed up and modulated by a sinusoidal carrier, exp(
j tωo)
, before being transmitted. The wavelet packets with different h indices represent different subbands, thus the bandwidth of each subband can be arbitrarily chosen due to flexibility of the wavelet packets. Also, the whole signal spectrum is separated into H disjoint subbands. The partition of subbands are not limited by a minimum frequency distance but is determined by the channel characteristic. Furthermore, the energy of( )
h
w t is unity. The transmitted signal s tk
( )
for the of the kth user can be written as [1]( )
( ) ( ) ( )
( )
(
)
1 1
2 H J exp ,
k kjh j k h o
h j
s t P Re d t a t c t wp t j tω = =
=
∑∑
(1)where dkjh
( )
t with period T is the data symbol of kth user, jth substream of the hth superstream. The equivalent impulse response for the channel used in this paper can be written as( )
L1 ejkl(
)
kl kl
l
h t β φ δ t τ
=
=
∑
− ,where L is the number of propagation paths, βkl, φkl and τkl are respectively, the path gain, the phase delay
and the time delay of lth path of the kth user. The phase kl
Figure 1. Transceiver for WP-MC/MCD-CDMA employing diversity and filtering.
[
0,2π]
. The path gain model and distribution function depend on the nature of the channel and the propagation environment. We assume that the channel path gain βkl is Nakagami distributed [4]. The output of the channelfor the kth user,
( )
( ) ( )
k k
y t =Re s t h t ∗ .
The receiver shown in Figure 1 is assumed to be synchronous, designed to detect the first substream of the first user’s first wavelet packet propagating via the first path. The received signal, r t
( )
, is given by( )
( ) ( )
( )
(
) (
)
(
)
(
) (
)
(
) (
)
( )
( )
1 1 1 1
2
cos sin ,
K H J L
kl j kl k kl h kl
k h j l
I Q
kjh kl o kl kjh kl o kl
r t y t n t t
P a t c t wp t
d t t d t t n t t
β τ τ τ
τ ω θ τ ω θ
= = = =
= + + ℑ
= − − −
× − + + − + + + ℑ
where I kjh
d and Q kjh
d are the inphase part and quadrature part of dkjh, respectively, θkl =φkl−ω τc kl and
( )
n t is the AWGN. The BPSK narrow-band interference jammer, ℑ(t), is given by:
( )
t 2 j t( )
cos 2 π(
fo)
t ψℑ = ℑ + ∆ + (3) where ℑ is the jammer power, ∆ is the offset between the jammer carrier and the signal carrier and ψ is the jammer phase. The information sequence j t
( )
has a bit rate 1Tj where Tj denotes the duration of onebit. The interference bandwidth is Bj=2Tj, we assume Bj <Bs. An important quantity is the ratio of the
interference band to system bandwidth j n
s j
B T p
B T
= = . The received signal is first passed through the BPF
having band width Bs equal to the spread spectrum (SS) bandwidth = 2Tn−1, which removes the out-of band noise and let the desired signal and inferences pass without distortion. The filtered signal is then passed through a suppression filter which has an impulse response given by
( )
2(
)
1
M
s m n
m M
h t α δ t mT
=−
=
∑
− where α0 =1 and (M1 & M2) which are ≥0 represent the number of taps of the filter on the left and right of the center tap [3]. For each tap, the output of the filter r ts( ) ( )
=r t h t∗ s( )
is given by:( )
(
) (
)
(
)
(
)
(
)
(
)
(
)
(
)(
)
}
2
1 1 1 1 1
2
cos
ˆ 2 cos 2π
M K H J L
s m kl j kl n k kl n
m M k h j l
m
h kl n kjh kl n o kl
m n m n o n
r t P a t mT c t mT
wp t mT d t mT t
n t mT j t mT f t mT
α β τ τ
τ τ ω θ
α α ψ
= = = = =
= − − − −
× − − − − +
+ − + ℑ − + ∆ − +
∑
∑∑∑∑
(4)
where K is the total number of users, m
kl kl mTn o
θ =θ − ω and n t mTˆ
(
− n)
is the filtered AWGN.The output of the filter, r ts
( )
, is demodulated by a local oscillator, despread by a user specific code sequence, multiplied by the wavelet packets and correlated over a period T to recover the super bit stream. The resulting data is then parallel-to-serial (P/S) converted again, despread by the code a t( )
correlated over a period T, and then combined by diversity combiner. Finally, each combiner output for J substreams is P/S converted to recover d tˆk( )
. The output of the first correlator in the wavelet packet part denoted as x1 can be written as( ) ( )
( )
( )
( )
1 1 1 1 1 1 1 11 0 1 1 cos sin d , ,
T
s o o DS DSI MPI MCDI WPI MUI
x = r t c t wp t ωt − j ω t t x= +x +x +x +x +x +n∗ + ℑ∗
∫
(5)where 1 DS
x is the desired signal, 1 DSI
x is the self interference, 1 MPI
x is the multipath interference, 1 MCDI x is the multicode interference, 1
WPI
x is the wavelet packets interference, 1
MUI
x is the multiuser interference, n∗1 is suppressed correlated AWGN and ℑ∗
( )
t is the suppressed narrowband interference. The output signal of first P S converter for the first user's may be written as1 1
1
ˆ H h h h h h h .
DS DSI MPI MCDI WPI MUI h
b x x x′ x ′ x′ x′ n∗′ ∗′
′=
= + +
∑
+ + + + + ℑ (6)The output for the first correlator z1 in the multicode part is given by
( )
1 1 1 1 1 1 1 11 0ˆ 1 d .
T
DS DSI MPI MCDI WPI MUI
z =
∫
b a t t z× = +z +z +z +z +z +n + ℑ (7) After evaluation it can be shown that( )
( )
1
11 111 111 ,
2 I Q
DS P n
z = β N T d t − jd t (8) and
( )
( )
( )
( )
( )
( )
{
}
( )
( )
( )
{
( )
( )
( )
1 1 1 1
1
1 1
2
2 2 2 2
2 2
1 1
11 11 11 1 1 11 11 1 1
11 11 1 2 11 11 1 2
1
cos sin sin cos
2
cos sin sin cos
m m I m m Q
DSI m
m M
M
m m I m m Q
m m
P
z T j m j m
j m j m
β α θ θ θ θ
α θ θ θ θ
−
=−
− −
=
= × + ϒ + − ϒ
+ + ϒ + − ϒ
∑
∑
w h e r e ϒ1
( )
m1 =d111,0 11 F m( )
1 +d F N m111,1 11(
n+ 1)
, ϒ−1( )
m2 =d111, 1 11 −F m N(
2− n)
+d111,0 11 F m( )
2 , d111, 1 − ,111,0
d are the previous data bit and current data bit, respectively; with =I for inphase part, =Q for
quadrature part. F lk i,
( )
is the discrete-time aperiodic cross-correlation function defined in [5] and is given by( )
( ) ( ) ( ) ( ) 1 1 0 , 1 1 0, 0 1
, 1 0.
n
n N l
j j
k i n
j
k i N l
j j
k i n
j
a a l N
F l
a a N l
− − + = − + − = ≤ ≤ − = − ≤ ≤
∑
∑
The value of the four components 1 MPI z , 1
MCDI
z , 1
WPI
z and 1 MUI
z can be written as given in ([1], Chapter 4) as follows:
( )
( )
( )
( )
{
}
2 1 11 1 1 1 1 1 1
2 cos sin sin cos ,
2
M L
m m I m m Q
MPI m l l l l l
m M l
P
z α β θ j θ χ θ j θ χ
= =
=
∑ ∑
+ + − (10)( )
( )
( )
( )
{
}
2
1
1
1 1 1 1 1 1 1
2 1 cos sin sin cos ,
2
M J L
m m I m m Q
MCDI m l l l j l l j
m M j l
P
z α β θ j θ χ θ j θ χ
= = =
=
∑ ∑∑
+ + − (11)( )
( )
{
( )
( )
}
2
1
1
1 1 1 1 1 1 1
2 1 1 cos sin , sin cos ,
2
M H J L
m m I m m Q
WPI m l l l jh l l jh
m M h j l
P
z α β θ j θ χ θ j θ χ
=− = = =
=
∑ ∑∑∑
+ + − (12)( )
( )
{
( )
( )
}
2
1
1
2 1 1 1 cos sin sin cos ,
2
M K H J L
m m I m m Q
MUI m kl kl kl kjh kl kl kjh
m M k h j l
P
z α β θ j θ χ θ j θ χ
=− = = = =
=
∑ ∑∑∑∑
+ + − (13)where
( )
( )
( )
( )
1 111, 1 11 1 11, 1 1 111,0 11 1 11, 1 1
1 1
ˆ ˆ
H H
l h l l h l
h h
d G m R m d G m R m
χ − τ ′ τ τ ′ τ
′= ′=
=
∑
+ ∑
( )
( )
( )
( )
1 1 1, 1 1 1 11, 1 1 1 1,0 1 1 11, 1 1
1 ' 1
ˆ ˆ
H H
j j j l h l j j l h l
h h
d G m R m d G m R m
χ − τ ′ τ τ ′ τ
′= =
=
∑
+ ∑
( )
( )
( )
( )
1 1 , 1 1 1 11, 1 1 ,0 1 1 11, 1
1 1
ˆ ˆ
H H
jh jh j l h h l jh j l h h l
h h
d G m R m d G m R m
χ − τ ′ τ τ ′ τ
′= ′=
=
∑
+ ∑
( )
( )
( )
( )
, 1 1 1 , ,0 1 1 ,
1 1
ˆ ˆ
H H
kjh kjh j kl k h h kl kjh j kl k h h kl
h h
d G m R m d G m R m
χ − τ ′ τ τ ′ τ
′= ′=
=
∑
+ ∑
where Rhn xy, τkl
( )
m , Rˆhn xy, τkl( )
m are the partial cross-correlation functions; dkjhI , 1− , dkjhI ,0 are the inphase part of previous data bit and current data bit, respectively; dkjhQ, 1− , dkjhQ,0 are the quadrature component of previous data bit and current data bit, respectively. Following the definition in [5] and [6], the partial cross-correlation functions Rhn,xy(τkl) and Rˆhn xy,( )
τkl , can be written as follows:( )
( ) (
)
( )
(
)
, 0kl d ,
hn xy kl h n kl x y kl
R τ =
∫
τ c t c t−τ +T wp t wp t−τ +T t( )
( ) (
)
( )
(
)
,
ˆ d .
kl T
hn xy kl h n kl x y kl
R τ =
∫
τ c t c t−τ wp t wp t−τ tAlso Gxy
( )
. and Gˆ .xy( )
are the partial cross-correlation functions defined in [5] as follows( )
0kl( ) (
)
d ,xy kl x y kl
G τ =
∫
τ a t a t−τ +T t( )
( ) (
)
ˆ d .
kl T
xy kl x y kl
The suppressed correlated AWGN component n1 is given by
( )
(
)
( )
( )
(
)
2 1 1 1 1 10 0 ˆ cos sin 1 0 d d .
M T T H Nn
i
m n c c h n
m M h i
n α a t n t mT ωt j ωt −c w t iT′ t t
′ =− = = = − − × −
∑
∫
∫
∑ ∑
(14)and the suppressed narrow-band interference ℑ1 is given by
( )
{
(
)
(
)
(
)
(
)
2 1 1 1 0 0 1 1 1 0cos 2π
2
sin 2π d d .
M T T
m n
m M
H Nn i
n h n
h i
a t j t mT t mT
j t mT c w t iT t t
α ψ ψ =− − ′ ′= =
ℑ
ℑ = − ∆ − +
+ ∆ − + −
∑
∫
∫
∑ ∑
(15)3. Signal-to-Noise Plus Interference
To find the signal-to-noise plus interference ratio (SNIR), we need to find the desired signal power, interfer- ences, noise and jamming variances. From (8), the desired inphase signal power S is given by
(
)
2 2 1 11 2 IDS P n
S=z = β N T (16)
To calculate the variances, it is assumed that all the interferences, noise and jamming terms are zero mean independent random variables (RV). The process of computing the variances for the different interference terms is quite involved. Fortunately, the variances 2
MPI σ , 2
MCDI
σ , 2
WPI σ , 2
MUI
σ and σn21 for a system without sup- pression filter have been computed in [1, Chapter 4]. Without loss of generality, we invoke the result in [1] and
[3] for the above variances with suppression filter, which is given by
(
) (
)
1 1
2
2 2 2 2 2 2
1
2
n
T MPI MCDI WPI MUI n
P TN
MI NI
σ =σ +σ +σ +σ +σ = +
where
( )
{
(
( )
)
(
( )
)
}
( )
{
(
( )
)
(
( )
)
}
2 2 1 1 2 1 1 2 22 1 10
2 2
1 1
2 10 2
ˆ d
ˆ d
M M
m m m
m M m M
H H Tn
h h h h
m h h
n H Tn h h m h n MI
QJK r r
x TN JH
r r
x TN JH
α α α
ρ ρ ρ
ρ ρ ρ
+ =− =− ′ ′ ′ = = ′ ′ ′= = + Ω × + Ω − +
∑
∑
∑∑∫
∑∫
(17)(
)
2 1 2 M m m Mn s o
H NI
N E N =− α
Ω
=
∑
with xm =6 for QPSK and xm =12 for BPSK,
[ ]
1
var βk
Ω = , Q represents the sum of amplitude levels of all multipath components, Es =2P TΩ is the mean received symbol energy. Note that in the derivation of the variances it is assumed that the variation in τkl and ρkl is very small and can be ignored for all K users and L
paths; and that the variances are independent of k, h and j. The variance for the inphase self interference 2 DSI σ is given by
( )
( )
( )
( )
{
}
( )
( )
( )
( )
{
}
1 1 1 1 1 2 2 2 2 2 1 2 111 11 1 1 11 1 1
=
11 1 2 11 1 2
=1
cos sin
2
cos sin
m I m Q
DSI DSI m
m M
M
m I m Q
m m
P
var z var T m m
m m
σ β α θ θ
α θ θ
− − − −
= = × ϒ + ϒ
+ ϒ + ϒ
∑
∑
[ ]
{
( ) ( )
( ) ( )
( ) ( )
( ) ( )
}
( ) ( )
( )
( )
{
( )
1 1 1 11 1 1 1
1 1 2 2 2 2 2 2 2 2 2 2 2 2
2 1 1
11 ˆ
2
ˆ 11 11 1 1 1 1
ˆ
ˆ
11 11 1 1 1 1
ˆ
11 11 1 2 1 2
1 1 11 cos cos 2 sin sin cos cos sin s
m m I I
DSI m m
m M m M
m m Q Q
M M
m m I I
m m M m m m m PT E
E E m m
E E m m
E E m m
E β
σ α α θ θ
θ θ
α α θ θ
θ − − =− =− − − = =
= ϒ ϒ
+ ϒ ϒ
+ ϒ ϒ
+
∑ ∑
∑
∑
∑
( )
ˆ2( )
( )
}
11 1 2 1 2
in θm E Q m Q m
− −
ϒ ϒ
(19)
Assuming that θ11m is a zero means RV uniformly distributed in
[
0,2π]
( ) ( )
1 1( ) ( )
1 ˆ1 1 111 11 11 11
1 1
1 ,
sin sin cos cos 2
0,
m m m m m m
E E
m m
θ θ θ θ =
= = ≠
Also, it is evident that
(
) (
2) (
2) (
2) (
2) (
2)
2111,1I 111,0I 111, 1I 111,1Q 111,0Q 111, 1Q 1.
d = d = d − = d = d = d − = And from [3]
( ) ( )
, ,
,
0, .
n k i k i
N l l m
E F l F m
l m − = = ≠ According to this, (19) become
2 1 1 2 2 2 , 0 2 M n
DSI m m
m M m
PN T y σ α =− ≠ Ω =
∑
where ym =1 for QPSK and ym =2 BPSK.
From (15), the inphase component of the narrow jamming signal is given by
( )
(
)
(
)
(
)
2 1 1 1 1 10 0 cos 2π 1 0 d d
2
M T T H Nn
i
m n h n
m M a t j t mT t mT h i c w t iT t t
α ψ − ′
′
=− = =
ℑ
ℑ = − ∆ − + −
∑
∫
∫
∑ ∑
The variance can be evaluated as follows:
( )
(
)
(
)
(
)
( ) ( )
{
(
) (
)
(
)
(
)
2 1 2 1 1 1 10 0 1 0
1 1 1 2 1
0 0 0 0
1 2
1 0
cos 2π d d
2
cos 2π
2 cos 2π
M T T H Nn
i
m n h n
m M h i
T T T T
n n n
H Nn n
h i
var E a t j t mT t mT c w t iT t t
E a t a j t m T j m T t m T
t m T c
α ψ
λ λ ψ
ψ − ′ ′ =− = = − ′= =
ℑ
ℑ = × − ∆ − + −
ℑ
= × − − ∆ − + × ∆ − +
∑
∫
∫
∑ ∑
∫ ∫
∫ ∫
∑ ∑
(
)
(
)
( ) ( )
{
(
) (
)
(
)
(
)
(
)
2 2 1 21 1 2 1
1
1 1
1 0
1 1 1 2
0 0 0 0
1 2
1 1
1 1
1 0 1 0
d d d d
2
cos 2π cos 2π
H Nn
i i
h n h n
h i
M M T T T T
m m n n
m M m M
n n
H Nn H Nn
i i
h n h
h i h i
w t iT c w iT t t
E a t a j t m T j m T
t m T m T
c w t iT c w iT
λ λ λ
α α λ λ
ψ λ ψ
λ − ′ ′ ′= = =− =− − − ′ ′ ′= = ′= = − − ℑ = × − − × ∆ − + ∆ − + × − −
∑ ∑
∑ ∑
∫ ∫
∫ ∫
∑ ∑
∑ ∑
(
n)
d d d dt λ t λ
(20)
(
)
2 2
1 1 2
1 1 2 1
2
2 2
1, 2
4
M M
m m j
m M m M
HT m m
σℑ α α σ
=− =−
ℑ
=
∑ ∑
(21)
where 2
(
)
1, 2 j m mσ is given in (19) [3] by
(
)
1(
)
(
)
2
1 2 1 2 1 2
1
, 1 cos 2π 1 d ,
j m m sign p xNn m m q xNn m m x x
σ
−
≈
∫
− − + − + − (22)given that Nn 1,q= ∆Tn (ratio of the offset of interference carrier frequency to half SS bandwidth) and
[ ]
sign x =x or zero for x≥0 or x<0, respectively. Accordingly, the total variance for noise and inter- ference is given by
(
) (
2)
(
) (
2)
2
1 2
2 2
n n
T
P TN P TN
MI MI NI JI MI NI JI
σ = + + + = + + (23)
where 2 1 1 2 2 , 0 M m m
m M m
n
MI
y N =− ≠α
Ω
=
∑
(
)
2 2(
)
1 2
1 1 2 1
2 1 2
2 ,
M M
m m j
m M m M
n
H S
JI m m
N =− =− α α σ
′ Ω ℑ
=
∑ ∑
and S′ =2PΩ. Therefore, the output SNIR, γ, can be written as
(
)
[
]
2 11 1 2 2 11 112 2 2
n
T T
P TN
S β MI NI JI
γ β β
σ σ
−
= = = + + = ℜ (24)
4. Determination of Suppression Filter Coefficients
It is shown in [3] that the coefficients of the suppression filter can be determined using
(
)
( )
2
1
1 2
, 0
0, = , , 1,1, ,
M
m n n
m M m n mT nT n M M
α ρ ρ
=− ≠
− + = − −
∑
(25)( )
vTnρ is a lowpass autocorrelation function consists of three components
( )
vTn s( )
vTn n( )
vTn j( )
vTnρ =ρ +ρ +ρ (26)
where ρs
( )
vTn is the lowpass version of the desired signal, ρn( )
vTn is due to noise and ρj( )
lTn is due tonarrowband interference. The ρs
( )
vTn is given by( )
(
)
(
)
(
)
(
) (
)
(
)
1 1 1 1 1 1 1 1 1 1 1 1 1 1
1 1 1 1
2 2 2 2 2 2 2 2 2 2 2 2 2 2
2 2 2 2
1
1
1 1 1 1 0
1
1 1 1 1 0
1 2
2
2
K H J L Nn
i
s n k l k j h k l j k l k h n k l
k h j l i
K H J L Nn
i
k l k j h n k l j n k l k h n n k l
k h j l i
K
k
vT E P d t a t c w t iT
P d t vT a t vT c w t vT iT
P
ρ β τ τ τ
β τ τ τ
− = = = = = − = = = = = = = − × − − − × + − × + − + − − =
∑∑∑∑
∑
∑ ∑ ∑ ∑
∑
(
)
(
)
(
) (
)
(
)
(
)
1 1 2 2 1 1 1 1 1 2 2 2 2 2
1 1 1 2 2 2 2
2 1
1 1 1 2 2 2 1 1 2 2 2 2
1 2 1 1 1 1 1 1 1
1 1
1 1 1 2
0 0 H J L K H J L
k l k l k j h k l k j h n k l h j l k h j l
Nn Nn
i i
j k l j n k l k h n k l k h n n k l
i i
E E d t d t vT
E a t a t lT E c w t i T c w t vT i T
β β τ τ
τ τ τ τ
= = = = = = = − − = = × − + − × − + − × − − + − −
∑∑∑∑∑ ∑ ∑ ∑
∑ ∑
(27)(
) (
)
1 2
1, 0
0, 0
j kl j n kl
v E a t a t vT
v
τ τ =
− + − =
≠
(
)
{
}
1
1 2
0 1
Nn i
k h n kl
i E c w t iT
τ −
=
− − =
∑
then
( )
(
)
(
)
(
)
{
1}
1
2 2 2
1 1 1 1
1 2
0 2
2
K H J L
s n kl kjh kl j kl
k h j l Nn
i
k h n kl
i
vT P E E d t E a t
E c w t iT
PKLHJ
ρ β τ τ
τ
= = = = − =
= − −
× − −
= Ω
∑∑∑∑
∑
(28)The ρn
( )
vTn and ρj( )
vTn are given in [3] by( )
20 o n 00n n
N T v vT
v
ρ = =
≠
(29)
( )
(
)
(
)
[ ]
[ ]
1 cos 2π , 1
0 1
j n
v p vq v int p vT
v int p
ρ = ℑ − ≤
>
(30)
where int x
[ ]
is defined as the integer part of x and 2s
q B
∆
= . Therefore from (28), (29) and (30), one obtains
( )
[
]
( )
(
)
(
)
[ ]
[ ]
1
2 , 0
2 1 cos 2π , 1
0, 1
n s o
n
KLHJ N E N Ś v
vT P Ś v p vq v int p
v int p
ρ
−
+ + ℑ =
= Ω ℑ − ≤
>
(31)
From (25) and (31), we can obtain the coefficients αm.
5. BER and Outage Probability Performance
A common method used to measure the performance for communication systems is, the average bit error rate,
e
P. It is obtained by averaging the instantaneous bit error rate (BER) of SNIR γ, over the channel fading functions.
In practical applications, in order to correctly detect a transmitted signal, the error probability of the received signal must not exceed a specified value. The output SNIR γ, must be above a certain specified threshold, say
th
γ . This is quantified by the outage probability, which represents the probability of unsatisfactory reception of the signal over the intended coverage area. In this paper, we define the Pout as the probability that γ falls
below γth ([7], p. 5), i.e. Pout Pr
(
th)
0thf( )
dγ γ
γ γ γ γ
= < =
∫
.e
P and Pout depend on the method of diversity combining employed, as shown below.
5.1. Selection Diversity
For selection diversity, the overall output SNIR γ of the receiver is given by
(
)
max max , , , ,1 , SD
i I
γ =γ = γ γ γ (32)
where γi is the SNIR at the ith branch given by (24). It is assumed that the channel does not change
was shown that the average BER, SD e
P and SD out
P are respectively given by 1
1 0
,
1
exp erfc d .
( ) 2 2
I m SD i SD m e i i m
I G m
m m P m γ γ γ γ γ − ∞ −
Ωℜ
= − ×
Γ
∫
Ωℜ Ωℜ
(33)
( )
1
1
0 , exp d .
th
I m
SD m
out
i i i
I m m m
P G m
m
γ γ γ
γ γ
−
−
=Γ Ωℜ Ωℜ −Ωℜ
∫
(34)where Γ
( )
m is the gamma function,( )
1( )
0
1
, i ii i exp d
m m i
i
i i i
m
G m y y y
m
γ
γ Ω ℜ −
= −
Ω ℜ Γ
∫
is the incomplete gamma
function and ℜ is given by (24).
5.2. Equal Gain Combining
For equal gain combining (EGC), each branch contributes equally to the overall output SNIR [8] and the decision variable can be written as
(
1 1 1 1 1 1)
1
1 1
I I
EGC i i i i i i
i DS MPI MCDI MWPI MUI
i i
z z z z z z z n
= =
=
∑
=∑
+ + + + + (35)In [1], it was found that the average BER EGC e
P and EGC out
P are given respectively by
( )
0 11 1 1 exp 1 1 1 1 5 5
1 erfc d ,
2 2 Im EGC Im e I i i m m P Im m m I γ γ β γ ∞ − = = −
Γ Ωℜ − − Ωℜ
ℜ
×
∫
∑
(36) , . 1 1 5 EGC th out mP G Im
m γ =
Ωℜ −
(37)
5.3. Maximal Ratio Combining
Maximal Ratio Combining (MRC) is an optimum diversity combining technique, in it the diversity branches are weighted accordingly and then combined with output given as
1 111 1
1 1 1
, 2
I I I
MRC
i i n i i i Ti
i i i
p
z W z TN d Wβ W N
= = =
=
∑
=∑
+∑
where Wi is the weight function and NTi=z1MPIi +z1MCDIi +z1MWPIi +zMUI1i +n1i+ ℑ1i is the sum of interferences,
noise and jamming terms. In [1], it was found that the average BER MRC e
P and MRC out
P are given respectively as
( )
0 1 121
1 exp 1erfc d .
2 2 Im I MRC Im e i i m m P Im γ
γ β γ
∞ −
=
ℜ
= −
Γ
∫
Ωℜ Ωℜ ∑
(38), .
MRC th
out m
P = GΩℜγ Im
6. Results and Discussions
In this section, using the above analytical results, the BER performance and the Pout of the system in the
presence of narrow-band interference are presented. The effects of changing the system parameters such as the numbers of SF taps, q, p, D, m and the length of code Nn are investigated. Finally, the BER performances of
the system and Sin-MC/MCD-CDMA system are compared. Unless otherwise mentioned the parameters listed in Table 1 are used for the simulation in this section by means of the MATLAB program.
[image:11.595.172.425.269.464.2]6.1. Effect of Diversity
Figure 2 shows the effect of diversity and filtering on BER performance. The types of diversity used are SD, EGC and MRC. From Figure 2, it can be noted that a tremendous improvement can be achieved by using diversity and filtering. As discussed previously, MRC is an optimum diversity combining because of that MRC technique shows the best performance. Selection diversity shows the worst performance, however, one benefit of SD is its simple implementation.
[image:11.595.121.538.501.723.2]Figure 2.Effect of diversity and filtering on BER performance.
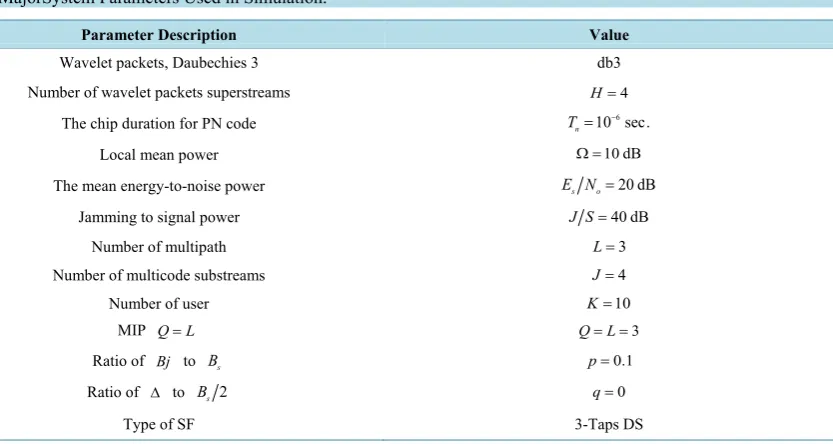
Table 1. MajorSystem Parameters Used in Simulation.
Parameter Description Value
Wavelet packets, Daubechies 3 db3
Number of wavelet packets superstreams H=4
The chip duration for PN code 10 sec.6
n
T = −
Local mean power Ω =10 dB
The mean energy-to-noise power E Ns o=20 dB
Jamming to signal power J S=40 dB
Number of multipath L=3
Number of multicode substreams J=4
Number of user K=10
MIP Q L= Q L= =3
Ratio of Bj to Bs p=0.1
Ratio of ∆ to Bs 2 q=0
6.2. Effect of Number of Filter Taps
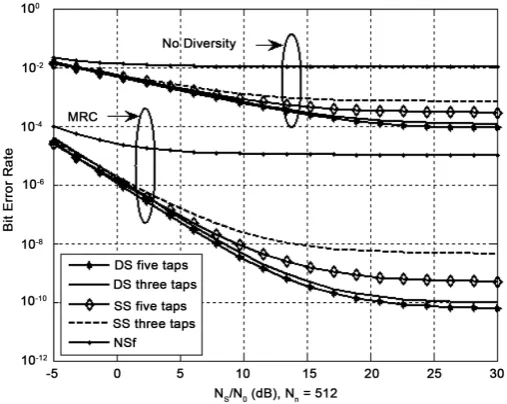
Figure 3shows the BER performance as a function of E Ns o without and with SF for double-sided (DS) taps
filter (M1≠0, M2≠0) and singles-sided (SS) taps filter (M1≠0, M2=0 or M1 =0, M2 ≠0) using MRC and also with no diversity. As expected, the BER performance is improved by using SF and diversity. It can be noted that as the number of taps increases for SS or DS filters, the BER performance is improved. Also, an improvement can be achieved by using DS filter for the same number of the total taps as SS filter.
6.3. Effect of q and p
Figure 4shows the BER performance with 3-taps DS filter as a function of q for two values of p using the three types of diversity. The system parameters are J =2, K =150, Nn=256, E Ns o=40 dB and J S=30 dB.
[image:12.595.175.425.504.702.2]As expected the MRC has the best BER performance and the BER is improved by increasing p. The jamming variance depends on filter coefficients which are dependent on cos 2πνq (ν is integer), because of that the worse value of BER is at q=0.5, i.e. when cosπν = ±1 (maximum).
Figure 3.Effect of number of filter taps on BER performance.
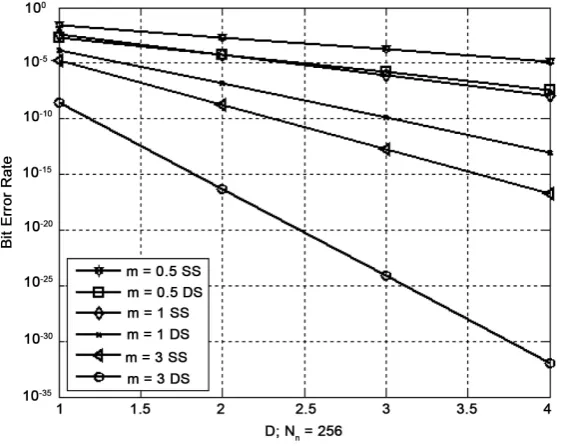
6.4. Effect of Diversity Order and Channel Fading
Figure 5shows the effect of diversity order D and channel fading parameter m on BER. Three values of m are chosen, namely, m=0.5, which approximate one sided Gaussian model, m=1, which approximate the Rayleigh fading and m=3, which approximated Ricean model. The performance is investigated for SS and DS 3-taps SFs. As expected, increasing D or m improves the performance of the system. From Figure 5, we can note that, for a given value of m and D, the DS filter outperforms the SS filter and the performance difference between DS and SS filters increases with the increasing of m which is evident at m=3. Also, we note the BER performance of DS filter for m=0.5 is approximately the same for SS filter with m=1.
6.5. Outage Performance
Figure 6shows the outage performance of the system as a function of γth for two values of J S using MRC.
The DS filter has three taps and is symmetric. As expected, the outage performance is degraded by increasing
J S. As can be noted from Figure 6, the system is very tolerant of interference when SF is present. When 35
th
γ > , outages are approximately the same for systems with and without SF for the two values of J S. This is because the system is unable to give a satisfactory reception of the signal when γth>35.
6.6. Performance Comparison
Figure 7shows the comparison of our system, WP-MC/MCD-CDMA, with Sin-MC/MCD-CDMA. The systems’ parameters are K=10, J S=40 dB and Nn=320. The DS filter has three taps and is symmetric. As seen from Figure 7, the performance for the two systems without SF is almost the same. As expected, the BER performance can be improved by using SF and diversity, but the improvement in BER of our system is much more than that of the Sin-MC/MCD-CDMA system. This means, our system uses the SF and diversity to suppress the narrow-band interference and MAI, respectively, more efficiently than does the Sin-MC/MCD-CDMA system.
7. Conclusion
The BER and outage performance of a WP-MC/MCD system overlaying a narrow-band BPSK waveform and employing SF in the receiver has been evaluated. It is found that the performance is improved by using SF and diversity. The double-sided SF is superior to single-sided SF for the same number of total taps. The MRC has
Figure 6. Outage performance with and without SF.
Figure 7. BER performance for WP-MC/MCD-CDMA and Sin-MC/MCD-CDMA with and without SF.
better performance than SD and EGC. The performance of the system is improved by increasing the diversity order and the fading parameter. The performance of the system is improved when p increased. The system has the best BER when q=0.5. Our system uses SF and diversity to suppress the narrow-band interference and MAI, respectively, more efficiently than does the Sin-MC/MCD-CDMA system.
Acknowledgements
References
[1] Akho-Zahieh, M.M. (2006) Design and Analysis of Multicarrier Multicode Wavelet Packets Based CDMA Communi-cation Systems With Multiuser Detection. Ph.D. Dissertation, The University of Akron, Akron.
[2] Akho-Zahieh, M.M. and Ugweje, O.C. (2008) Diversity Performance of a Wavelet-Packet-Based Multicarrier Multi-code CDMA Communication System. IEEE Transactions on Vehicular Technology, 57, 787-797.
[3] Wang, J.Z. (1999) On the Use of Suppression Filter for CDMA Overlay. IEEE Transactions on Vehicular Technology,
48, 405-414.
[4] Nakagami, N. (1960) The m-Distribution, a General Formula for Intensity Distribution of Rapid Fading. In: Hoffman, W.G., Ed., Statistical Methods in Radio Wave Propagation, Pergamon, Oxford, 3-35.
http://dx.doi.org/10.1016/B978-0-08-009306-2.50005-4
[5] Pursley, M. (1977) Performance Evaluation for Phase-Coded Spread Spectrum Multiple-Access Communication-Part I: System Analysis. IEEE Transactions on Communications, 25, 795-799.
[6] Vandendorpe, L. (1995) Multitone Spread Spectrum Multiple Access Communications System in a Multipath Ricean Fading Channel. IEEE Transactions on Vehicular Technology,44, 327-337.
[7] Simon, M.K. and Alouini, M.S. (2005) Digital Communication over Fading Channel. 2nd Edition, John Wiley & Sons, Hoboken.