Munich Personal RePEc Archive
Productivity Growth in Small
Enterprises - Role of Inputs,
Technological Progress and ’Learning By
Doing’
Majumder, Rajarshi
Dept of Economics, University of Burdwan
2004
PRODUCTIVITY GROWTH IN SMALL ENTERPRISES – ROLE OF
INPUTS, TECHNOLOGICAL PROGRESS AND ‘LEARNING BY DOING’
Rajarshi Majumder *
The contribution of Small Manufacturing Enterprises (SMEs) to the economy is being
questioned on grounds of their low productivity and their sustainability is argued to depend
on improving labour productivity through technological upgradation. In a developing
economy this is a costly proposition due to capital scarcity, and the effect of technological
changes on productivity levels has to be estimated before taking such policies. However, for
the SMEs, technological diffusion is more important rather than the ‘modernity’ of the
technology itself. This paper seeks to disassociate the effects of pure Technological Progress
from those of Technological Efficiency Changes in few selected industries within the SMEs
and examines their relative importance. It is found that in about 70 per cent of the situations
where indeed there has been some technological improvement, technological diffusion has by
far outstripped the role of pure technical progress. A combination of better technology and
wider diffusion is thus recommended for productivity rise.
I. INTRODUCTION
Small Manufacturing Enterprises (SMEs) in an overpopulated developing economy
serve the dual role of job-creation and shifting the occupational structure. Combined
with low capital requirement (sometimes one-fifth of that in the factories per worker),
indigenous resources, and localised market, they serve as an important player in
transforming a predominantly subsistence, agro-based economy to a market-based
industrial economy. However, their contribution to the overall health of the economy
and the policy of encouraging them are being questioned nowadays on grounds of
economic viability and returns to the entrepreneur. It has been commented that much
of the recent increase in non-farm employment is distress-induced and leads to
overcrowding of workers and low productivity (Bhalla, 2000). As much as 40 per cent
of Value Added and 50 per cent of Employment in the SMEs are reported to be
concentrated in the low productive (Labour productivity less than 3000 Rupees per
worker per annum in 1980-81 prices) segments and activities (Shah, 2002). About 25
per cent of the workers in the unorganised manufacturing sector are said to be
seriously underemployed (Oberai and Chadha, 2001). Under such conditions,
researchers have argued that the sustainability of SMEs depend crucially on getting
out of the ‘cheap labour’ syndrome and improve labour productivity (LP) followed by
improving labour conditions (Shah, 2001). They have also stressed on technological
improvement (Mukherjee and Mathur, 2002), technical adaptation (Mamgain et al,
2002), promotion of links between SMEs and organised sector (Ghate et al, 1992,
Mukherjee and Mathur, 2002), smoothening credit disbursements to SMEs
(Mukherjee and Mathur, 2002), etc. as means to improve productivity. However, the
focal point of almost all of them is upgradation of technology through greater capital
use. In context of a developing economy this may turn out to be a costly proposition
due to scarcity of capital. Moreover, desired changes in production process may also
be brought about by better mastering of the existing technologies or diffusion. This
paper seeks to disassociate the effects of pure Technological Progress (TP) from those
of Technological Diffusion or Learning-by-Doing in few selected industries within
the SMEs to examine the relative importance of them in improving the health of the
SMEs.
The paper has five sections. In the next section we discuss the methodological
background of the study. The third and fourth section analyse the results obtained and
interpret them. The final section summarises the main findings and provides few
policy suggestions in their light.
II. TECHNOLOGICAL PROGRESS AND TECHNOLOGICAL DIFFUSION
METHODOLOGICAL ISSUES
1. Theoretical Background
Improvements in labour productivity as a consequence of increase in capital stcok
have often been termed as cosmetic. It is argued that ‘Capital Deepening’ shifts in
technique of production necessarily lead to a rise in labour productivity and fall in
capital productivity, and the changes in LP is merely a reflection of substituting one
factor by another (higher LP levels in factories relative to the SMEs has to be viewed
against this backdrop and does not always reflect higher efficiency of the former).
Therefore, changes in productivity levels due to changes in technology are advised to
be measured by changes in Total Factor Productivity or Total Factor Productivity
(Solow, 1957), Output growth is decomposed into two components – growth due to
changes in inputs, and that due to other factors. The second component is termed as
TFPG and is generally taken as a measure of TP (or, more specifically, contribution of
TP towards productivity rise). A positive TFPG implies that the production frontier
has expanded outward and there has been a more than proportionate rise in output
compared to that in inputs. By decomposing output growth into TFPG and that
accounted for by input growth, researchers have compared the relative importance of
the two. Also, in cases where TFPG has been substantial and positive, it has been
concluded that they are clear instances of TP leading to productivity rise. And
naturally, technological upgradation has been suggested as the main policy instrument
for productivity improvement.
However, one must remember that TFPG in the growth accounting approach is a
residual measure and encompasses the effect of not only TP, but also of better
utilisation of capacities, learning by doing, improved labour efficiency, etc. Thus, it is
a combination of improved technology and the skill with which known technology is
applied by the units, i.e. Technological Efficiency (TE). This second component, i.e.
growth in output because of greater experience & skill of workers, better organisation
by the entrepreneurs, better utilisation of existing resources, etc. are significant for the
SMEs. Most of these units rely on indigenous resources & adaptive technology, and
the workers acquire their skill mostly ‘on the job’. As a result, they go on
experimenting till they achieve the optimum mix of technology, resource, skill and
organisation. Consequently, diffusion of technology is more important to them rather
than the ‘modernity’ of the technology itself. One must therefore try to alienate the
effects of pure TP from that of Technological Efficiency Changes (TEC) for these
units.
In technical terms, a TP may be measured by the outward shift of the production
frontier. But given the nature of the SMEs, and the diversity therein, it is quite
realistic to postulate that the ‘frontier’ would be achieved by only a few, and most of
the units would operate within the envelope. Output growth may therefore occur due
to three factors – rise in input/resource use (a lateral movement on the 2-dimensional
Input-Output Plane), improvement in technology (upward shift of the production
frontier), and improvement in technological efficiency (movement from a sub-frontier
position towards the frontier). In reality, output growth occurs due to a combination of
Zhao, 1996), this decomposition of total Output Growth into Input Growth (INPG),
Technical Progress (TP), and Technical Efficiency Changes (TEC) can be illustrated
by Figure 1. The production frontiers are F1 and F2 respectively. For a firm on the
frontier, output would be Y11* in period 1 and Y22* in period 2. But, most of the firms
will operate within the envelope. Let a representative firm' s realized output is Y1 in
period 1 and Y2 in period 2. The vertical distance between the frontier output and the
realized output of the firm, that is, TE1 [= (Y11* - Y1)] in period 1, and TE2 [=(Y22* -
Y2)] in period 2, respectively, are measures of Technical Inefficiency. Hence, the
difference between TE1 and TE2 is the Technical Efficiency Change (TEC) over
time. The distance between the two frontiers F1 and F2 [that is, (Y22* - Y21*) using
period 2 input levels, or (Y11*-Y12*) using Period 1 input levels] are measures of
Technological Progress (TP). The contribution of input growth (INPG) to output
growth between periods 1 and 2 would be (Y22* - Y12*) using F2 frontier, or (Y21* -
Y11*) using F2 frontier.
The output growth from A to D can therefore be decomposed into AB + BC + CD.
= (Y2 – Y12*) + (Y12* - Y11*) + (Y11* - Y1)
= [(Y11* - Y1) – (Y22* - Y2)] + (Y12* - Y11*) + (Y22* - Y12*)
= [TE1 - TE2] + TP + INPG
= (TEC + TP) + INPG = TFPG + INPG
The present structure breaks up observed output growth to lateral movements on or
beneath the production frontier (INPG), movement towards the production frontier
(TEC), and shifts in the production frontier itself (TP).
Using Stochastic Frontier Production Function in its Translog form, one can get
estimates of Efficiency for each firm in both initial and final periods and thereby
calculate TEC.1 Figures on TFPG can be obtained using Solow’s growth accounting
approach using a Translog formulation.2 The contribution of Inputs and TP can
thereafter be obtained as INPG = (Output growth – TFPG), and TP = (TFPG – TEC)
respectively. One can then study the relative importance of the roles played by each of
these three players – Inputs, Technology, and Diffusion, in achieving Output growth.
In the present paper, we follow this methodology to study the roles of these three
factors in four selected industry groups of SMEs. We consider a Translog production
function to be operative with Value Added being dependent on Labour (Number of
Workers) and Fixed Capital (Fixed Assets). The Value terms are at constant 1981-82
prices.
2. Database and Operational Methodology
We use the NSSO database on Unorganised Manufacturing sector for our study, and
the reference periods are 1994-95 and 2000-01, as defined by the two latest NSSO
surveys.3 Out of the three types of enterprises surveyed by NSSO, the smallest ones
(OAMEs) do not use any hired labour. Consequently, for them, the data on
emoluments to workers are not dependable, and so TFPG has not been calculated
therein. We thus consider the DMEs and the NDMEs within the unorganised
manufacturing sector. We restrict our study to 16 major states of India and consider
Rural and Urban sectors separately. Thus we have 64 possible observations (16 states
X 2 types of enterprises X 2 sectors) for each of the 2-digit NIC groups for 1994-95
and 2000-01.4 We consider these 64 observations as individual firms (e.g. rural DMEs
of West Bengal as one firm, urban NDMEs of Gujarat as another firm, and so on).
for each of the two types of enterprises for rural and urban sectors separately for each
of the 16 states.
Among the industry groups, we concentrate on Food product, Textiles, Leather
product, and Non-electrical & electrical equipment sectors.5 The first one represents
consumer non-durables, the next two are semi-durables, and the last one represents
intermediate & durable capital goods. Thus we have 256 possible ‘firms’ for our study
– each one representing a particular enterprise type in a particular sector of a
particular state producing a particular commodity. We estimate the efficiencies, TFPG
and related parameters separately for each of the industries, as it is quite natural that
different industries will have different production functions. Out of the possible 256
combinations, we could get only 222 comparable observations (107 for DMEs and
115 for NDMEs) present both in 1994-95 and 2000-01. Let us now explore the results
in details.
III. FACTOR PRODUCTIVITY IN SMES
A substantial part of growth in Value Added in developing economies is due to rapid
increase in input use and little is attributed to improvements in factor productivity. In
fact, the average contribution of inputs to output growth in developing nations has
been estimated to be close to 70 per cent (Chenery et al, 1986). India’s performance,
especially that of the organised manufacturing sector, has been much worse as regards
TFPG is concerned. During 1959-60 to 1985-86 rate of growth of TFP has been –0.4
per cent per annum (Ahluwalia, 1991). This miserable situation had improved in the
later decades and TFPG during 1979-90 has been estimated to be 1.8 per cent p.a.
(Unel, 2003). The performance improved further in the post-reform period to post a
TFPG rate of 4.7 per cent p.a. during 1991-97 (Unel, op cit). However, for the
unorganised manufacturing sector, TFPG has been fluctuating between positive and
negative. Rates of TFPG for this sector on the aggregate have been estimated to be –
14.6 per cent p.a. during 1978-85, 11.4 per cent p.a. during 1985-90, -3.1 per cent p.a.
during 1990-95 (Unni et al, 2001).
In the recent years, i.e. for our study period of 1994-2000, Value Added in the
unorganised manufacturing sector have increased at 5.2 per cent p.a., Employment at
1.9 per cent p.a., and Capital stock at 5.1 per cent p.a. This has resulted in a rise in
TFP at the rate of 0.9 per cent p.a. We are however more interested in the trends
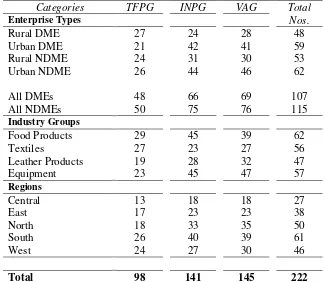
Of the 222 cases considered by us, TFPG has been positive in 89 cases (Table 1).
Between the two types of enterprises, TFPG has been higher in the NDMEs compared
to the DMEs for all industries taken together. While about half of the cases in the
Urban areas yielded positive TFPG, only one-third of the cases in the Rural areas
showed positive TFPG. Incidence of positive TFPG is substantially lower in the
Northern states compared to the national average, while relatively better performance
are exhibited by Gujarat, Madhya Pradesh and Maharashtra.6 Among the four
industries considered by us, positive TFPG is more frequent in Food products and
[image:8.595.117.442.281.563.2]Textiles relative to the other two.
Table 1
Incidence of Positive TFPG, Positive Input Growth and Positive Value Added Growth
Categories TFPG INPG VAG Total
Enterprise Types Nos.
Rural DME 27 24 28 48
Urban DME 21 42 41 59
Rural NDME 24 31 30 53
Urban NDME 26 44 46 62
All DMEs 48 66 69 107
All NDMEs 50 75 76 115
Industry Groups
Food Products 29 45 39 62
Textiles 27 23 27 56
Leather Products 19 28 32 47
Equipment 23 45 47 57
Regions
Central 13 18 18 27
East 17 23 23 38
North 18 33 35 50
South 26 40 39 61
West 24 27 30 46
Total 98 141 145 222
Source: Author’s Calculation based on NSSO (1998,1998a, 2002, 2002a)
As against this, contribution of inputs (measured by INPG) has been positive in 141
cases, more prominently in urban areas compared to rural areas, and in NDMEs
compared to DMEs. Positive contribution of inputs has been relatively less frequent in
Textiles compared to the other industries, and in eastern and western states compared
to the other states. Positive INPG has been most frequent in Punjab, followed by
Orissa and Karnataka.
Combining them, Value Added Growth (VAG) has been positive in 145 cases. We
negative) of INPG in more than 85 per cent of the cases. Only in few cases, positive
TFPG have been able to offset the negative contribution of INPG to yield positive
VAG. However, for the Food product sector, negative TFPG have offset the positive
effect of INPG in quite a few cases.
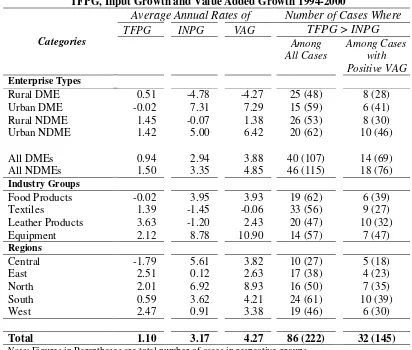
The mean contribution of INPG has been 3.17 per cent p.a. while that of TFPG has
been only 1.10 per cent p.a. (Table 2). Among all the cases, contribution of INPG is
higher than TFPG in 136 cases. Among the 145 cases where VAG have been positive,
contribution of TFPG exceeds that of INPG in only 32 cases. In addition, positive
INPG leads to positive VAG in more than 90 percent of cases while positive TFPG
leads to positive VAG in just 75 per cent cases. This indicates that major part of VAG
has been possible because of increase input use and technological upgradation has had
[image:9.595.72.484.338.688.2]only a moderate effect.
Table 2
TFPG, Input Growth and Value Added Growth 1994-2000
Average Annual Rates of Number of Cases Where
TFPG INPG VAG TFPG > INPG
Categories
Among All Cases
Among Cases with Positive VAG
Enterprise Types
Rural DME 0.51 -4.78 -4.27 25 (48) 8 (28)
Urban DME -0.02 7.31 7.29 15 (59) 6 (41)
Rural NDME 1.45 -0.07 1.38 26 (53) 8 (30)
Urban NDME 1.42 5.00 6.42 20 (62) 10 (46)
All DMEs 0.94 2.94 3.88 40 (107) 14 (69)
All NDMEs 1.50 3.35 4.85 46 (115) 18 (76)
Industry Groups
Food Products -0.02 3.95 3.93 19 (62) 6 (39)
Textiles 1.39 -1.45 -0.06 33 (56) 9 (27)
Leather Products 3.63 -1.20 2.43 20 (47) 10 (32)
Equipment 2.12 8.78 10.90 14 (57) 7 (47)
Regions
Central -1.79 5.61 3.82 10 (27) 5 (18)
East 2.51 0.12 2.63 17 (38) 4 (23)
North 2.01 6.92 8.93 16 (50) 7 (35)
South 0.59 3.62 4.21 24 (61) 10 (39)
West 2.47 0.91 3.38 19 (46) 6 (30)
Total 1.10 3.17 4.27 86 (222) 32 (145)
Note: Figures in Parentheses are total number of cases in respective groups.
Source: Same as Table 1.
However, given the fact that TFPG has been positive in about 45 per cent of the cases,
and of them 75 per cent also have positive VAG, we can not ignore its contribution.
recommended that TP is the way out from low productivity trap for the SMEs and
upgrading technology through injection of fresh capital is the panacea. This however
seems to be too hasty a conclusion. As has been commented earlier, for the SMEs,
organisation of available resources, training and skill acquisition of the workers, and
learning by doing are equally (if not more) important factors. Let us now decompose
TFPG into pure TP and TEC (or Diffusion) to examine the relative contribution of
them.
IV. TECHNOLOGY: UPGRADATION VERSUS DIFFUSION
1. Overview
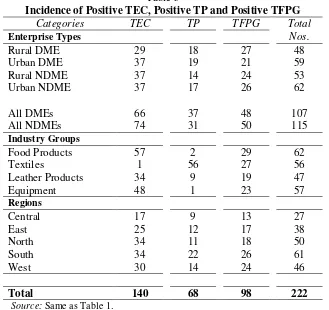
It is observed that during the period 1994-2000, Efficiency levels have improved in
140 cases and TEC have been positive therein (Table 3). Compared to this, TP has
[image:10.595.117.446.344.654.2]been positive in just 68 cases – less than half of the former!
Table 3
Incidence of Positive TEC, Positive TP and Positive TFPG
Categories TEC TP TFPG Total
Enterprise Types Nos.
Rural DME 29 18 27 48
Urban DME 37 19 21 59
Rural NDME 37 14 24 53
Urban NDME 37 17 26 62
All DMEs 66 37 48 107
All NDMEs 74 31 50 115
Industry Groups
Food Products 57 2 29 62
Textiles 1 56 27 56
Leather Products 34 9 19 47
Equipment 48 1 23 57
Regions
Central 17 9 13 27
East 25 12 17 38
North 34 11 18 50
South 34 22 26 61
West 30 14 24 46
Total 140 68 98 222
Source: Same as Table 1.
The average value of TEC is positive while the average TP is negative (Table 4).
Among all cases, TEC is greater than TP in 153 cases. If we consider only those 140
cases where TEC is positive, TP is out weighed by TEC in 70 cases. Thus, in about
positive and greater than TEC in 66 cases. It therefore follows that the contribution of
TP and TEC are equally important. If anything, the balance is marginally tilted
towards TEC.
If we now consider only those 98 cases where TFPG is positive, we find that TEC is
greater than TP in 70 cases, i.e. in about 70 per cent of the situations where indeed
there has been some technological improvement, technological diffusion has by far
outstripped the role of pure technical progress. This underlines the importance of
diffusion and learning by doing etc. for improving the conditions of the SMEs.
Table 4
TEC, TP and TFPG during 1994-2000
Average Annual Rates of Number of Cases Where
TEC TP TFPG TEC > TP
Categories
Among All Cases
Among Cases with Positive TFPG
Enterprise Types
Rural DME 1.96 -1.45 0.51 31 (48) 16 (27)
Urban DME 1.77 -1.79 -0.02 39 (59) 16 (21)
Rural NDME 1.52 -0.07 1.45 40 (53) 19 (24)
Urban NDME 1.56 -0.14 1.42 43 (62) 19 (26)
All DMEs 1.86 -0.92 0.94 70 (107) 32 (48)
All NDMEs 1.54 -0.04 1.50 83 (115) 38 (50)
Industry Groups
Food Products 6.99 -7.01 -0.02 62 (62) 29 (29)
Textiles -30.20 31.59 1.39 0 (56) 0 (27)
Leather Products 13.88 -10.25 3.63 36 (47) 18 (19)
Equipment 16.14 -14.02 2.12 55 (57) 23 (23)
Regions
Central 5.18 -6.97 -1.79 18 (27) 9 (13)
East -4.07 6.58 2.51 25 (38) 10 (17)
North 4.64 -2.63 2.01 39 (50) 16 (18)
South -1.41 2.00 0.59 40 (61) 19 (26)
West 5.61 -3.14 2.47 31 (46) 16 (24)
Total 1.75 -0.65 1.10 153 (222) 70 (98)
Note: Figures in Parentheses are total number of cases in respective groups
Source: Same as Table 1.
2. Disaggregated Results
The results regarding TEC and TP that we have outlined so far have variation across
enterprise types, regions, and industries.
It is observed that TP is more prominent in the DMEs compared to NDMEs, while the
reverse is true for TEC. TP has been positive in just about 20 per cent cases for the
hand, TEC is positive in about half of the cases for the Southern states compared to
the national ratio of two-third.
But wider variations are observed across the industry groups. While for Food
products, Leather products, and the Equipment sector TEC has been positive in more
than 80 per cent of the cases, for the Textiles sector, only one positive TEC is
observed (rural DME of Madhya Pradesh). Contrary to this, almost all cases for
Textiles show positive TP during 1994-2000, while that for Food products and
Equipment sector are only one and two respectively. However, for Textiles, even with
TEC being negative in almost all cases, in half of the cases positive TP acts as a boost
and makes TFPG positive, the trend being more pronounced for smaller and rural
units. But, for urban DMEs, TEC is negative in all the cases, and in most of them TP
cannot compensate for it.
For Food product and Equipment sectors, TEC is mostly positive. But in half of these
cases, negative TP acts as a drag and makes TFPG negative. For Food products, this
phenomenon is more pronounced in the urban sector where 29 cases have positive
TEC and negative TP acts as a drag in 20 of them.
For Leather products, TFPG is dictated by TEC in two-third of the cases, especially in
the urban areas. But, for rural DMEs, TP outweighs TEC.
More significant however, is the observation that, all the 28 cases (save 1) where
TFPG is positive but TP is greater than TEC, belongs to the Textiles sector.
Compared to this, none of the Food products industries appear in the list of positive
TP and TP greater than TEC.
It can thus be commented that for Food product and Equipment sectors, both TP and
TEC are observed to have been equally important in determining TFPG. On the other
hand, TP has played a dominant role in the Textiles sector and TEC a more vital role
in the Leather products sector.
What explains these inter-industry differences? One possible explanation may lie in
the dynamics of these industries in India over the last decade. It is widely accepted
that the Leather industry in India is suffering from outdated technology (leading to
adverse environmental impact and outright closure notices in various regions). It is
extremely conservative and managed by people with little technical education. They
are used to the old technology and traditional ways of doing things and are very
reluctant to introduce changes. This lack of positive attitude towards new technology
Moreover, upgrading technology in the leather industry is a comprehensive
changeover programme and the cost is very high. This hinders the small firms while
the cheaper Indian machines mostly embody older technologies. Under such
situations, whatever improvement in productivity has been observed in this sector has
been mainly due to better use of existing machineries and techniques.7 On the other
hand, there has been a tremendous technological upgradation in the Textiles sector in
the post-reform period. Faced with global competition and favourable domestic
supply of raw materials, and aided by the Technology Upgradation Fund set up by the
government for this sector, it has been able to induct modern technology up to a large
extent. This is reflected in the greater role of TP in this sector. AS against this, Food
products and Equipment sectors in India are the ones where one sees the fiercest
competition along with a wider spread of the firms in terms of size-class. While there
are modern large firms catering to the global niche market, there are also tiny units
producing traditional items for a closed local market. As a result, these sectors have
seen both incorporation of better technology (mostly by the larger firms) and better
use of existing techniques (by the smaller firms). Consequently, these two sectors
have seen both TP and TEC acting together towards improved productivity.
V. CONCLUSION
The results thus clearly bring out the fact that Efficiency parameters are significant
determinants of productivity and growth of the SMEs. In fact, in many cases they
outweigh the role of pure technological progress. This results are but expected
because the nature of the SMEs make them more reliant on their skill and
organisation, rather than on scarce capital resource. They depend more on innovation
and adaptation, rather than on significant changes in capital-labour ratio.
Effectiveness of labour for these units depends more on training, experience, and
familiarity of the workers, rather than on the range of tools that complement them. As
a result, Diffusion plays a prominent role in their productivity rise and output growth.
This has crucial policy implications and questions the blanket policy suggestion of
injecting more capital into the SMEs to upgrade their technology.
Consequently, policies for the productivity rise and growth of the SMEs should give
stress on these issues rather than trying to change the basic technology applied
sharing and fine-tuning of the production process. Training programmes for the
workers may be organised to make them better acquainted with the machines they
work with. The entrepreneurs must be imparted the basics of optimum organisational
skills. In all these aspects formation of local groups, sharing experiences of successful
units, and even sharing of ‘idle’ resources may prove helpful. In other words,
efficiency enhancement should be the prime target for the SMEs.
Moreover, any effort to improve the technology involves capital induction and
requires substantial amount of financial resources. Given the nature of the SMEs and
the background of most of the entrepreneurs, this is a costly, and often difficult,
proposition. On the other hand, diffusion of existing technology and improvements in
organisation, skill, and efficiency require less capital and more ‘human involvement’,
the latter being abundant with the SMEs. Thus as a policy choice, Efficiency
Upgradation appears more viable, effective and lucrative compared to Technological
Upgradation.
Saying all these, it must be acknowledged that Technological Progress also has a
special role to play and any technological upgradation will raise productivity and
improve performance. Among the various product groups, there are few that have
benefited more from TP rather than TEC. This diversity must be clearly brought out
and policies must be framed accordingly. Only when better technology combines with
wider diffusion can one expect the SMEs to come out of their low productivity
syndrome and ensure better returns, both for their entrepreneurs and for the economy.
_______________________________
Notes
1
2
In this formulation TFPG can be obtained from ∆lnTFP = ∆lnYt−ϖ∆lnLt−(1−ϖ)∆lnKt,
where ∆ ln Yt = ln Yt – ln Yt-1, ∆ ln Lt = ln Lt – ln Lt-1, ∆ ln Kt = ln Kt – ln Kt-1, ϖ = average of share
of labour in output in period t and (t-1).
3
The NSSO survey on Unorganised Manufacturing Sector distinguishes three types of enterprises – (i) Own Account Manufacturing Enterprise (henceforth OAMEs) - manufacturing enterprise operating with no hired worker employed on a fairly regular basis; (ii) Non-Directory Manufacturing Establishments (henceforth NDMEs) - units employing less than 6 workers including household workers; and (iii) Directory Manufacturing Establishments (henceforth DMEs) - units employing 6 or more workers with at least 1 hired worker but not registered under the Factory Act. The two latest surveys are the 51st and the 56th Round surveys.
4
The 56th round (2000-01) NSS data uses NIC 1998 codes. They have been reclassified by the author using Annexe-III of ‘National Industrial Classification 1998’ to bring comparability with the 51st Round that use NIC 1987 codes.
5
The Textiles sector according to NIC-1998 includes Cotton Textiles, Natural Fibre products and Wool & Silk Textiles.
6
The 16 major states can be regionalised in the following manner. Northern – Punjab, Haryana, Himachal Pradesh and Delhi; Eastern – Bihar, West Bengal, and Orissa; Western – Rajasthan, Gujarat, and Maharashtra; Southern – Andhra Pradesh, Karnataka, Kerala, and Tamil Nadu; and Central – Uttar Pradesh and Madhya Pradesh.
7
In the last couple of years though, there has been some improvements in the technology front of the leather sector with the Central Leather Research Institute coming up with modern technology at cheaper rates, and the government supplementing it with the Indian Leather Development Programme wherein it provides 25 per cent subsidy towards the cost of modernisation.
References
Ahluwalia, I.J (1991) – ‘Productivity and Growth in Indian Manufacturing’, Oxford
University Press, New Delhi
Aigner, D.J., C.A.K. Lovell, and P. Schmidt (1977) - “Formulation and Estimation of
Stochastic Frontier Production Function Models”, Journal of Econometrics,
Vol. 6.
Battese, G.E. and T.J. Coelli (1992) - “Frontier Production Functions, Technical Efficiency
and Panel Data: With Application to Paddy Farmers in India”, Journal of
Productivity Analysis, Vol. 3.
Bauer, P.W. (1990) - “Recent Developments in the Econometric Estimation of Frontiers”,
Journal of Econometrics, Vol. 46.
Bhalla, Sheila (2000) – “Behind Poverty: The Qualitative Deterioration of Employment
‘Employment Generation in India,’ Department of Labour and Employment,
Govt. of India, Gandhinagar, February 2000.
Chenery, H., S. Robinson, and M. Syrquin (1986) – ‘Industrialisation and Growth: A
Comparative Study’, Oxford University Press, New York
Forsund, F.R., C.A.K. Lovell, and P. Schmidt (1980) - “A Survey of Frontier Pr oduction
Functions and of their Relationship to Efficiency Measurement”, Journal of
Econometrics, Vol. 13.
Ghate, Prabhu et al (1992) – ‘Informal Finance: Some Findings from Asia’, Oxford
University Press, Hong Kong
Greene, W.H. (1993) - “The Econometric A pproach to Efficiency Analysis”, in Fried, H.O.,
Lovell, C.A.K. and Schmidt, S.S. (eds.), ‘The Measurement of Productive
Efficiency’, Oxford University Press, New York.
Kalirajan, K.P., M.B. Obwona and S. Zhao (1996) - “A Decomposition of Total Factor
Productivity Growth: The Case of Chinese Agricultural Growth Before and
After Reforms”, American Journal of Agricultural Economics, Vol. 78.
Mamgain, R.P. and I.C. Awasthi (2001) – “Technology and Training for Informal Sector:
Need for New Initiatives” in Amit abh Kundu and Alakh N. Sharma (eds.)
‘Informal Sector in India – Perspectives and Policies’, Institute for Human
Development, New Delhi.
Meeusen, W. and J. van den Broeck (1977) - “Efficiency Estimation from Cobb - Douglas
Production Functions With Composed Error”, International Economic
Review, Vol. 18.
Mukherjee, Dipa and Ashok Mathur (2002) – “Technological Upgradation in the Informal
Manufacturing Sector: Possibilities and Problems”, Paper presented at the
National Seminar on ‘Making Informal Sector Viable and Growth Oriented’
at Sardar Patel Institute of Economic and Social Research, Ahmedabad
September, 2002
NSSO (1998) - Basic and Multiplier Data on Survey of Unorganised Manufacture: Non
directory Establishments and Own Account Enterprises, NSS 51st Round
(July 1994-June 1995) on CD-ROM (CD 699 & 700) from NSSO,
Government of India, New Delhi.
______ (1998a) - Unorganised Manufacturing Sector in India: Its Size Employment and
Some Key Estimates, NSS 51st Round (July 1994-June 1995) NSS Report
no: 433, NSSO, August, 1998, Government of India, New Delhi.
______ (2002) - Unorganised Manufacturing Sector in India 2000-2001 - Key Results, NSS
56th Round (July 2000-June 2001) NSS Report no: 477, NSSO, November,
______ (2002a) - Unorganised Manufacturing Sector in India 2000-2001 - Input, Output and
Value Added, NSS 56th Round (July 2000-June 2001) NSS Report no: 480,
NSSO, November, 2002, Government of India, New Delhi.
Oberai, A.S. and G.K. Chadha (2001) - "Job Creation in Urban Informal Sector in India:
Some Macro-Economic Policy Issues” in A.S. Oberai and G.K. Chadha
(eds.) ‘Job Creation in Urban Informal Sector in India: Issues and Policy
Options’, SAAT-ILO, New Delhi.
Schmidt, P. (1986) - “Frontier Production Functions” , Econometric Reviews, Vol. 4.
Shah, Amita (2001) – “Scalar Linkages in Industries: Implications for Productivity and
Employment” in Amitabh Kundu and Alakh N. Sharma (eds.) ‘Informal
Sector in India – Perspectives and Policies’, Institute for Human
Development, New Delhi.
__________ (2002) – “Making Informal Sector Viable and Growth Oriented”, Paper
presented at the National Seminar on ‘Making Informal Sector Viable and
Growth Oriented’ at Sardar Patel Institute of Economic and Social
Research, Ahmedabad, September, 2002
Solow, R.M. (1957) - “Technical Change and the Aggregate Production”, Review of
Economics and Statistics, Vol. 39, No. 3.
Unel, Bulent (2003) – “Productivity Trends in India’s Manufacturing Sector in the Last Two
Decades”, IMF Working Papers WP/03/22, International Monetary Fund.
Unni, J., N. Lalitha and U. Rani (2001) - "Economic Reforms and Productivity Trends in