Mango Fruit Quality Prediction using Associative
Classification Rules
Rattapol Pornprasit
Postharvest Technology Research Institute Chiang Mai University, Chiang Mai, Thailand.Postharvest Technology Innovation Center Commission on Higher education, Bangkok, Thailand
Juggapong Natwichai
Department of Computer Engineering Faculty of Engineering, Chiang Mai UniversityChiang Mai, Thailand
Bowonsak Srisungsittisunti
Department of Computer Engineering Faculty of Engineering, Chiang Mai UniversityChiang Mai, Thailand
ABSTRACT
Near-infrared (NIR) spectroscopy is a non-destructive technique which can provide the quality measurement for agriculture prod-ucts. In this paper, we propose an approach to utilize the NIR spec-trum for mango fruits quality prediction. The prediction model is based on one of the most prominent machine learning approaches, associative classification. The associative classifiers are trained from the spectrum data of each mango fruit, and the chemical prop-erty represented fruit quality as the class label. When a classifier is to be applied to predict the quality, the spectrum of the mango fruits is measured, and the class label is determined by the classi-fication rules subsequently. Series of experiments were conducted under various parameter settings to evaluate the accuracy of the prediction. The results showed that the highest accuracy, the opti-mal performance, can be obtained when the number of boxes, the number of partitions of each spectrum for rule generation, was set at 10, and the minimum support threshold and the minimum con-fidence threshold were set at 1% and 50%, respectively. Based on the thorough experiments, a guideline for optimal parameter deter-mination is also proposed for the practitioners.
General Terms:
Classification, Prediction, Machine learning
Keywords:
Associative classification rules, Mango fruits, Near-infrared spectroscopyifx
1. INTRODUCTION
The mango (Mangifera indicaL.) is a tropical fruit, which there is a high demand in the world market. In 2010, Office of Agri-cultural Economics (OAE) of Thailand reported that, Thailand had exported 22 million tons of mangoes creating 505 million Thai Baht revenue. Furthermore, the number was increased to 703 million Thai Baht by 37.5 million tons of mangoes in 2011. Although, the mango fruits are highly demanded but the qual-ity classification is still an important issue since the customers cannot taste the ripeness fruit. Furthermore, the precise quality-classification will need the mango fruits to be destroyed by the chemical testing [7, 17].
Near-infrared (NIR) spectroscopy is a non-destructive technique which can provide the quality measurement for agricultural prod-ucts. NIR spectroscopy was first used in agricultural applications
by Norris to measure moisture in grains [13]. Since then it has been used for rapid analysis of mainly moisture, protein and fat content of a wide variety of agricultural and food products [4, 6]. For mango fruits, it was first reported that NIR was used by Guthrie and Walse to assess dry matter (DM) [7]. Subsequently, the NIR had been applied for mango fruits in various ways.
Typically, the NIR reflectance information in the spectra from a sample fruit is used to predict the chemical composition of such sample by extracting the relevant information from many over-lapping peaks. Then, the predicted chemical composition is in-terpreted as the quality. Before the quality measurement by the NIR can be applied, the system has to be calibrated for the ac-curacy result. In general, the calibration can have the difficulties which are caused by the complex nature of the NIR reflectance spectra. In which each of the interesting spectrum is almost com-pletely overlapping by the others. The calibrated models require routine checking for improving the accuracy and reducing the estimation errors [14].
Generally, statistical analysis is used to analyze the spectrum data for discovering relationship between the spectrum and the chemical properties. After the particular spectrum is identified, the analysis is preceded. Multiple linear regressions (MLR), principle component regression (PCA), and partial least squares (PLS) are often applied for the calibration [11]. However, it might not be appropriated in practices, since the sample data can be updated. Or, the calibrated prediction model can be affected by the changing environments, and it can cause the error in the analysis.
An approach to build the prediction model, which can avoid the mentioned problems, is the machine learning. The prediction model update caused by the additional samples can be done with-out re-learn the whole samples. Additionally, more samples can help the prediction models more robust subjected to the change of the environment.
is the reflectance of each spectrum. In order to use the reflectance in the prediction models,the range of it is partitioned into the ranges, so called “box”. A box number together with its spec-trum number represents a part of the left-hand side (LHS) of the rules, while the chemical property represents the right-hand side (RHS) of the rules. After the set of rules are derived, the model will be used to predict the class of quality of the testing mango fruits, and the accuracy is calculated by comparing the predicted class and the actual class from the chemical property. Addition-ally, the performance of the proposed prediction method are eval-uated by the experiments. The minimum support threshold, the minimum confidence threshold and number of boxes will be in-vestigated in the experiments, since they are the main factors for the accuracy.
2. RELATED WORK
Kawanoet al.were the first group of researchers who proposed to apply NIR spectroscopy for sugar content determination in in-tact peaches and mandarins. Since then, NIRs have been widely applied in fruit and vegetable processing [8, 9]. Choi et al. developed a sorting-line based on NIR reflectance spectroscopy for real-time determination of sugar content [3]. In this work, a good result with a low root mean square error of prediction (SEP) of 0.78◦Brix was obtained in Fuji apples. Greensil and Newman reported the performance of three simple wavelength dispersion elements (single equilateral prism, two equilateral prisms in series, and ruled diffraction grating) for the design of a simple, low-cost, and robust NIR spectrometer for application in automated fruit grading systems [5]. They also proposed an effective the duel-prism NIR instrument and demonstrated a highly-reliable, rapid fruit sorting-line.
For mango fruits, Mizrach et al. shown that using a non-destructive ultrasonic measurement system in the appropriate frequency domain can assess the components of mango fruit ma-turity as well as estimate the shelf life [12]. Saranwonget al. have shown that NIR has the capability to evaluate soluble solid content (SSC) and DM in ripe mango fruits [15, 16]. And, Subedi et al.used the short wave NIR spectroscopy to predict the total soluble solids of green mango fruits after ripening which leads to the eating quality prediction [18].
Although, NIR spectroscopy technique has the capability to pre-dict the quality of the mango fruits, the calibration can be dif-ficult as mentioned in the introduction section. The calibration models obtained with derivative spectra are sometimes not robust to the environment changes. Thus, much experience, or exper-tise to preprocess NIR data are highly desired for the calibration model building. However, optimal preprocessing method selec-tion is often trial and error process, and it depends largely on the nature of the data and the practitioner’s experience or expertise.
For the associative classification [10, 19], it is based on the as-sociation rule mining [1, 2] which is to find all rules satisfying a minimum support threshold and a minimum confidence thresh-old.It was initially proposed to solve the co-relation analysis for market basket problem in transaction databases. Subsequently, it has been extended to solve many other types of problems such as classification problem. In which, the right-hand-side (RHS) of the rules is the pre-defined class label for the classification purpose. Typically, association rules are considered interesting if they satisfy both a minimum support threshold and a mini-mum confidence threshold. Such thresholds can be set by user or domain experts.
3. MATERIALS AND METHODS
Our work aims at applying the associative classification to pre-dict the Brix values which is measured from total soluble solid
(TSS) of the inside of the mature mango fruits at the harvesting period without destruction by NIR spectroscopy measurement. Such values affect the eating quality of the fruits after ripening [16, 18].
The mango fruits cv. Nam Dok Mai Si Thong used in the eval-uation were harvested form a farmer orchard in Phrao, Chiang Mai province. 300 mango fruits were harvested in 100, 110 and 120 days after the fruit set (100 fruits per each period). All of the fruits were transported to the evaluation site by a controlled temperature truck at 25 degree Celsius.
3.1 Spectroscopy acquisition
A commercially available NIR spectrophotometer, ‘HAMA-MATSU Mini-Spectrometers model C10083CAH (TM-VIS/NIR-CCD)’ in the interactance mode was used to measure the NIR spectra. The NIR measurements were obtained in the long wavelength region from 300 nm to 1000 nm. All of the spectra for the prediction model generation and prediction were the average value from 50 scans. A ceramic disc was used as the reference. During the NIR measurement, the temperature of the sample of mango fruits was controlled at 25 degree Celsius.
3.2 Chemical analysis
After the spectra acquisition, a portion of flesh of each fruit, which was illuminated by NIR radiation, was taken and analyzed for determination of the TSS (Brix). For the Brix value, the ripe mango portion was squeezed in fingers and then the juice was analyzed using a digital refractrometer model PAL-1 (ATAGO, Tokyo, Japan).
For eating quality, it was decided by the Brix values, i.e. the fruits were classified into (1) excellent and (2) acceptable groups. If the Brix value of a fruit was at least 17, it was classified as the excellent group. The rest were classified as the acceptable group.
3.3 Data processing
First, we describe the approach used for creating the training dataset. In order to obtain each data record, the spectra of each mango fruit formed the features of the training data record, its Brix value was used as the class label. In each spectrum, the dif-ference between the minimum value and the maximum value of the spectra was calculated to form the range of each feature.
These different values of each spectrum were partitioned into equal parts, so called “box”. For example, suppose that the mini-mum absorbance and maximini-mum of absorbance of a spectrum are 0.5 and 1.0 respectively. When the number of boxes is set at 5, the gap of the range is 0.1. So, the box number 1, 2, 3, 4, and 5 of this spectrum will have the range of 0.50-0.60, 0.61-0.70, 0.71- 0.80, 0.81-0.90 and 0.91- 1.00, respectively. If a fruit has its absorbance of the spectrum at 0.74, the box number of this sample is 3. The number of the boxes is pre-specified in a train-ing process.
Subsequently, the dataset is to be used in the training process for generating a prediction model based on the associative clas-sification rules. In which, the rules are discovered by exploring all of the frequent items, subjected by the minimum support and minimum confidence thresholds. The rules will be discovered when it has the number of items more or equal the minimum support thresholds. And, the discovered rules will be filtered out by the confidence value. The confidence value of each rule is ratio between number of item with actual class and number of item with all class. So, the discovered rules have the confidence value more or equal the minimum confidence thresholds become the performance rules. The form of the rules is bi∧bj∧...∧bn
class, where any biis the box number of the i-spectrum, and the
before. So, the performance rule discovery will find all rules that satisfy the user-specified minimum support and minimum con-fidence thresholds. If the minimum support threshold and the minimum confidence threshold are not set on suitable values, the number of performance rules may be too small which poor per-formance prediction. On other side, if the number of rules may be too large because there are many noise rules. The noise rules may disturb the prediction and reduce the accuracy. So, the per-formance rules will filter out by the suitable minimum support and minimum confidence threshold.
3.4 Prediction class for testing dataset
For the quality prediction, the mango fruits will be measured their reflectance spectra by the NIR measurement. Each spec-trum of a fruit was converted to the box number designated from the training phase. The classifier contained the classifica-tion rules from training dataset. Each fruit will be predicted its class of Brix or the class label. After the spectrum measurement and the class prediction are carried on, the Brix values are de-termined as the actual class. The accuracy of prediction will be computed by comparing the actual class with the predicted class.
4. RESULTS AND DISCUSSIONS
After the spectrum data and the TSS of the mango fruits are mea-sured for using as the training dataset. Such data records were classified into two classes, i.e. (1) excellent and (2) acceptable groups. The excellent group condition is that its Brix value is at least 17. Meanwhile the rest is to be classified as the accept-able group. For the spectrum data, 2048 spectrum in the NIR wavelength are measured for each mango fruit. And, the range of the TSS values of the mango fruits in the dataset were at 11-22◦Brix approximately. The ratio between the number of class
(1) and class (2) was approximately 1:1. The minimum confi-dence threshold, minimum support threshold, and the number of boxes were investigated to evaluate the accuracy of the classi-fication. Note here that the number of rules is also reported to further discuss the accuracy in details, since such number affects the performance of the rule-based classification which the asso-ciative classification is one among them.
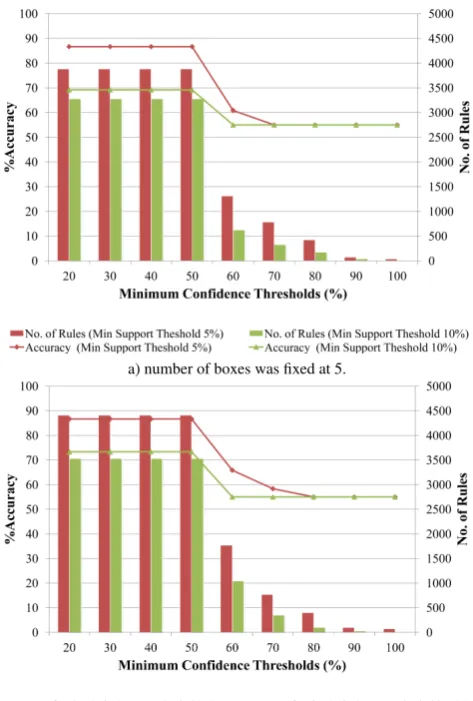
For the first experiment results, the effects of the minimum confi-dence threshold to the accuracy are reported. The minimum fidence thresholds are the criteria for filtering out the low con-fident associative classification rules. The minimum confidence threshold is varied from 20% to 100% to evaluate their effects. In this experiment, the minimum support threshold was fixed at 5% and 10%, meanwhile the number of boxes was fixed at 5 and 6. From Fig1, the results showed that the prediction accuracy and number of rules increased when the minimum confidence thresh-olds were reduced. Particularly, both values rapidly increased af-ter the threshold value was changed from 60% to 50%. The high-est accuracy was 86.67% at 50% minimum confidence threshold and all the number of boxes. Although the accuracy were re-mained intact, when the minimum confidence threshold was de-creased less than 50%. In addition, from the results, it can be seen that the numbers of rules is correlated to the predicting curacy, i.e. the larger number of rules results in the higher ac-curacy. This is because the increased number of rules in a rule-based classification can directly help increasing the performance of the classification. Also, the results showed that the accuracy of the classifier using 5% minimum support threshold was higher than the accuracy of the classifier using 10% minimum support threshold, in which the effect of such thresholds will be showed in next experiment. From the experiment, to find the optimal confidence threshold, it should begin with the highest minimum confidence threshold (100%). Subsequently, the threshold was reduced. This is an efficient approach to determine the optimal
a) number of boxes was fixed at 5.
[image:3.595.310.547.94.445.2]b) number of boxes was fixed at 6.
Fig. 1. Effects of the minimum confidence threshold to the accuracy.
threshold in practice, since the higher threshold experiments can be conducted faster.
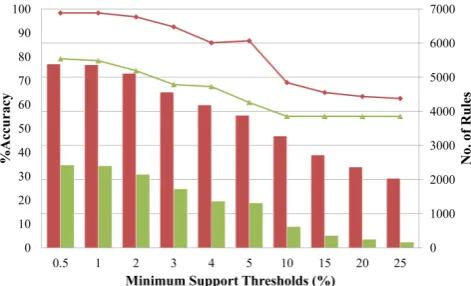
In this experiment, the effects of the minimum support thresh-old to the prediction accuracy were evaluated. The number of boxes was fixed at 5 and 6, and the minimum confidence old was fixed at 50% and 60%. The minimum support thresh-old was varied from 0.5% to 25% for the evaluation. From Fig 2, the highest prediction accuracy was at 98.33% at 50% mini-mum confidence threshold and the number of boxes was set at 5, when the minimum support threshold was set at 0.5 - 1%. Sub-sequently, the prediction accuracy decreased when the minimum support threshold increased. The reason behind this is that the minimum support threshold was used as a criterion for filtering out the less interested rules. Typically, the number of rules is re-duced when the minimum support threshold is increased. But, lacking of rules can degrade the performance of the prediction.
in-a) number of boxes was fixed at 5.
[image:4.595.51.287.97.240.2]b) number of boxes was fixed at 6.
Fig. 2. Effects of the minimum support threshold to the accuracy.
creasing number of rules resulted in the higher prediction accu-racy as well. When the number of boxes was increased up to 10-15, the accuracy started to drop. The reason is that the number of boxes affects the gap size between the boxes. Recalled here that a gap size is derived from the range of the maximum and minimum of the absorbance in a spectrum, in which such range is subsequently divided equally by the number of boxes. So, if the number of boxes is smaller, the gap size becomes wider. In the experiment, when the number of boxes was increased, the number of rules was higher because such smaller gap size can increase the number of literals for the derived rules. Such higher number of rules can then increase the prediction accuracy. How-ever, when the number of boxes was increased higher than 10-15, the gap size becomes too small. This is because of the mini-mum support threshold which can lessen the number of discov-ered rules. In addition, it can be seen that the prediction accuracy was decreased when the number of boxes reached 20. Although the number of rules was still high, in the case where the mini-mum support threshold was set at 5%. At such environment, the prediction accuracy was decreased due to the fact that the classi-fication model considered the noise data as the knowledge, and thus it contained a lot of low-performance rules.
It can be seen that the quality of mango fruit quality can predict by NIRs technique, i.e. high accuracy can be achieved. In this research, the prediction model was developed by the classifica-tion associaclassifica-tion rules. The minimum confidence, the minimum support and the number of box were used as the criteria for de-veloping the optimal performance prediction model. From the
a) minimum confidence threshold was fix at 50%.
b) minimum confidence threshold was fix at 60%.
Fig. 3. Effects of the number of boxes threshold to the accuracy.
experiments, the optimal performance was obtained when, the minimum confidence threshold was set at 50%, the minimum support threshold was set at 1%, and the number of boxes was set at 10. These parameters not only brought in the highest per-formance in terms of the prediction accuracy, but also the number of rules which affects the performance directly.
[image:4.595.50.288.270.429.2]we suggest that the setting should begin with five boxes since it is not too low to capture the details of the spectrum.
5. CONCLUSION
In this paper, a quality prediction approach of mango fruit based on the NIR measurement was proposed. Such prediction model was based on the associative classification. Each model in the ex-periments was generated under different parameters by varying the minimum support threshold, minimum confidence thresh-old, and the number of boxes. All parameters were discovered the suitable values for generating the performance model. In the experiments, the quality prediction processes began with mea-suring the NIR spectrum of the fruit samples. The fruit sam-ples were evaluated their chemical component, the Brix values. By such values were used as the actual class label. The spec-trum data and the actual class label were combined to a train-ing dataset. Then, the prediction models were generated from the training. Subsequently, the spectrum data of the sample were measured and the class label of such sample was predicted by the prediction model.
For accuracy evaluation, the actual class label and the predicted class label are compared. Such parameters can generate proper number of rules, as well as capture the details of the spectra. From this experiment, the suitable threshold for training the dataset was 50% of the minimum confidence threshold, the min-imum support threshold was 1% and the number of boxes was 10. The suitable thresholds can give the performance rules.
From the experiments, we can derive a guideline for the practi-tioners as follows. First, the minimum support threshold should be fixed at a less number for using to less time in training. Then, the minimum confidence threshold should be found from back-ward number by varied from 100% until the number of rules is stable. Finally, the dataset have to be trained for finding the number of boxes. The number of boxes will begin from the low number to high number. Increasing the number of boxes will in-crease the number of rules when the number of rules stabled or decreased, this number can perform the rules.
In our future work, we will further investigate an approach to eliminate the irrelevant spectrum. Furthermore, ensemble-based classification models will be studies, since the model robustness issue is to be addressed in the real-world environment.
6. REFERENCES
[1] R. Agrawal, T. Imieliski, and A. Swami. Mining associa-tion rules between sets of items in large databases. SIG-MOD Rec., 22(2):207–216, June 1993.
[2] R. Agrawal and R. Srikant. Fast algorithms for mining as-sociation rules. pages 487–499, 1994.
[3] C.H. Choi. Development of apple sorter by soluble solid content using photodiodes. InProceeding of Winter Con-ference of KSAM, 1, pages 362–367, 1998.
[4] A. M. C. Davies and A. Grant. Review: Near infra-red anal-ysis of food. International Journal of Food Science and Technology, 22(3):191–207, 1987.
[5] C.V. Greensil and D.S. Newman. An experimental compar-ison of simple nir spectrometers for fruit grading applica-tions. 17:63–76, 2001.
[6] S. Gunasekaran and J. Irudayaraj. Nondestructive food evaluation: techniques to analyze properties and qual-ity, chapter Optical methods: visible NIR and FTIR spec-troscopy. Marcel Dekker Inc., New York, USA, 2001. [7] J. Guthrie and K.B. Walsh. Non-invasive assessment of
pineapple and mango fruit quality using near infrared spec-troscopy. 37:253–263, 1997.
[8] S. Kawano, T. Fujiwara, and M. Iwamoto. Nondestructive determination of sugar content in satsuma mandarin using near infrared (nir) transmittance.Journal of the Japanese Society for Horticultural Science, 62(2):465–470, 1993. [9] S. Kawano, H. Watanabe, and M. Iwamoto. Determination
of sugar content in intact peaches by near infrared spec-troscopy with fiber optics in interactance mode.Journal of the Japanese Society for Horticultural Science, 61(2):445– 451, 1992.
[10] J. Li, H. Shen, and R. Topor. Mining optimal class associa-tion rule set. In David Cheung, Graham Williams, and Qing Li, editors,Advances in Knowledge Discovery and Data Mining, volume 2035 ofLecture Notes in Computer Sci-ence, pages 364–375. Springer Berlin / Heidelberg, 2001. [11] H. Martens, K. H. T. Naes, Norris, and P. C. Williams.
Near-Infrared Technology in the Agricultural and Food Industries (second edition), chapter Multivariate Calibra-tion by Data Compression. American AssociaCalibra-tion of Cereal Chemists, Inc., St. Pual, Minnesota, USA, 2001.
[12] A. Mizrach and U. Flitsanov. Nondestructive ultrasonic de-termination of avocado softening process.Journal of Food Engineering, 40(3):139 – 144, 1999.
[13] K. H. Norris. Design and development of a new moisture meter.Agricultural Engineering, 45(7):370–372, 1964. [14] B. G. Osborne, T. Fearn, and P. H. Hindle. Practical
NIR Spectroscopy with Applications in Food and Beverage Analysis. Longman Scientific and Technical ; Wiley, Har-low, Essex, England; New York, 2nd edition, 1993. [15] S. Saranwong, J. Sornsrivichai, and S. Kawano.
Improve-ment of pls calibration for bixavalue and dry matter of mango using information from mlr calibration.Journal of Near Infrared Spectroscopy, 9:287–265, 2001.
[16] S. Saranwong, J. Sornsrivichai, and S. Kawano. Perfor-mance of a portable near infrared instrument for brix value determination of intact mango fruit.Journal of Near In-frared Spectroscopy, 11:175–181, 2003.
[17] S. Saranwong, J. Sornsrivichai, and S. Kawano. Prediction of ripe-stage eating quality of mango fruit from its harvest quality measured nondestructively by near infrared spec-troscopy.Postharvest Biology and Technology, 31(2):137 – 145, 2004.
[18] P.P. Subedi, K.B. Walsh, and G. Owens. Prediction of mango eating quality at harvest using short-wave near in-frared spectrometry.Postharvest Biology and Technology, 43(3):326 – 334, 2007.