Vol. 29, 2011, No. 4: 420–429 Czech J. Food Sci.
Changes in baking quality of winter wheat with different
intensity of
Fusarium
spp.
Contamination detected
by means of new rheological system mixolab
Ludmila PaPouškoVá
1, Ivana CaPouChoVá
2, Marta koSteLaNSká
3,
alena škeříkoVá
2, evženie ProkINoVá
2, Jana haJšLoVá
3, Jaroslav SaLaVa
1and
oldřich FaMěra
21Division of Plant Genetics, Breeding and Product Quality, Crop research Institute, Prague,
Czech republic; 2Faculty of agrobiology, Food and Natural resources, Czech university of Life
Sciences Prague, Prague, Czech republic; 3Department of Food Chemistry and analysis,
Faculty of Food and Biochemical technology, Institute of Chemical technology Prague, Prague, Czech republic
Abstract
Papoušková L., Capouchová I., Kostelanská M., Škeříková A., Prokinová E., Hajšlová J., Salava J., Faměra O. (2011): Changes in baking quality of winter wheat with different intensity of Fusariumspp. contamination detected by means of new rheological system mixolab. Czech J. Food Sci., 29: 420–429.
The aim of our work was to assess the possibility of detecting the changes in the baking quality of winter wheat with different levels of Fusarium spp. contamination using a new rheological system Mixolab, and to determine the cor-relations between the Mixolab characteristics and other quality parameters of wheat flour and grain. The standard technological characteristics (crude protein, Zeleny sedimentation index, wet gluten, falling number), loaf volume, shape features of bread (height and diameter), Mixolab parameters, and mycotoxin deoxynivalenol (DON) content were determined in 3 winter wheat cultivars (Akteur – quality group E – elite; Eurofit – quality group A; Meritto – quality group B) with different levels of Fusarium spp. contamination (8 variants) in two years. Increasing intensity of Fusarium spp. contamination evidently worsened the rheological quality and its negative effects on protein and mainly on the starch part of the grain was obvious in Mixolab curves. High correlations were found between Mixolab characteristics and standard technological parameters, as well as between Mixolab parameters and the main baking criterion – loaf volume.
Keywords: winter wheat; Fusarium spp.; bread making quality; Mixolab
Supported by the Ministry of Education, Youth and Sports of the Czech Republic, Projects No. MŠMT 2B08049, and by the Ministry of Agriculture of the Czech Republic, Project No. MZE 0002700604.
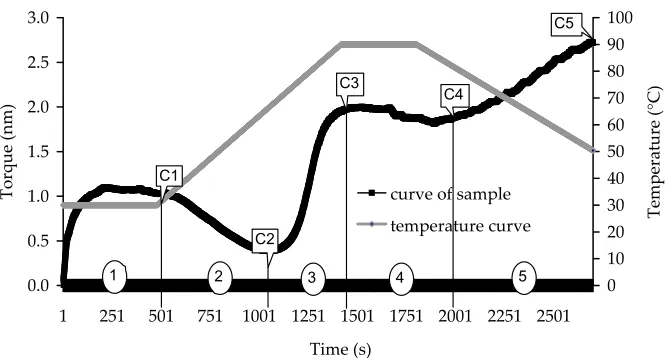
Mixolab is a relatively new system, accepted as the ICC standard method No. 173 (ICC 2006), which makes possible to evaluate physical dough properties such as dough stability or weakening, and starch characteristics in one measurement
Czech J. Food Sci. Vol. 29, 2011, No. 4: 420–429
curve is separated into five stages, characterised by five points (C1–C5) and other parameters result-ing from the differences between the individual points (Figure 1).
Characteristics evaluated from the measured Mixolab curve are:
is a decrease in the temperature and an increase in consistency as a result of the gel formation, and it is also related to the starch retrogradation (Rosell et al. 2007). This stage depends mainly on the level of amylose present, which starts the process of retrogradation. For example, for waxy wheat that contains only a low level of amylose, no increase of the curve is detected (Graybosch et al. 2003).
Mixolab parameters show, based on the results published up to now, high compatibility with stand-ard rheological analysis (for example farinograph, extensograph, or amylograph). Consequently, it is possible to anticipate a potential prediction of bread making quality of common wheat from these parameters (Cato & Mills 2008). But there are hardly any studies on the efficiency of this Mixolab system to predict rheological parameters of wheat with changed characteristics caused by fungi spe-cies, which have become a serious problem in the wheat cultivation during recent years. This fungi contamination, in cereals mainly Fusarium spp. contamination, causes not only grain yield loss but, because of their secondary metabolites mycotoxins, has also a negative health impact (Garcia et al. 2009). The most important is the trichothecene mycotoxin deoxynivalenol (DON), considered as a contamination marker subjected to the European Commission Regulation (EC 2006). DON maxi-mum level was set at 1250 μg/kg for unprocessed cereals and 750 μg/kg for cereal flours.
Besides these facts, several authors also men-tioned negative effects of Fuarium infection on bread making quality of wheat and the reduction of loaf volumes (Seitz et al. 1986; Nightingale et al. 1999; Gärtner et al. 2008). On the other hand, there are some contradictory studies where C1 used to determine water absorption
C2 represents the weakening of the protein based on the mechanical work and the increasing temperature
C3 represents the rate of starch gelatinisation C4 represents the stability of the hot-formed gel C5 represents starch retrogradation during
the cooling period
C1–C2 indicates the protein network strength under increasing heating
C3–C4 shows diastatic activity and relates with falling number
C5–C5 correlates with the anti-staling effects, rep-resents the shelf life of the end products Dough stability indicates the stability of the dough before weakening
2 0.063 30 3 0.083 30 4 0.108 30 5 0.133 30 6 0.158 30 7 0.183 30 8 0.208 30 9 0.233 30 10 0.258 30 11 0.286 30 12 0.316 30 13 0.343 30 14 0.368 30 15 0.395 30 16 0.419 30 17 0.441 30 18 0.464 30 19 0.488 30 20 0.508 30 21 0.523 30 22 0.535 30 23 0.543 30 24 0.549 30 25 0.555 30 26 0.563 30 27 0.571 30 28 0.578 30 29 0.584 30 30 0.591 30 31 0.594 30 32 0.599 30 33 0.607 30 34 0.62 30
0.0 0.5 1.0 1.5 2.0 2.5 3.0
1 251 501 751 1001 1251 1501 1751 2001 2251 2501 Time (s) To rq ue (n m ) 0 10 20 30 40 50 60 70 80 90 100 Te m pe ra tu re (° C )
curve of sample temperature curve
C1
C2
C3 C4
C5
[image:2.604.64.399.80.259.2]1 2 3 4 5
Figure 1. Standard Mixolab curve
Vol. 29, 2011, No. 4: 420–429 Czech J. Food Sci.
a strong Fusarium contamination did not sig-nificantly influence the bread making properties (Antes et al. 2001; Prange et al. 2005).
The aim of this work is (i) to confirm the cor-relations between the Mixolab characteristics and other quality parameters of wheat flour and grain; (ii) to detect the changes in the baking quality of winter wheat due to different levels of Fusarium spp. contamination using the new rheological system Mixolab.
mATEriAL And mETHOds
Plant material. A set of 24 winter wheat
sam-ples from the exact field plot trial, conducted in the years of 2008 and 2009 on the experimental station of the Department of Crop Production of the Czech University of Life Sciences Prague in Uhříněves (295 m above sea level, average annual temperature 8.4°C, average sum of precipitation 575 mm), was used for the evaluation of the bread making quality and DON content in grain. The set included 3 winter wheat cultivars (Akteur – qual-ity group E; Eurofit – qualqual-ity group A; Meritto – quality group B) and 8 variants coming from the field plot trial.
Artificial inoculation and evaluation of
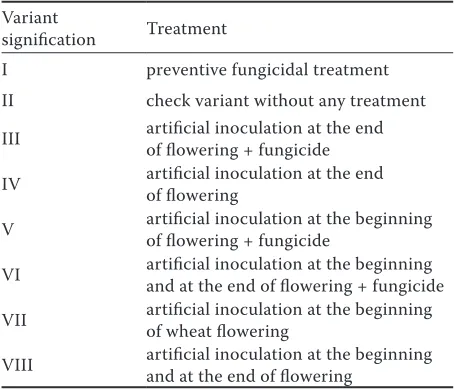
Fusari-um spp. infestation. Different conditions were used of artificial inoculation of wheat with Fusarium spp. and simultaneously several ways of fungicide treatment, with the aim to obtain a scale of samples with different levels of Fusarium spp. contamina-tion. The list of variants is given in Table 1.
The isolates of F. culmorum and F. graminearum used for the artificial inoculation were obtained from the mycological collection of the Crop Re-search Institute in Prague and cultivated on sterile wheat grains. The preparation of inoculums for the application: wheat grains with the cultures of F. cul-morum and F. graminearum were put into a vessel with water and shaken for 15 min in a laboratory shaker to release the spores into water. The obtained suspension was filtered through the gauze. Then artificial inoculation was made with the suspension of F. culmorum and F. graminearum spores in the ratio of 1:1, 107 of spores/ml(Bürker chamber was used for the verification of inoculums density), 2 l of suspension per experimental plot (12 m2). The suspension was dosed according to the list of vari-ants with a hand sprayer at the beginning and at the end of the wheat flowering. The fungicide (effective substances prothioconazole and tebuconazole) was applied two days before the inoculation.
Grain samples were taken for the evaluation after the wheat harvest. PCR assay was used for Fusarium spp. detection. Total DNA was extracted from the grain samples using the DNeasy Plant Mini Kit (Qiagen, Hilden, Germany). The sequences of the primers, PCR reaction mixture, and the conditions used for detecting F. culmorum and F. graminearum in this study were identical to those described by Schilling et al. (1996). This type of PCR assay enables to distinguish only the intensity of Fusarium spp. attack without quan-titative formulation, therefore the DON content was considered as an indicator of the intensity of Fusarium spp. contamination.
Deoxynivalenol content. UPLC-TOF MS system
[image:3.604.72.299.562.757.2]consisting of Ultra-Performance Liquid Chro-matography (Acquity, Waters, USA) coupled to a time-of-flight mass spectrometer (LCT Premier, Waters, USA) was used for the determination of deoxynivalenol (DON) in wheat grain. All of wheat samples were milled and homogenised prior to the extraction procedure. The representative sample (12.5 g) was extracted with 50 ml of acetonitrile: water mixture (84:16, v/v) for 60 minutes. An al-iquot of the crude extract (4 ml) was evaporated to dryness and the residue was than dissolved in 1 ml of methanol:water (1:1, v/v) mixture. For the separation of analytes, Acquity UPLC HSS T3 column (100 × 2.1 mm i.d., 1.7 µm particle size, Waters, USA) was used. The working parameters of the analytical method were established as follows: flow rate 0.3 µl/min, column temperature 40°C, Table 1. List of the field plot variants
Variant
signification Treatment
I preventive fungicidal treatment II check variant without any treatment III artificial inoculation at the end of flowering + fungicide
IV artificial inoculation at the end of flowering
V artificial inoculation at the beginning of flowering + fungicide
VI artificial inoculation at the beginning and at the end of flowering + fungicide
VII artificial inoculation at the beginning of wheat flowering
injection volume 5 µl, auto-sampler temperature 10°C, the mobile phase consisted of 5mM ammo-nium formiate in water (A) and methanol (B). The fast linear gradient program for the separation of the target compounds was used. The orthogonal time-of-flight mass spectrometer was operated in the negative electro-spray ionisation (ESI-) mode. Capillary voltage was set at 3500 V, cone voltage 40 V, source temperature 120°C, desolva-tion temperature 350°C. Nitrogen was used as a solvent as well as cone gas; its flow rates were 750 l/h and 10 l/h, respectively. Target analytes were identified according to their retention times and accurate masses. Software MassLynx 4.1 with the application of QuanLynx manager was used for the data acquisition and processing.
Sample preparation for technological quality
evaluation. The wheat grain samples were
puri-fied using sieves (2.2 × 22 mm) and conditioned to 15.5% moisture before milling on a Bühler mill automat MLU 202. Milling proceeded in two sec-tions divided into three parts with different condi-tions of grinding and sieving. All milling fraccondi-tions (3 fractions of break flour and 3 fractions of reduc-tion flour) were collected (total flour yield 65% approximately) and used for the evaluation of the rheological properties and for the baking trial.
Bread making quality analyses. Within the
frame of the bread making quality, crude protein content (CP) according to Kjeldahl method (EN ISO 20483; ICC-Standard No.105/2), wet gluten content (WG) in grain dry matter using the ap-paratus Glutomatic Perten (ISO 5531), falling number (FN) – ISO 3093, Zeleny sedimentation index (ZS) – ISO 5529, and ash content (AC) – ISO 2171 were determined.
Bread was made according to the internal pro-tocol from flour (300 g), yeast (12 g), fat (3 g), sugar (4.5 g), salt (5.1 g). The dough was kneaded using a farinograph with the water addition ac-cording to the determined retention capacity of the flour. The dough heaved in thermostat for 45 min in 30°C and then it was divided to four ball-shaped parts and left in a thermostat for 50 minutes. Afterwards, the pieces were put in the oven at 240°C for 14 minutes. After cooling (90 min), baking characteristics were measured, i.e. the height (H) and diameter (D) of breads, and the ratios H/D were calculated. The loaf volumes (LV) were determined by rapeseed displacement.
Mixolab determination. Rheological
character-istics were determined using the apparatus Mixolab
(Chopin, Tripette et Renaud, Paris, France) accord-ing to the Mixolab protocol Chopin+ for white flour (Mixolab appl. Handbook, 2008). Point C1 was not included in the final evaluation because this side point is sufficiently represented by the difference between points C1 and C2 (C1C2).
Statistical analysis. The results were
statisti-cally evaluated by the one-way analysis of variance (ANOVA) with subsequent Tukey HSD test. Their relations were assessed by the correlation analysis with the statistical significance expression on the level α = 0.05; 0.01. The calculation was done in the software STATISTICA 8.0 CZ (StatSoft).
rEsULTs And disCUssiOn
intensity of Fusariumspp. infection and dOn content
The levels of Fusarium spp. infection and DON content in the individual grain samples are sum-marised in Table 2, where the differences are visible between the individual years, experimental variant, and cultivars. In 2008, the infection grade was evi-dently higher than in 2009. It was most likely due to the climatic conditions during wheat flowering, which were favourable for a fast development of Fusarium inoculum in that year.
There are conflicting reports on the correlation between the Fusarium infection grade and DON content. Some authors did not confirm positive correlation between the infection grade and DON content (Kushiro 2008; Garcia et al. 2009) while others found a high positive significant correla-tion (Snijders 2004). Nevertheless, in the case of a strong infection pressure evoked by artificial inoculation is it possible to suppose also a high DON content.
Vol. 29, 2011, No. 4: 420–429 Czech J. Food Sci.
Effect of Fusariumspp. infection on mixolab parameters
The average values of Mixolab characteristics for specific variants, years, and wheat cultivars and their statistical comparisons are shown in Table 3. Visible variations were found between the variants, years, as well as cultivars.
The value of dough torque for parameter C2 represents the dough strength decreases from variants I and II to the most infected variant VIII. It is in accordance with the values of the techno-logical characteristics relating to protein like wet gluten and Zeleny sedimentation index.
[image:5.604.70.541.110.524.2]As was predicted from the values of the falling number, Mixolab parameters C3 and C4 which imply the starch damage were again the worst for variant VIII. The dough with such results is usu-ally stickier and can have a poor baking quality (Dexter et al. 1985). In our case, the low value of Mixolab characteristic C5 for this variant, which represents the rate of retrogradation, verifies the worse quality of the starch part of the wheat grain (Collar et al. 2006). The final bread from such dough may have a similar value of the loaf vol-ume but it is possible to anticipate undesirable changes of the shape (Nightingale et al. 1999), as confirmed by our results (Figure 2).
Table 2. Fusarium infection grade of wheat samples (PCR assay using specific primers) and individual DON content in grain
Variant Cultivar
2008 2009
F. culmorum F. graminearum DON content (µg/kg) F. culmorum F. graminearum DON content (µg/kg)
I
Meritto + – n.d. + – 148
Akteur + – 12 + – 148
Eurofit – – n.d. + – 54
II
Meritto ++ + 266 + + 111
Akteur ++ – 151 + – 117
Eurofit ++ – 211 – + 4
III
Meritto ++ – 337 + – 117
Akteur ++ + 756 + – 174
Eurofit ++ – 324 – – 502
IV
Meritto + – 638 + – 436
Akteur +++ + 1695 ++ – 2148
Eurofit + – 578 + – 271
V
Meritto ++ – 2324 + – 1114
Akteur ++ – 2433 + – 764
Eurofit ++ – 1489 + – 994
VI
Meritto ++ + 2443 + – 727
Akteur ++ – 3556 + – 1418
Eurofit ++ + 2388 + – 294
VII
Meritto +++ + 6146 ++ + 664
Akteur +++ + 6304 ++ + 632
Eurofit ++ + 3889 ++ + 1053
VIII
Meritto +++ + 7335 ++ + 1700
Akteur +++ + 5747 ++ + 1568
Eurofit ++ – 6595 ++ – 1053
Mixolab distinguished sensitively the variations among the baking quality of the cultivars and also the shifts in the characteristics in the individual years (Figure 3). According to the figure the cultivars kept their features in compliance with their quality group. The higher quality cultivars, Akteur and Eu-rofit, overtopped the worse quality cultivar Meritto in both years monitored. In 2008, when Fusarium spp. infection was higher, there was a clear shift in the curves to a worse baking quality than in 2009. Higher differences were recorded for the starch part of the wheat grain, which could have been caused by an early hydrolysis of damaged starch in more infected grains (Barrera et al. 2007).
The sensitivity of Mixolab detection of single variants with a different intensity of Fusarium spp.
[image:6.604.64.532.102.322.2]contamination is demonstrated on the cultivar Eu-rofit (Figure 4). Clearly shown is the effect of the intensity of Fusarium spp. infection on rheological characteristics and the shift of individual curves. Variants I and II with the lowest intensity of infection displayed the best stability and the lowest decline of the curve in the protein part. In the starch part the highest increase of viscosity was observed which indicated undamaged starch grains. On the contrary, variants VII and VIII showed a considerable fall of dough consistency, which denotes inferior quality of gluten, and a worse course of the curve in the starch part. This result is in agreement with the low falling numbers of these variants. The last part of the curve also showed the smallest increase as a result of the low viscosity of the dough (Grant 1998).
Table 3. Average values of Mixolab characteristics and DON content for individual variants, years and wheat cultivars
C2 (nm) C3 (nm) C4 (nm) C5 (nm) C1C2 (nm) C3C4 (nm) C5C4 (nm) DS (min) DON (µg/kg) I 0.46cd 2.04c 1.76bc 2.44bc 0.66ab 0.29a 0.68bc 7.8ab 40.7a II 0.47d 2.06c 1.80c 2.55c 0.63b 0.26a 0.76c 8.2b 162.9a III 0.44bcd 2.00bc 1.65abc 2.28abc 0.66ab 0.35a 0.63abc 7.6ab 312.2a IV 0.40abc 1.93abc 1.62abc 2.27abc 0.69abc 0.31a 0.64abc 7.2ab 961.0ab V 0.39abc 1.90ab 1.53abc 2.13ab 0.71abc 0.36a 0.6abc 6.3a 1519.7ab VI 0.37ab 1.84a 1.47a 1.94a 0.73bc 0.37a 0.48ab 6.7a 1804.3abc VII 0.36a 1.86ab 1.51ab 1.93a 0.74bc 0.35a 0.42a 6.1a 3022.8bc VIII 0.35a 1.81a 1.43a 1.91a 0.75c 0.38a 0.49ab 6.3a 4002.7c 2008 0.37a 1.81a 1.45a 1.97a 0.74b 0.36a 0.52a 6.5a 2317.4b 2009 0.44b 2.05b 1.74b 2.39b 0.65a 0.31a 0.65b 7.5b 639.2a EUROFIT 0.43a 2.03a 1.75a 2.31b 0.68a 0.28a 0.57b 7.8a 1175.7a AKTEUR 0.42a 2.01a 1.73a 2.54c 0.68a 0.28a 0.81c 8.4a 1727.6a MERITTO 0.37b 1.75b 1.31b 1.69a 0.72b 0.44b 0.38a 5.0b 1531.6a
[image:6.604.71.290.617.733.2]Values with different letter combinations are statistically significant at P ≤ 0.05 (probability of error max. 5%); LOQ (DON) = 5 µg/kg; C2 – protein weakening; C3 – starch gelatinization; C4-stability of gel; C5 – starch retrogradation; C1C2 – fall of protein strength; C3C4 – diastatic activity; C5C4 – anti-stalling effect; DS – stability of the dough before weakening
Vol. 29, 2011, No. 4: 420–429 Czech J. Food Sci.
Changes in technological and baking characteristics
The effect of Fusarium spp. infection was vis-ible in both protein and starch parts of the wheat grain and markedly influenced the technological characteristics of the grain (Table 4). Some authors mentioned an increase of protein content after the Fusarium spp. contamination (Boyacioğlu & Hettiarachchy 1995), but others, for ex-ample Dexter et al. (1997) and Gärtner et al. (2008), mentioned a slight decrease of it. In our case, slight decrease occurred of protein and wet gluten contents in the most infected variant VIII in comparison with variants I and II. The Zeleny sedimentation index measures the swelling po-tential of the kernel protein. Meyer et al. (1986) and Gärtner et al. (2008) observed general re-duction of Zeleny index in wheat grains after FHB
[image:7.604.71.421.83.251.2]infection. This indicates that although the total amount of protein remains quite stable, the infec-tion may alter its quality. According to Hareland (2003), fungal infection is expected to increase the degradation of starch due to the presence of enzymes such as α-amylase in the kernels which is measurable by means of the falling number. These findings are in accordance with our results – ZS and FN showed distinctively decreased values in the inoculated variants (the worst values for vari-ant VIII). An increase of ash content of flour was recorded in the artificially inoculated variants. Ash is mainly composed of minerals of the seed coat (bran and aleurone). The proportion of ash in flour is therefore an indicator of its purity, as increasing ash content indicates an alteration in the kernel seed coat–volume ratio. It is possible to associate this observation with the presence of shrivelled, misshapen fusarium-infected kernels Figure 3. Mixolab curves for individual cultivars in 2008 and 2009 (variant VIII)
0.0 0.5 1.0 1.5 2.0 2.5 3.0
1 186 371 556 741 926 1111 1296 1481 1666 1851 2036 2221 2406 2591
Time (s)
To
rq
ue
(n
m
)
Akteur VIII 09 Eurofit VIII 09
Meritto VIII 09 Akteur VIII 08
Eurofit VIII 08 Meritto VIII 08
0.0 0.5 1.0 1.5 2.0 2.5 3.0
1 196 391 586 781 976 1171 1366 1561 1756 1951 2146 2341 2536 Time (s)
To
rq
ue
(n
m
)
Eurofit I 08 Eurofit II 08 Eurofit III 08 Eurofit IV 08 Eurofit V 08 Eurofit VI 08 Eurofit VII 08 Eurofit VIII 08
[image:7.604.70.429.556.752.2](Jones & Mirocha 1999). This observation is probably in connection with the lower values of the flour yield with more infected variants which was also confirmed by our results. Likewise, the loaf volumes and ratios between the height and diameter of bread had a descending tendency with progressive infection and DON content. These results are in agreement with those of Dexter et al. (1996), who reported clear deterioration of bread making quality owing to high Fusarium spp. contamination.
relationship between mixolab parameters, dOn content, technological and baking
characteristics
Highly significant negative correlations were found between the values of Mixolab individual points (C2, C3, C4, C5) and DON content indicat-ing the intensity of Fusarium spp. contamination. This shows a high response of Mixolab to the changes of wheat grain caused by Fusarium spp. infection (Table 5).
The significant relations found between Mixolab characteristics and standard technological param-eters, especially ZS and FN, confirmed the already
published knowledge (Ozturk et al. 2008; Codină et al. 2010). Highly significant correlations were also found between Mixolab and flour character-istics (flour yield; ash content) as well as between Mixolab and baking parameters (LV; ratio of H/D). According to our presumption the higher values of Mixolab parameters C2 to C5 showed positive relations with the baking characteristics whereas the increasing differences C1C2 and C3C4 indicated deterioration of the bread making quality.
COnCLUsiOn
The high sensitivity of Mixolab system for moni-toring the changes in rheological characteristics of winter wheat with different intensities of Fusarium spp. contamination was confirmed in our study. Increasing intensity of Fusarium spp. contamina-tion worsened rheological quality and hence took up a negative effect on protein and mainly on the starch part of Mixolab curves. The evaluated wheat cultivars kept the bread making quality according to their quality classification notwithstanding the infection grade of the individual cultivars.
High correlations were found between Mixolab characteristics and the standard technological param-Table 4. Average values of quality characteristics for individual variants (I-the lowest; VIII-the highest grade of DON content), years and wheat cultivars
CP (%) WG (%) ZS (ml) FN (s) LV (ml) H/D FY (%) AC (%) I 15.0ab 32.2ab 57.0b 365.3cd 272.9c 0.62bc 65.79ab 0.59b II 15.3b 33.2b 56.7b 380.0d 275.5c 0.66c 65.57ab 0.59b III 14.7ab 31.7ab 49.7a 330.2bcd 259.9bc 0.60bc 66.66b 0.60b IV 14.6ab 31.5ab 46.8a 303.0abc 250.2ab 0.60bc 65.62ab 0.68a V 14.8ab 31.9ab 47.7a 298.2ab 246.1ab 0.57abc 65.01ab 0.69a VI 14.6ab 31.5ab 47.7a 290.3ab 246.8ab 0.54abc 65.56ab 0.69a VII 14.7ab 31.7ab 45.2a 270.5ab 237.8a 0.49ab 63.51a 0.70a VIII 14.5a 31.2a 44.2a 257.7ab 235.7a 0.45a 64.94ab 0.71a 2008 14.9b 31.5a 53.2b 297.2a 249.1a 0.52a 62.54a 0.64b 2009 14.7a 32.2b 45.5a 326.6b 257.1b 0.61b 68.12b 0.67a EUROFIT 15.1b 32.8a 51.1a 305.1a 258.8a 0.57a 66.17b 0.65a AKTEUR 15.6c 33.5a 52.2a 332.4a 255.1a 0.57a 67.47b 0.66a MERITTO 13.7a 29.3b 44.8b 298.2b 245.5b 0.56a 62.36a 0.66a
[image:8.604.65.532.114.335.2]Vol. 29, 2011, No. 4: 420–429 Czech J. Food Sci.
Collar C., Santos E., Rosell C.M. (2006): Significance of dietary fiber on the viscometric pattern of pasted and gelled flour-fiber blends. Cereal Chemistry, 83: 370–376. Dexter J.E., Clear R.M., Preston K.R. (1996): Fusarium
head blight: Effect on milling and baking of some Cana-dian wheats. Cereal Chemistry, 73: 695–701.
Dexter J.E., Preston K.R., Tweed A.R., Kilborn R.H., Tipples K.H. (1985): Relationship of flour starch damage and flour protein to the quality of Brazilian-style hearth bread and remix pan bread produced from hard red spring wheat. Cereal Foods World, 30: 511–514.
Dexter J.E., Marchylo B.A., Clear R.M., Clarke J.M. (1997): Effect of Fusarium head blight on semolina mill-ing and pasta-makmill-ing quality of durum wheat. Cereal Chemistry, 74: 519–525.
EC (2006): Commission Regulation (EC) No.1881/2006 of 19 December 2006 setting maximum levels for certain contaminants in foodstuffs. Official Journal of the Euro-pean Union, L364: 5–24.
Garcia D., Ramos A.J., Sanchis V., Marín S. (2009): Predicting mycotoxins in food: A review. Food Microbi-ology, 26: 757–769.
Gärtner B.H., Munich M., Kleijer G., Mascher F. (2008): Characterisation of kernel resistance against Fusarium infection in spring wheat by baking quality and mycotoxin assessments. European Journal of Plant Pathology, 120: 61–68.
Grant L.A. (1998): Effects of starch isolation, drying, and grinding techniques on its gelatinization and retrograda-tion properties. Cereal Chemistry, 75: 590–594. eters such as Zeleny sedimentation index or falling
number as well as the main baking criteria – loaf volume and the shape features of the bread.
The complex rheological evaluation, low amount of the sample examined (about 45 g of flour), and fully automated analysis predestines the rheological system Mixolab for the prediction of the techno-logical quality of flour in both food industry and breeding programmes.
references
Antes S., Birzele B., Prange A., Krämer J., Meier A., Dehne H.W., Köhler P. (2001): Rheological and bread-making properties of wheat samples infected with Fusa- rium spp. Mycotoxin Research, 17: 76–80.
Barrera G.N., Pérez G.T., Ribotta P.D., León A.E. (2007): Influence of damaged starch on cookie and bread-mak-ing quality. European Food Research and Technology, 225: 1–7.
Boyacioğlu D., Hettiarachchy N.S. (1995): Changes in some biochemical components of wheat grain that was infected with Fusarium graminearum. Journal of Cereal Science, 21: 57–62.
Cato L., Mills C. (2008): Evaluation of the MixoLab for as-sessment of flour quality. Food Australia, 60: 577–581. Codină G.G., Mironeasa S., Bordei D., Leahu A. (2010):
[image:9.604.73.542.101.273.2]Mixolab versus alveograph and falling number. Czech Journal of Food Sciences, 28: 185–191.
Table 5. Correlations among the evaluated parameters
CP WG ZS FN LV H/D FY AC
C2 0.37** 0.53** 0.35** 0.80** 0.75** 0.77** 0.68** –0.72**
C3 0.51** 0.68** 0.23 0.64** 0.64** 0.66** 0.83** –0.56**
C4 0.58** 0.71** 0.30* 0.58** 0.62** 0.59** 0.74** –0.50**
C5 0.65** 0.75** 0.36* 0.69** 0.62** 0.61** 0.80** –0.54**
C1C2 –0.27 –0.45** –0.18 –0.75** –0.65** –0.75** –0.69** 0.66** C3C4 –0.54** –0.59** –0.34* –0.36* –0.46** –0.36* –0.44** 0.28* C5C4 0.62** 0.66** 0.37** 0.69** 0.50** 0.51** 0.72** –0.48** DS 0.75** 0.81** 0.47** 0.59** 0.59** 0.48** 0.68** –0.50** DON –0.04 –0.19 –0.18 –0.77** –0.72** –0.85** –0.51** 0.71**
Graybosch R.A., Souza E., Berzonsky W., Baenziger P.S., Chung O. (2003): Functional properties of waxy wheat flours: genotypic and environmental effects. Jour-nal of Cereal Science, 38: 69–76.
Hareland G.A. (2003): Effects of pearling on falling number and alpha-amylase activity of preharvest sprouted spring wheat. Cereal Chemistry, 80: 232–237.
ICC (2006): Whole Meal and Flour from t. aestivum – De-termination of Rheological Behavior as a Function of Mixing and Temperature Increase. Standard Method No. 173. International Association for Cereal Science and Technology.
Jones R.K., Mirocha C.J. (1999): Quality parameters in small grains from Minnesota affected by Fusarium head blight. Plant Disease, 83: 506–511.
Kahraman K., Sakıyan O., Ozturk S., Koksel H., Sum-nu G., Dubat A. (2008): Utilization of Mixolab to predict the suitability of flours in terms of cake quality. European Food Research and Technology, 227: 565–570.
Kushiro M. (2008): Effects of milling and cooking process-es on the deoxynivalenol content in wheat. International Journal of Molecular Sciences, 9: 2127–2145.
Meyer D., Weipert D., Mielke H. (1986): Beeinflussung der Qualität von Weizen durch den Befall mit Fusarium culmorum. Getreide, Mehl und Brot, 40: 35–39. Mixolab Applications Handbook (2008): Rheological and
Enzymatic Analysis. Chopin Applications Laboratory.
Nightingale M.J., Marchylo B.A., Clear R.M., Dexter J.E., Preston K.R. (1999): Fusarium head blight: Effect of fungal proteases on wheat storage proteins. Cereal Chemistry, 76: 150–158.
Ozturk S., Kahraman K., Tiftik B., Koksel H. (2008): Predicting the cookie quality of flours by using Mixo- lab. European Food Research and Technology, 227: 1549–1554.
Prange A., Birzele B., Krämer J., Meier A., Modrow H., Köhler P (2005): Fusarium-inoculated wheat: de-oxynivalenol contents and baking quality in relation to infection time. Food Control, 16: 739–745.
Rosell C.M., Collar C., Haros M. (2007): Assessment of hydrocoloid on the thermomechanical properties of wheat using the Mixolab. Food Hydrocolloids, 21: 452–462.
Seitz L.M., Eustace W.D., Mohr H.E., Shorgen M.D., Yamazaki W.T. (1986): Cleaning, milling and baking tests with hard red winter wheat containing deoxynivalenol. Cereal Chemistry, 63: 146–150.
Schilling A.G., Möller E.M., Geiger H.H. (1996): Polymerase chain reaction-based assays for species-spe-cific derection of Fusarium culmorum, F. graminearum and F. avenaceum. Phytopathology, 86: 515–522. Snijders C.H.A. (2004): Resistance in wheat to Fusarium
infection and trichothecene formation. Toxicology Let-ters, 153: 37–46.
Received for publication November 4, 2010 Accepted after corrections April 4, 2011
Corresponding author:
Ing. Ludmila Papoušková, Výzkumný ústav rostlinné výroby, Odbor genetiky, šlechtění a kvality produkce, Drnovská 507, 161 06 Praha, Česká republika