It is necessary to establish a standardised allergen extract protocol for clinical diagnosis and treat-ment. At present, the diagnosis and treatment of food allergens depend mainly upon the detection of specific IgE antibody in serum and skin prick, or double-blind placebo-controlled food challenges, also known as gold standard in the diagnosis of food allergens. Hence, it is very essential to obtain an ideal standard extract through detection of IgE as the fixed antigen in the serum. The ideal standard extract includes the major allergen proteins and the minor allergen proteins, having said that the protein content should be identical and activated. Hence, selecting an appropriate extraction method is a prerequisite for extracting the variety of al-lergen proteins.
Fish plays an important role in human nutrition as a valuable source of protein having highly assimilative
capacities. However, fish is known to be one of the most frequent causes of food allergies, especially in the coastal areas and communities involved in fish consuming and processing(Sampson 2004). Fish allergic patients come up with symptoms such as asthma, diarrhoea, erythema, etc., leading to allergic shocks and even life threatening experiences.
In a recent survey conducted in China, fish aller-gens caused bronchial asthma in childrenin 44 out of 216 (20.3%) cases (Wu et al. 2009). Most fish allergies are IgE-mediated hypersensitivities resulting from the ingestion of or contact with fish or fish products, or inhalation of vapours arising during the fish cooking process (Pascual et al. 2008). Such previous reports significantly reveal that the fish allergens are very harmful to the patients who are exposed to the al-lergic activity through fish consumption. On the one hand, there is a requirement for a strict detection
Optimisation of an Extraction Technique of Fish Allergens
Suitable for Detection and Diagnosis
Jiaju Ma, Tushar Ramesh Pavase, Zhen-Xing Li* and Hong Lin Food safety Laboratory, Ocean University of China, Qingdao, P.R. China
*Corresponding author: [email protected]
Abstract
Ma J., Pavase T., Li Z., Lin H. (2017): Optimisation of an extraction technique of fish allergens suitable for detec-tion and diagnosis. Czech J. Food Sci., 35: 24–31.
An optimised protocol for the extraction of allergenic proteins in fish was developed. Twelve existing or modified extrac-tion buffers were evaluated based on the amount and quality of obtained 12 kDa IgG-binding protein (major fish allergen parvalbumin) by SDS-PAGE, immunoblotting, and ELISA. The results indicated that using DL-Dithiothreitol during the extraction process, the stability and functionality of the final extract were significantly increased. Solution 3 (containing Tris-HCl, Glycine, and DL-Dithiothreitol) yielded the highest amount of parvalbumin. The extract also induced a higher allergenic reactivity to the three tested human sera by immunoblotting. The results indicated that solution 3 provided better results in fish allergen detection and diagnosis. In conclusion, our study discovered and established solution 3 (Tris-HCl + Glycine + DTT) as the most potential buffer to overcome the conventional allergen extraction buffer and therefore it is highly recommended as a substitute optimised extraction buffer.
Keywords: parvalbumin; purification; ELISA; immunoblotting
action of fish allergen, in contrast with improving the diagnosis effects of fish allergen.
More than 95% of human allergic cases to fish were caused by the major food allergen parvalbumin (PV), which is a 12 kDa protein from various fish species and which is able to react with IgE antibodies (O’Neil et al. 1993). Several other potential allergens have also been reported (Nakamura et al. 2009), such as collagen (~100 kDa) in bigeye tuna (Hamada et al. 2001) and aldehyde phosphate dehydrogenase (APDH, ~41 kDa) in codfish (Das Dores et al. 2002a). The sizes of dif-ferent allergens vary according to immunoblotting experiments, such as 40 kDa in tropical sole (Asero et al. 1999), proteins of 25 kDa in swordfish, about 46 kDa in yellowfin tuna (Yamada et al. 1999), and 40 kDa in tuna. However, not all of the reported allergens have been well-characterised. So far, more than 15 allergens have been identified in the cod with molecular weights ranging between 15 and 200 kDa (Besler et al. 2000).
Now, most of the recent studies on the extraction techniques of protein are based on time, tempera-ture, pH, material to liquor ratio, and several other conditions with little study on the buffer. Hence, this research work is aimed to discover a buffer which can hold the concentration and activity of the protein after extraction process.
In order to accomplish this study, previous litera-ture sources were followed mainly related to different extraction buffers or recipes such as Coca’s solution, potassium chloride, phosphate buffered saline (PBS) which are currently used for extracting proteins (Liu et al. 2011). Based on our experience, extraction buffers highly affect the allergen yield and profile during the extraction process. Ideally, a standardised extraction procedure should yield consistent and reproducible amounts of all the major (and minor) allergens along with high biological activity. Reproducible extraction methods are also crucial in the case of extracts which are used for further diagnostic purposes. Such observations revealed that the minimum of allergens is lost and/or modified during the extraction procedures (Cong et al. 2007). In addition, there are many extraction buffers used for allergen research, on the contrary, the efficiency of extraction characteristics was seldom evaluated. When a certain amount of acid or alkali is added into the solution, the buffer can hinder the change of pH. Such a kind of suitable buffer plays an important role in the extraction process, which serves to achieve higher extract yield and high activity for possible allergen in tissues. Therefore, selecting a suitable buffer is very important for the allergen extraction.
In the present work, twelve kinds of extraction buffers were used for parvalbumin extraction from turbot fish. The present study aimed to discover an optimised buffer for extracting proteins (and allergens) from turbot – a fish which naturally contains a wide range of different allergic proteins, and to evaluate the allergenic activity of the extracts by immunoblotting and ELISA. Finally, preferring the prominent buffer by evaluating the yield and the activity of the allergen.
MATEriAl AnD METhODS
Extraction procedure. Live turbots ( scophthal-mus maxiscophthal-mus) were purchased from the local fish market. Fish were skinned, gutted, and rinsed briefly with double distilled water prior to the collection of tissue samples. From the same part of the tissue samples, around 300 g of collected muscle tissues were homogenised in ice-cold buffer and proteins were extracted using 12 different extraction buffer solutions separately (Table 1).
After the homogenising process, 12 extraction groups were put into a constant temperature shaker at 4°C. Then they were shaken and extracted at 130 rpm for 16 h followed by centrifugation at 4000 rpm for 30 min and the supernatant was collected. Later, the precipitate was extracted with the former buffer for 5 hours. After that, the extract was again centrifuged at 4000 rpm for 30 minutes. The supernatant was put together, and the dialysis was carried out using dou-ble distilled water for 24 hours. The doudou-ble distilled water was changed twice during the dialysis. Then the supernatant was kept for freezing and drying after the dialysis process. Finally, the protein powder was added into the freezer at –20°C for standby application.
Protein determination. The protein concentrations of all extracts were determined by the BCA protein assay using serial dilutions of bovine serum albumin (BSA) (Pierce, USA) as standards (Smith et al. 1985).
96-well ELISA plates were selected and labelled properly. The reagents were added according to the table shown (Table 2).
readings were recorded for all the samples. The BSA content was plotted on the X-axis and the absorption was on the Y-axis coordinate, and then the standard curve was plotted.
The standard curve was used as blank control and then the protein content of the sample was calculated according to the absorbance of the samples.
SDS-PAGE and immunoblotting. Reagents used for Western blotting included: PBS (0.01 M phosphate buffer, pH 7.4, 0.15 M NaCl, pH 7.4), PBS-Tween (PBST): (0.01 M phosphate buffer, pH 7.4, 0.15 M NaCl, pH 7.4, 0.05% Tween-20). SDS-PAGE pro-tein profiling was performed according to Laemmli (1970). 20 µl of the twelve extracts were mixed sepa-rately at a 4 : 1 ratio with loading buffer (2% SDS, 25% glycerol, 14.4 mM β-mercaptoethanol, and 0.1% bromophenol blue in 1 M Tris-HCl, pH 6.8) and boiled at 100°C for 7 minutes. Aliquots of 10 µl each were then loaded onto gel (15% for running gel and 5% for stacking gel) employing a vertical electro-phoresis system (BIO-RAD, USA) according to the
manufacturer’s protocol. Electrophoresis was carried out at 100 V for 2.5 hours. The gels were stained with Coomassie Brilliant Blue R-250 (Smith et al. 1988) and visualised and/or transferred to a Polyvi-nylidene Fluoride (PVDF) membrane (450 nm, USA) for Western blotting. Immunoblotting was carried out under a constant current of 0.8 mA per square cm of the membrane for 3 h, following Towbin and Gordon (1984) with slight modifications. Then, the membranes were stained with Ponceau S to confirm protein transfer followed by stuffing with 5% non-fat dry milk powder in PBST (pH 7.4) for 2 h at 37°C, followed by three washings of 5 min each with PBST. Blocked membranes were then incubated with pa-tients sera (at 1 : 20 dilution with blocking buffer) overnight at 4°C. Polyclonal goat anti-human IgE antibody (diluted 1 : 1000 in blocking buffer) was added after washing the membrane three times for 5 min each with PBST, and incubated for 1 h at room temperature. Finally, the membranes were washed three times for 5 min each in PBST. Resultant im-Table 1. Extraction buffers (solutions) evaluated in the present study
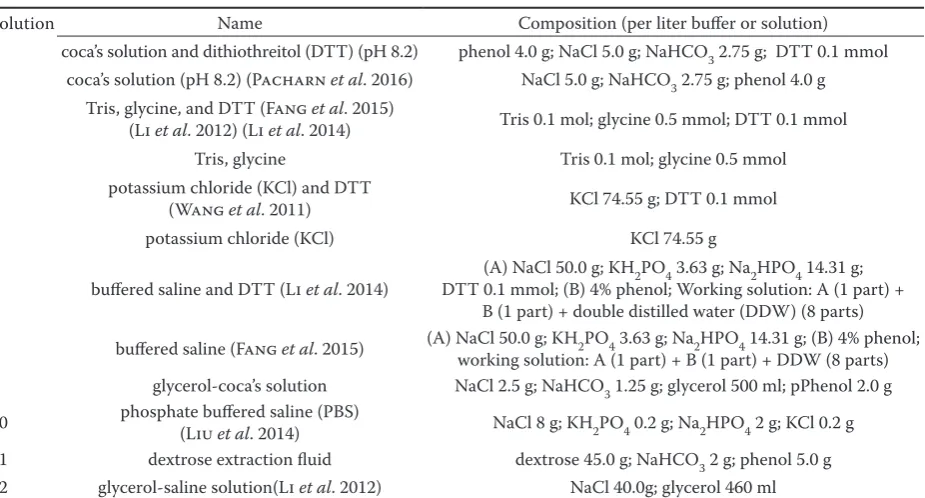
Solution Name Composition (per liter buffer or solution) 1 coca’s solution and dithiothreitol (DTT) (pH 8.2) phenol 4.0 g; NaCl 5.0 g; NaHCO3 2.75 g; DTT 0.1 mmol 2 coca’s solution (pH 8.2) (Pacharn et al. 2016) NaCl 5.0 g; NaHCO3 2.75 g; phenol 4.0 g 3 Tris, glycine, and DTT (Fang (Li et al. 2012) (Li et al. 2014)et al. 2015) Tris 0.1 mol; glycine 0.5 mmol; DTT 0.1 mmol 4 Tris, glycine Tris 0.1 mol; glycine 0.5 mmol 5 potassium chloride (KCl) and DTT (Wang et al. 2011) KCl 74.55 g; DTT 0.1 mmol 6 potassium chloride (KCl) KCl 74.55 g
7 buffered saline and DTT (Li et al. 2014) DTT 0.1 mmol; (B) 4% phenol; Working solution: A (1 part) + (A) NaCl 50.0 g; KH2PO4 3.63 g; Na2HPO4 14.31 g; B (1 part) + double distilled water (DDW) (8 parts) 8 buffered saline (Fang et al. 2015) (A) NaCl 50.0 g; KH2PO4 3.63 g; Na2HPO4 14.31 g; (B) 4% phenol;
[image:3.595.69.532.121.370.2]working solution: A (1 part) + B (1 part) + DDW (8 parts) 9 glycerol-coca’s solution NaCl 2.5 g; NaHCO3 1.25 g; glycerol 500 ml; pPhenol 2.0 g 10 phosphate buffered saline (PBS) (Liu et al. 2014) NaCl 8 g; KH2PO4 0.2 g; Na2HPO4 2 g; KCl 0.2 g 11 dextrose extraction fluid dextrose 45.0 g; NaHCO3 2 g; phenol 5.0 g 12 glycerol-saline solution(Li et al. 2012) NaCl 40.0g; glycerol 460 ml
Table 2. Standard curve for determining the total protein concentration
Number 1 2 3 4 5 6 7 8
BSA (µl) 0 1 2 4 8 12 16 20
DDT (µl) 20 19 18 16 12 8 4 0
[image:3.595.64.536.695.766.2]munoreactive bands were detected by enhanced chemiluminescence (ECL). Nonspecific binding of the anti-IgE antibody conjugate was measured in a similar blotting procedure, omitting the incubation step with patient sera.
Coomassie Blue stained gels and immunostained membranes were scanned using a Tanon-4200S Au-tomatic (Tanon, China) translation digital gel image analysis system and the generated files were analysed with Quantity One software (BIO-RAD, USA) using the low-range pre-stained SDS-PAGE protein mixture as standard. All reactions were performed in triplicate.
Indirect ELISA. Reagents used for indirect ELISA were: blocking buffer: 0.01 mol/l phosphate buffer (pH 7.4) containing 1% BSA (bovine serum albumin), and 0.15 mol/l NaCl; wash buffer: the same with PBST. HRP (horseradish peroxidase) conjugated goat anti-human IgE and goat anti-rabbit IgG were from Sigma (USA). Fish extracts (1 µg/ml) were immobi-lised on microtitre plates using 100 µl coating buffer (carbonate buffer, pH 9.6) and incubated overnight at 4°C followed by washing of the plates and block-ing the free bindblock-ing sites with blockblock-ing buffer at 37°C for 2 hours. Excess buffer was removed and the plates were rinsed thrice with washing buffer/PBST. Rabbit anti-PV antibodies (diluted 1 : 10 000 in PBS) were added to each well and incubated at 4°C for 1.5 hours. After another washing, 100 µl of goat anti-rabbit IgG (diluted 1 : 10 000 in PBS) was added to the wells and incubated at 37°C for 1 hour. Finally, the microtitre plates were rinsed with washing buffer fol-lowed by the addition of TMB (3,3',5,5'-tetramethyl- benzidine) as substrate. The plates were incubated in the dark for 20 min and the enzymatic reaction terminated by adding 50 µl/well of 2 M H2SO4. The plates were read by an ELISA reader at 450 nm. All reactions were performed in triplicate and the data was expressed as mean and standard deviation.
Statistical analysis. An analysis of variance (ANOVA) (SPSS 17.0) was applied to the assay. All data and the results were expressed as mean ± standard. Signifi-cant difference was defined at the level P < 0.05. The results are presented as means ± standard deviations of 3 independent experiments.
rESulTS AnD DiScuSSiOn
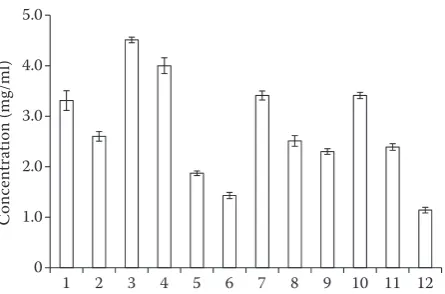
Total protein amount. Among the 12 protein extract solutions in total, solution 3 yielded the high-est protein with a mean concentration of 4. mg/ml,
while solution 12 resulted in the lowest concen-tration at 1.14 mg/ml (Figure 2). Interestingly, all extraction buffers containing Dithiothreitol (DTT) yielded higher proteins as compared to the respective original buffer recipes without DTT and the remain-ing buffers without DTT only with the exception of PBS. In addition, the protein content in the turbot fish which was extracted with Coca’s solution, Tris, Glycine, and KCl with DTT is higher than the pro-tein which is extracted from the turbot fish with the above-mentioned solutions without DTT, respec-tively higher than 27.24, 13.46, 30.83, and 36.14%. The content of the protein extracted with Tris and Glycine is the highest, which is 3.997 mg/ml, and the content of the protein extracted with buffered saline is the lowest, which is 1.14 mg/ml (Figure 2).
DTT is a kind of reducing agent which can be used to prevent the occurrence of the disulphide bond between cysteine and protein polymer, preventing its crystalline change from water-soluble into
non-y= 0.3586x+ 0.0266
R² = 0.9939
0 0.05 0.10 0.15 0.20 0.25
0 0.1 0.2 0.3 0.4 0.5 0.6
A
bs
or
ba
tio
n
[image:4.595.307.527.106.252.2]Concentration (mg/ml)
Figure 1. Standard curve for determining the total protein concentration
Figure 2. Concentration of total protein extracts obtained with twelve different protein extraction solutions (descrip-tion in Table 1)
0 1.0 2.0 3.0 4.0 5.0
1 2 3 4 5 6 7 8 9 10 11 12
[image:4.595.309.532.577.724.2]water–soluble. These results can explain the reasons why the protein concentration and specific protein extracted with the solution with DTT are higher than the concentration of another protein extracted with the solution without DTT. Moreover, DTT is routinely incorporated to prevent the oxidation of proteins which enhance the integrity and concentrations at higher levels. Overall, the results indicate that some of the proteins were lost or modified, which may be an artifact of the extraction buffers.
As for the above-mentioned 12 solutions, the ANOVA done by using SPSS software indicates that the content of protein which was extracted with Tris + Glycine + DTT shows a significant difference (P < 0.01).
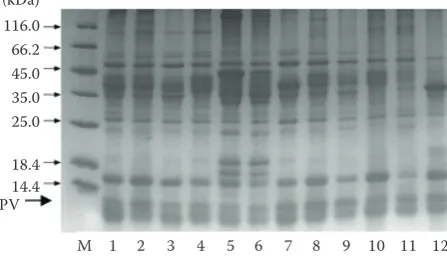
Immunoblotting with IgE and IgG. The protein con-tent of different extractions was changed to 1 mg/ml. SDS-PAGE profiling resulted in differential patterns of all 12 extracts (Figure 3) with 7 to 12 protein bands per row. Protein profiles from the extracts of solution KCl + DTT and DTT were well distributed despite lower protein concentrations. While Glycerol-saline solution produced the lowest number of bands and the lowest concentration of the protein observed was 1.14 mg/ml. The protein extracted with these solu-tions presents the main bands which are 10, 12, 26, 35, and 46 kDa. The remainder of the profiles exhibited almost similar banding patterns irrespective of their protein concentrations. The band obtained from the protein extracted with Tris, Glycine, and DTT is very significant and clear. It indicates that DTT did not destroy the protein composition. Similarly, when b-mercaptoethanol is added into the loading buffer during electrophoresis, its effect is almost the same as that of DTT, it can also prevent spherical protein into linear and disulphide bond cross-linking. So the compositions of these two groups of proteins are the same.
A key factor in allergen detection is the preparation of the protein extract from tissue samples to be tested. Previously, some studies have reported the comparison of different extraction methods (Céline et al. 2010) wherein the analysis of the extracts done by SDS-PAGE has revealed partial loss, degradation, or modification of different proteins during the extraction procedure. Therefore, such changes also likely apply to the fish al-lergens. The SDS-PAGE result indicates that in the range of 10 kDa to 13 kDa, all of the 12 solutions can extract protein and get two bands with different concentra-tions, corresponding to two different subtypes of PV. However, SDS-PAGE profiling of the proteins does not provide an idea about the activity of extracted proteins. To overcome this limitation, sera from subjects allergic to fish and anti-turbot PV antibodies were employed to detect the allergenicity of the extracted proteins. The electrophoretically separated proteins were tested for their allergenicity against three positive sera by Western blotting. The resulting immunoblots (Figure 4) support the protein banding patterns indicating that the extracts displayed different immune system inducers. Solution 1, 2, 3, 5, 7, 8, and 10 elicited higher immune reactiv-ity to all the three human sera and displayed positive IgE-reactivity to five protein bands at 16, 26, 36, 41, and 48 kDa, respectively. The remaining extracts lacked reactivity around 16 kDa. Faeste et al. (2008) reported a protein of about 16 kDa which was recognised on Western blot by the polyclonal anti-cod parvalbumin antibody in more than 20 fish species. Some explana-tions for the observation are conceivable, either this band represented another parvalbumin complex or it possibly cross-reacted with the anti-cod parvalbumin IgG. For serum A, the specific IgE showed a high bind-ing capacity with proteins with molecular weights of 16 kDa, 36, 41, and 48 kDa. Serum B showed positive IgE-binding at 16, 26, 36, 41, and 48 kDa. Serum C showed immune reactions with protein bands at 16, 26, 36, and 48 kDa.
Our analyses were focused primarily on the protein bands in the range of 11–13 kDa corresponding to PV and all 12 extracts displayed two protein bands between 11 and 13 kDa of varying intensities. In a similar observation, Gajewski et al. (2009) reported multiple PV bands representing different PV isotypes as different fish species are known to express from two to five PV isotypes (Van Do et al. 2003). However, the tests of all three human sera showed here a lack of reactivity to PV (absence of bands around 12 kDa) by immunoblotting. This observation implies that some other allergen(s) and not PV might be responsible for (kDa)
116.0 66.2 45.0 35.0 25.0
18.4 14.4 PV
[image:5.595.64.288.595.730.2]M 1 2 3 4 5 6 7 8 9 10 11 12
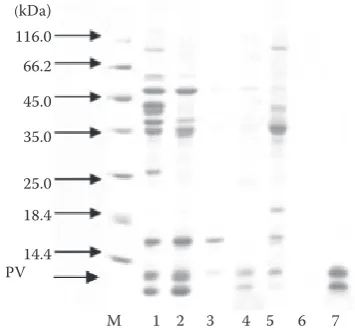
IgG immunoblotting was performed to further inves-tigate the anti-PV antibody binding specificity of the 12 extracts (Figure 5). Electrophoretically separated extracts blotted on the membranes were tested for their allergenicity with anti-turbot PV antibody, wherein the antibodies showed apparent reactivity to the allergens from different extracts. The 12 kDa protein was posi-tively identified in the extracts from solutions except solution 11 and solution 12. However, the anti-turbot PV antibodies showed positive reactions at 16 and 26 kDa, respectively. The reason for positive binding of anti-PV antibodies could be that the 26 kDa protein may be a dimeric form of turbot PV. In a similar ob-servation Das Dores et al. (2002a) reported a dimeric form of cod PV at 24 kDa. The polyclonal anti-turbot PV antibody showed reactivity to the widest range of fish proteins probably due to the recognition of mul-tiple epitopes based upon the polyclonal nature of the antisera. However, further investigations are needed to determine whether such oligomerisation has an influence on the allergenicity of PV.
[image:6.595.306.534.106.232.2]In this study, the proteins extracted with solution 3 (Tris + Glycine + DTT) elicited higher immune re-activity to all the three human sera and displayed positive IgE-reactivity to proteins at 16, 26, 36, 41, and 48 kDa, respectively. The positive bands ob-served at 26 kDa can infer that the 26 kDa protein is a dimer of parvalbumin. Das Dores et al. (2002b) considered the 24 and 36 kDa protein of cod as the dimeric and trimeric form of cod PV, respectively. Further efforts are required to confirm the exact cause of cross-reactivity of these protein bands and produce antibodies targeting specifically the proteins that are abundant in turbot. Otherwise, the rabbit anti-turbot parvalbumin can specifically bind with many kinds of protein bands, maybe because the antibody has different epitopes.
Figure 4. Western blotting of turbot extracts (description in Table 1) for their allergenicity to sera from three subjects allergic to fish (A, B, C); M – molecular weight marker
allergic reactions to fish in Qingdao cases. Thus, ac-counting for the racial differences in allergy studies assumes equal importance when studying response to fish allergens. Additionally, no reactivity to PV may also be due to the IgE titre in patient sera that is low and is not sufficient to detect PV in the extract. Comparing the IgE-binding capacity of the five major protein bands, the 41 kDa protein showed a stronger binding capacity than other allergens indicating that the 41 kDa allergen is known to be an important IgE-binding protein in turbot. The 41 kDa protein has often been reported in recent literature as a major fish allergen (Galland et al. 1998). However, further investigations are required for the precise identifica-tion of the allergen(s) involved.
Figure 5. IgG-immunoblot of the anti-turbot parvalbu-min antibody for different protein extracts (description in Table 1)
M 1 2 3 4 5 6 7 8 9 10 11 12 (kDa)
66.2 45.0 35.0 25.0
18.4 14.4
M 1 2 3 4 5 6 7 8 9 10 11 12
M 1 2 3 4 5 6 7 8 9 10 11 12 66.2
45.0 35.0 25.0 18.4 14.4
45.0 35.0 25.0
18.4 14.4
(A)
(B)
(c)
(kDa) 45.0 35.0
25.0
18.4 14.4 PV
[image:6.595.64.290.109.506.2]Indirect ELISA. The IgG reactivity potential of the 12 extracts was measured by indirect ELISA using specific IgG from rabbit antiserum against turbot PV (Figure 6). For the ELISA, the protein concentra-tions of all 12 extracts were maintained at 1µg/ml. The anti-turbot PV antibody showed differential reactivity to the 12 extracts. Solution 1 and 3 showed the highest reactivity to the anti-turbot PV antibody (IgG-binding ability); solution 6 and 12 showed the lowest reactivity. It can be due to the anti-oxidation of DTT, the effect can hold the activity of the protein. Varying degrees of reactivity may possibly be due to the differences in the plate-coating efficiency, protein quality, and the primary or conformational structure of the PV fractions obtained. ELISA results are in agreement with those of the Western blotting assays for the majority of the 12 extracts.
The OD values of the protein extracted with Coca’s solution + DTT, Tris + Glycine + DTT, and KCl +
DTT are higher than the OD values of the protein extracted with the solutions without DTT (13.79, 6.22, and 59.06%, respectively) but the OD value of the protein extracted with buffered saline and DTT is lower than the OD value of the protein extracted with buffered saline (0.12% shown in Figure 6). The highest OD value of the protein extracted with Coca’s solution and DTT is 1.79, followed by the OD value of the protein extracted with Tris, Glycine, and DTT, which is 1.58, and the lowest OD value of the protein extracted with Glycerol-saline solution obtained is 0.51.
The SPSS one-dimensional analysis indicates that the OD values of the protein extracted with Tris + Glycine + DTT show significant differences from the OD values of the protein extracted with the other solutions except Coca’s solution and Tris + Glycine (P < 0.01).
This study discovers and exposes the most suitable buffer for the protein extraction, and we hope that the buffer is also suitable for other kinds of fish. The study attempts to lay a foundation of fish allergen detection and development for commercial purposes.
The purification of PV. It represents the protein bands detected using SDS-PAGE, collected by am-monium sulphate (Figure 7). When the saturation of ammonium sulphate reached 90%, a single protein band was obtained, which was PV after the precipi-tation dissolved in PBS.
cOncluSiOn
In summarising, both immunoblotting and indirect ELISA consistently revealed that the anti-turbot PV antibody has varying specificity to proteins in extracts obtained by different extraction solutions, which can probably be attributed to differences in the PV content or activity of the extracts. Solu-tion 3 (Tris, Glycine, and DTT) proved to be the most efficient and simple buffer for extracting fish allergens, which is precisely suitable for detection and diagnosis. Moreover, the addition of DTT to buffer recipes improves the efficiency of the buff-ers and results in higher stability and functionality of the extracts.
reference
Asero R., Mistrello G., Roncarolo D., Casarini M., Falagiani P. (1999): True monosensitivity to a tropical sole. Allergy, 54: 1228–1229.
M 1 2 3 4 5 6 7
(kDa) 116.0 66.2
45.0 35.0
25.0 18.4
[image:7.595.66.289.103.254.2]14.4 PV
[image:7.595.80.258.562.727.2]Figure 7. SDS-PAGE profiling of turbot proteins (descrip-tion in Table 1) by ammonium sulphate precipita(descrip-tion; M – molecular weight marker
Figure 6. Indirect ELISA for parvalbumin in fish protein extracts (description in Table 1); each column and stand-ard deviation represent the mean OD values
0 0.5 1.0 1.5 2.0
1 2 3 4 5 6 7 8 9 10 11 12
OD
Besler M., Elsayed S., Helbling A. (2000): Allergen Data Co-llection-Update: Codfish [http://www.food-allergens.de]. Internet Symposium on Food Allergens, 2 (Suppl. 6): 1–18. Céline M.F.P., Chris H.B., Els A.D., Marc R.D.L., Didier G.E.,
Isabel V.T. (2010): Comparison and functional evaluation of the allergenicity of different hazelnut (Corylus avellana) protein extracts. Food Analytical Methods, 3: 382–388. Cong Y.J., Lou F., Xue W.T., Li L.F., Wang J., Zhang H. (2007):
The effect of cooking methods on the allergenicity of peanut. Food and Agricultural Immunology, 18: 53–65. Das Dores S., Chopin C., Villaume C., Fleurence J., Guéant
J.L. (2002a): IgE-binding and cross-reactivity of a new 41kDa allergen of codfish. Allergy, 57: 84–87.
Das Dores S., Chopin C., Villaume C., Fleurence J., Guéant J.L. (2002b): A new oligomeric parvalbumin allergen of Atlantic cod (Gad mI) encoded by a gene distinct from that of Gad cI. Allergy, 57: 79–83.
Faeste C.K., Plassen C. (2008): Quantitative sandwich ELISA for the determination of fish in foods. Journal of Immu-nological Methods, 329: 45–55.
Fang Y., Long C., Bai X., Liu W., Rong M., Lai R. (2015): Two new types of allergens from the cockroach, Periplaneta americana. Allergy, 70: 1674–1678.
Gajewski K.G., Hsieh Y.H. (2009): Monoclonal antibody specific to a major fish allergen: parvalbumin. Journal of Food Protection, 72: 818–825.
Galland A.V., Dory D., Pons L., Chopin C., Rabesona H., Gu-eant J.L., Fleurence J. (1998): Purification of a 41 kDa cod--allergenic protein. Molecular Immunology, 43: 1451–1461. Hamada Y., Nagashima Y., Shiomi K. (2001): Identification of collagen as a new fish allergen. Bioscience Biotechnology and Biochemical, 65: 285–291.
Laemmli U.K. (1970): Cleavage of structural proteins during the assembly of the head of Bacteriophage T4. Nature, 227: 680–685.
Li T., Li J., Hu W., Chen J., Li H. (2014): Protein changes in post mortem, large yellow croaker (Pseudosciaena crocea) monitored by sds-page and proteome analysis. Food Control, 41: 49–55.
Li X., Moellering E.R., Liu B., Johnny C., Fedewa M., Sears B.B., Kuo M.H., Benning C. (2012): A galactoglycerolipid lipase is required for triacylglycerol accumulation and survival following nitrogen deprivation in Chlamydomonas reinhardtii. Plant Cell, 24: 4670–4686.
Liu Y.X., Lin H., Wu L.S., Chen Y., Wang G.Y., Li Z.X. (2011): Study on effects of different processings on immunoge-nicity of shrimp (Metapena eusensis) allergen. Journal of Fisheries of China, 35: 948–953.
Liu Y.Y., Cao M.J., Zhang M.L., Hu J.W., Zhang Y.X., Zhang L.J. (2014): Purification, characterization and
immunore-activity of β'-component, a major allergen from the roe of large yellow croaker (Pseudosciaena crocea). Food and Chemical Toxicology, 72: 111–121.
Nakamura R., Satoh R., Nakajima Y., Kawasaki N., Yamaguchi T., Sawada J., Nagoya H., Teshima R. (2009): Comparative study of GH-transgenic and non-transgenic amago sal-mon (Oncorhynchus masou ishikawae) allergenicity and proteomic analysis of amago salmon allergens. Regulatory Toxicology and Pharmacology, 55: 300–308.
O’Neil C., Helbling A.A., Lehrer S.B. (1993): Allergic reac-tions to fish. Clinical Reviews in Allergy and Immunology, 11: 183–200.
Pacharn P., Kumjim S., Tattiyapong P., Jirapongsananuruk O., Piboonpocanun S. (2016): Identification of wheat sensitization using an in-house wheat extract in coca-10% alcohol solution in children with wheat anaphylaxis. Asian Pacific Journal of Allergy and Immunology: 34, 153–158. Pascual C.Y., Reche M., Fiandor A., Valbuena T., Cuevas T.,
Esteban M.M. (2008): Fish allergy in childhood. Pediatric Allergy and Immunology, 19: 573–579.
Sampson H.A. (2004): Update on food allergy. Journal of Allergy and Clinical Immunology, 113: 805–819. Smith I., Cromie R., Stainsby K. (1988): Seeing gel wells
well. Analytical Biochemistry, 169: 370–371.
Smith P.K., Krohn R.I., Hermanson G.T., Mallia A.K., Gartner F.H., Provenzano M.D., Fujimoto E.K., Olson B.J., Klenk D.C. (1985): Measurement of proteins using bicinchoninic acid. Analytical Biochemistry, 150: 76–85.
Towbin H., Gordon J. (1984): Immunoblotting and dot immunobinding: current status and outlook. Journal of Immunological Methods, 72: 313–340.
Van Do T., Hordvik I., Endresen C., Elsayed S. (2003): The major allergen (parvalbumin) of codfish is encoded by at least two isotypic genes: cDNA cloning, expression and antibody binding of the recombinant allergens. Molecular Immunology, 39: 595–602.
Wang B.P., Li Z.X., Zheng L.N., Liu Y.X., Lin H. (2011): Identification and characterization of a new ige-binding protein in mackerel (scomber japonicus) by maldi-tof-ms. Journal of Ocean University of China, 10: 93–98. Wu Q.W., Cai P.C., Chen Z.Z., Wu X.H., Kong L.L., Hu L.H.
(2009): Analysis of specific allergens IgE in bronchial asthma children in Wuhan district. Journal of Hematology and Oncology, 22: 65–67.
Yamada S., Nolte H., Zychlinsky E. (1999): Identification and characterization of allergens in two species of tuna fish. Annals of Allergy, Asthma and Immunology, 82: 395–400.