Briefly, the biotech industry refers to a sector that utilizes the ‘organism’ and its related technologies to create the economic worth.1 Since the first biotech enterprise in the United States took the initiative 1973 to formally proclaim the commercialization of the biotech products, the countries worldwide began to awaken to its prospects for development and impor-tance, and successively devoted resources to cultivate this sector. To date, the biotech has been widely ap-plied to diversified domains (medicine, agriculture, food, manufacturing, energy, and environmental protection), and imperceptibly, unobtrusively, and deeply altered and influenced of the lives of people everywhere (health care, food safety, and economic growth). Generally, the biotech industry is recognized as with the characteristics that include its lengthy product development period, a huge and continuous financial consumption, a high innovation uncertainty, a high technological intensity and the entry threshold, the research and development orientation, involving morality controversy, the freedom from economic cycles, etc. Particularly due to the first three
char-acteristics, the requirements from the aspects of the operational efficiency and the productivity change for the biotech business are essential. The academia should provide a review or a new paradigm as a theme for the biotech development.
In the recent years, the global biotech industry can still sustain a position of the continuous expansion. According to an investigation by the Ernst and Young Co., whether in sales, the R&D expenditure, employ-ment, or the number of firms in the industry, most of the listed biotech enterprises in the world revealed the trend of a positive growth between 2005 and 2007. In 2008, the global sales for pharmaceuticals had already reached 773 billion USD; the value of medical instruments attained 286 billion USD; while the market scale for transgenics reached 7.5 billion USD. Despite the unavoidable impact of the ‘2008 financial tsunami’ on various sectors2, the impact on the biotech industry was relatively limited. The total sales of the listed biotech enterprises in 2008 still showed a continuous growth of 5.7% (89.6 billion USD), and the number of initiatives also increased
Cross-country analysis of efficiency and productivity in
the biotech industry: an application of the generalized
metafrontier Malmquist productivity index
Yung-Hsiang LU
1, Ku-Hsieh CHEN
2, Chun-Cheng WU
11National Chiayi University, Chiayi, Taiwan
2Fo Guang University, Yilan, Taiwan
Abstract: Th e study investigates the productivity of 356 Biotech enterprises spanning 12 countries worldwide from 2001 to
2007 with a newly developed generalized metafrontier Malmquist productivity index (gMMPI) framework. Th e results su-ggested that the X ineffi ciency is prevalent in the current developmental phase of the Biotech worldwide, while the levels of technology vary substantially across enterprises and geographical regions. Moreover, the gMMPI decomposition manifests that the productivity growth in the Biotech is mainly driven by the effi ciency change, with an annual rate 20.64%. Meanwhi-le, the existing technologies continuously try to catch up with the grand technology, and the potential room for a further technological progress has also been advanced.
Key words: effi ciency, Malmquist index, productivity index
1According to the UN Convention on Biological Diversity, biotechnology is defined as various production and process technologies that utilize organismic systems, living things, or their derivatives for specific purposes.
from 303 to 4717 (Industrial Development Bureau 2009). These have sufficiently described the potential and trend for development.
Though the prospects of the industry are outstand-ing, numerous countries and enterprises usually face the challenges of its high financial consumption and high uncertainty when launching energy and resources to develop the industry. Currently, not many countries have biotech industries that can possess a certain extent of the operating scale to generate technological advantage; the countries with these capabilities are limited to the United States, Canada, the United Kingdom, Germany, and Japan. We can examine differences in the technological advancement by the region to which the countries belong. Biotechnology firms in the United States are still leaders in the global biotechnology indus-try; in 2008, the listed biotechnology firms in the United States had accumulated sales of US$ 66.1 billion, which showed a slight growth in sales from 2007, and the R&D expenditure was maintained at approximately US$ 25.3 billion. In 2008, the North American region was the only region in which the biotechnology industry made profits as a whole; and within this region, the biotechnology industry in the United States still outperformed that of Canada. The number of biotechnology firms in Canada is only second to the United States, and Canada also attains good achievements in the categories of the pharmaceuticals and agricultural biotechnology.
The European region is the fastest growing region in the terms of biotechnology. In 2008, the biotech-nology firms in the region had accumulated sales of US$ 16.5 billion; which grew by US$ 3.6 billion from 2007. The net loss of the listed biotechnolo-gies firms reduced to US$ 0.7 billion; this reduc-tion in lost profits was due to a number of factors, including a rising exchange rate of the Euro, and an impressive product sales performance. These posi-tive effects also contributed toward the growth in the R&D expenditure, the number of staff, and the number of firms. Many countries in the European region are competing for the market share, includ-ing the United Kinclud-ingdom, Germany, and France. The United Kingdom is the country of origin for the modern biotechnology; Germany is a leading player in biopharmaceuticals; France is actively trying to establish bio-clusters and to develop a unique offering whereby its private firms provide research services; and the biotechnology industries in Denmark and Sweden have also been developing at a rapid rate,
thanks to the Medicon Valley in the grand Øresund economic region.
The listed biotechnology firms in the Asia-Pacific region are the smallest in scale, with the total sales in 2008 of approximately 5 billion US$; the R&D ex-penditures of these firms continued to increase, and their net profits increased by US$ 14 million. Japan is the leading country within the Asia-Pacific region, particularly in the terms of the fermentation technol-ogy and medical skills. Nevertheless, other countries in this region, including South Korea, Taiwan, China, Singapore, Australia, and New Zealand, are all the rising stars in the biotechnology industry, and are all striving to level with the more technologically advanced countries (2008 White Book 2009).
The analytical methods most commonly employed to measure the operational efficiencies include the Data Envelopment Analysis (DEA) and the Stochastic Frontier Approach (SFA). The main advantage of us-ing the DEA is that predeterminus-ing the estimation functions is not necessary; but at the same time, the results are easily affected by the extreme values (Coelli et al. 2005). Conversely, the SFA is a type of the parameter estimation; the disadvantage of us-ing this method is that the functions in the model need to be predetermined, but its advantage lies in that the model considers both the effects of the efficiency terms and random error. With regard to the application of the DEA (González and Gascón 2004) or the SFA (Chiu et al. 2003) to measure the firm performance in the biotechnology industry, all past studies made the assumption that all firms’ technical standards of production were equal. The current trend of development in the biotechnology industry means that we are seeing still more shifts in the production technologies and the staff turnover across different countries and regions, but the state of the economic development, skills and technologies, and the development process in different regions still display large disparities; therefore, there are greater differences between the technical standards of production across different regions.
classical functions. Boskin and Lau (1992) proposed a different method for setting the function; Sharma and Leung (2000) adopted the model proposed by Battese and Coelli (1995), and used it with the SFA to measure the productivity of carp industries in the Southeast Asian countries. Using a stochastic metafrontier model, Battese and Rao (2002) proposed the viewpoint that technical efficiencies in different groups can be compared against each other. Battese et al.(2004) later readjusted the metafrontier model proposed by Battese and Rao (2002), and defined this model as an enveloping metafrontier derived from the stochastic frontier production function of different technical groups that envelops the determined parts of the stochastic frontiers of all groups.
The metafrontier model is repeatedly mentioned and utilized in many studies, particularly in the re-search related to finance (Bos and Schmiedel 2007; Huang, Chang and Chiu 2009; Yen, Chang and Woo 2008). In the terms of studies related to agriculture, many continents such as Africa (Ayinde, Adewumi and Ojehomon 2009; Binam, Gockowski and Nkamleu 2008), Asia (Boshrabadi, Villano and Fleming 2008; Chen, Huang and Yang 2009; Chen and Song 2008), Australia (Villano, Fleming and Fleming 2008), and many countries on other continents (O’Donnell, Battese and Rao 2008) have conducted the relevant research and produced literature on the metafrontier models. Apart from the application in the industries mentioned previously, the metafrontier is also widely applied in other industries.
Based on the metafrontier concept originally pro-posed by Battese et al. (2004), Rao (2006) propro-posed the Metafrontier Malmquist Productivity Index (MMPI). Chen and Yang (2008) and Chen et al. (2009) then made further improvements on the MMPI; the improved model now considers the scale efficiency, and thus became what is known as the generalized Metafrontier Malmquist Productivity Index (gMMPI). Besides working out the technical change and the technical efficiency change, the decomposition of the gMMPI function can further provide details on the technology gap variables. By identifying how the production technologies are catching up with the potential technologies, the information can give rise to a further economic analysis and implications.
To identif y and understand the changes to the technical efficiency and productivity, this paper will present a study conducted on twelve countries (Australia, China, Japan, South Korea, Taiwan,
the United Kingdom, Germany, Denmark, France, Sweden, the United States, and Canada) categorized into three geographical regions (the Asia-Pacific re-gion, the European rere-gion, and the North American region). The study gathered data on these countries’ productivities between the years 2001 and 2007, and then conducted a cross-regional comparative study.
METHODOLOGY
The metafrontier model
According to the model developed in Battese et al. (2004), let us assume that there are a total N firms belonging to K technological groups in an industry. Then, there are Nk firms in the group k. We know that the metafrontier function that the K groups commonly face can be presented as:
it
K x
it it k
k
Y f x e i N N t T
{ Ά
¦
1
( ,Ά ) , 1, 2,..., , 1, 2,..., (1)
Here, β* refers to the estimated parameter vector of the metafrontier production function, and can be estimated under the following constraint condition:
xijβ* ≥ xiβ(k) (2)
The kth group on the stochastic frontier is defined as the output of ith firm at time t, or expressed as the following the metafrontier equation:
ܻ௧ൌ ݁Ȃሺೖሻൈ݁
௫ஒሺೖሻ
݁௫ஒכ ൈ ݁
௫ஒכାሺೖሻ (3)
In Equation (3), the second term on the right-hand side is the technology gap ratio (TGR), which is the ratio of each firm’s stochastic frontier value to the metafrontier value:
it k it
x
it x
e TGR
e
( )
*
Ά
Ά (4)
When TGR is between the values of 0 and 1, the closer it is to 1, the smaller the gap between the metafrontier and the group’s stochastic frontier. The more similar a particular firm’s stochastic frontier value is to the metafrontier, the more highly the firm’s technical standard is regarded, and it will therefore demonstrate a higher TGR value. This can be expressed as the following equation:
*
it it it
The gMMPI model
An illustration of the concepts and models proposed by Chen and Yang (2008) and Chen et al.(2009) is provided below. Here, the structure of the MMPI model is explained using a distance function. First, we define the production technologies as the process of transforming inputs into outputs; a firm’s produc-tion (t = 1, 2, …, T) is produced with the input vec-tor xt Î R+M in period t and with the output vector
yt Î R+L. Assuming that K technological groups exist in total (k = 1, 2, …, K), and given an appropriate combination of inputs and outputs, the technologi-cal group k
t
P x in the same output orientation can be derived as follows:
k k k
t t t
P x y is obtainable from x (6)
The upper bound of the technological groups is the group frontier (O’Donnell et al. 2008), which defines the output oriented distance function of kth group (Shephard 1970):
kk k k t k k
t t t t t
y
D x y °® ! §¨ ·¸P x ½°¾
° © ¹ °
¯ ¿
Έ
, inf Έ 0 :
Έ (7)
An equation proposed by Caves et al. (1982) is used here to explain the change in the intertemporal productivity of the Malmquist Productivity Index (MPI) – Equation (8).
In Equation (8), the first term on the right of the equal sign is the technical efficiency change (TEC), and the second term is the technical change (TC). The equation derives a geometric mean through
the consideration of the output com binations of period t and period t+1. O’Donnell et al.(2008) called the measure of the group frontier in Equation (8) the Group Malmquist Productivity Index (GMPI), and this equation can be simplified and expressed (Equation 9).
According to Battese et al.(2004) and O’Donnell et al.(2008), assuming that the individual technological groups all with the same technologies are not restricted by the output P*(x), the following equations can be derived (Equations 1a and 11).
The metafrontier is different from the group frontier in that it implies that the obstacles to the technology development can be overcome, and the technical gaps can be closed; therefore, the output oriented distance function can be expressed – Equation (12).
The MPI(MMPI), which Rao (2006) and O’Donnell et al.(2008) defined based on the metafrontier con-cept, is expressed – Equation (13).
This can be simplified and expressed – Equation (14). The above TEC* and TC* are the bases for measuring the technical efficiency change (TEC) and technical change (TC) using the metafrontier.
The MMPI distance function encompasses two elements: TEC* and TC*. However, Chen and Yang (2008) argue that the traditional measuring method MPI ignores the scale efficiency change (SEC), and this is also a likely weakness of the MMPI model; however, the gMMPI model considers the SEC, and includes the intertemporal adjustment of scale ef-ficiency in the MMPI model.
If we assume that the firm technology can be ex-pressed as the input vector xt R+M, the output
1 2
1 1 1 1 1
, 1 1 1
1 1 1 1
, , ,
, , ,
, , ,
k k k
t t t t t t t t t
k
t t t t t t k k k
t t t t t t t t t
D x y D x y D x y
MPI x y x y
D x y D x y D x y
(8)
, 1 , 1 , 1
k k
t t t t t t
GMPI TEC TC (9)
1 2 k
t t t t
P P P P (10)
*
t t t t
P x y is potentially obtainable from x (11)
tt t t t t
y
D x y § · P x ½
!
® ¨ ¸ ¾
© ¹
¯ ¿
Έ
, inf Έ 0 :
Έ (12)
1
* * * 2
1 1 1 1 1
, 1 1 1 * * *
1 1 1 1
, , ,
, , ,
, , ,
t t t t t t t t t
k
t t t t t t
t t t t t t t t t
D x y D x y D x y
MMPI x y x y
D x y D x y D x y
(13)
* *
, 1 , 1 , 1
t t t t t t
1
1
1 1 1
ln , m , ln , m,
t t t t t t
D y x t D y x t 1 1
1 1
1
ln , , ln , , 1
ln ln
2 ln ln
l m l m
L t t t t t t l l
t t
l l
l
D y x t D y x t
y y y y
1 1
1 1
1
ln , , ln , , 1
ln ln
2 ln ln
l m l m
M t t t t t t m m
t t
m m
m
D y x t D y x t
x x x x
1 ln 12 t D
1, 1,
ln
, ,
l m l m
t t t t t
y x t D y x t
t t
(15)
1 1
, 1 1 1
ln , , m , m
t t t t t t
MMPI y y x x
1 1 1
1 1
ln , , ln , , 1
ln ln
2 ln ln
l m l m
L t t t t t t l l
t t
l l
l
D y x t D y x t
y y y y
1 1
1 1
1
ln , , ln , ,1
ln ln
2 ln ln
l m l m
M t t t t t t m m
t t
m m
m
D y x t D y x t
x x x x
(16)
1 1
1
1
, 1 1 1 1 1 1
ln , , m , m ln , m , ln , m,
t t t t t t t t t t t t
MMPI y y x x D y x t D y x t 1
1 1
ln , , ln , , 1
2
l m l m
t t t t t t
D y x t D y x t
t t
(17)
1 1
, 1 1 1
ln , , m , m
t t t t t t
gMMPI y y x x 1 1
1 1
1
ln , , ln , , 1
ln ln
2 ln ln
l m l m
L t t t t t t l l
t t
l l
l
D y x t D y x t
y y y y
1 1 1
1 1 1
1
ln , , ln , ,
1 ln ln
2 ln , , ln ln
l m l m
t t t t t t
m m
l m
M t t t t
m m
D y x t D y x t
x x
D y x t D y
x
1
1
1
ln ln , ,
ln
M m m
t t
l m
m
M t t
m m x x x t x
(18)
1 1
, 1 1 1
ln , , m , m
t t t t t t
gMMPI y y x x ln 1
11, 1,
ln
1, ,
m m
t t t t t t
D y x t D y x t
12 ln 1
1, 1,
ln
, ,
l m l m
t t t t t t
D y x t D y x t
t t
+
1 1
1
1
1 1 1 1 1 1 1 ln 2m m m m
m m
M M
t t t t
m m m
t M M t t m m x
1 ln M m tm x
1 1
1 1
ln , , ln , ,
, ;
ln ln
m m
l m l m
t t t t t t
t m t m
D y x t D y x t
where x x
(19)
vector yt R+L, and the time variable t using an output distance function, by applying the Diewert’s (1976) Quadratic Identity Lemma, the intertemporal changes of the distance function can be measured by Equation(15).
The flexibly weighted output distance becomes the change in output. We compared this with the flexibly weighted input distance (input change), and took the natural logarithm to derive the expression (16).
From Equations (15) and (16), we can derive the Equations (17).
Orea (2002) reckons that a number of characteristics are necessary in the construction of a comprehensive index of the total factor productivity; these character-istics include the identity, monotonicity, separability, and proportionality. Equation (16) possesses the first of these three characteristics. Proportionality implies a linear first-order condition of the productivity index,
but proportionality may not be presented in the MPI model; and in the VRS, the weighting of input vari-ables may not be one. In the light of this, we adopted the concepts proposed by Orea (2002) and Denny et al. (1981), and replaced the distance elasticity inputs with the distance elasticity shares as the weighting for the input variables. This process can be expressed as Equations (18).
Here, the gMMPI is the general expression of the MMPI; using Equations (15) and (18), the gMMPI can be constructed and expressed as Equations (19).
firm’s adjustment of its input-output levels across different periods will then affect its productivity growth. This means that when production is at the IRS/DRS stage and a firm increases or decreases its scale of input, then its SEC* value will respectively be larger or smaller than 1. The indexed equation can be simplified and expressed as Equation (20).:
The above equation can be illustrated as Equa-tion (21).
The first two terms on the right of the equals sign are TECk and TCk respectively, which is the group frontier; the third term is the logarithm taken from the intertemporal TGR change. If the ratio is larger than 1, it means that the firm’s technology gap di-minishes with time, and that the technology catch-up exists. This demonstrates that the currently available technology and technical standards are not a result of the technological catch-up, and this is referred to as pure technological catch-up (PTCU). The fourth term on the right of the equals sign is the ratio of TC* to
TCk, or the measured rate of the potential improve-ment in technical standards, based on the change in the current technical standards in production. When the estimated value exceeds 1, it means that the rate of the potential improvement in technical standards outperforms the existing technical standards; thus, the firm’s potential in improving and developing its technical standard is increasing. This is referred to as the potential technological relative change (PTRC). The indexed equation can be simplified and expressed as Equation (22).
EXPLANATION OF VARIABLES AND THE EMPIRICAL MODELS
Explanation of variables
We collected data using the OSIRIS databank and adopted the Industry Classification Benchmark ICB for the classification of the biotechnology sample sub-jects.3 The main purpose of this study is to compare the biotechnology industries in different countries. After filtering out any incomplete company data from the sample set, the final sample consisted of firms from twelve countries including Australia, China, Japan, South Korea, Taiwan, the United Kingdom, Germany, Denmark, France, Sweden, the United States, and Canada. We then categorized these countries and segmented them into continental regions according to their geographic positions (Rao 2006; O’Donnell et al. 2008; Krishnasamy and Ahmed 2009; Oh and Lee 2010). As in the study conducted by O’Donnell et al. (2008), we also placed Australia in the Asia-Pacific region; our study on the industry productivity change was conducted on countries in three continental regions, including the North American region, the European region, and the Asia-Pacific region.
The sample for this study included a total of 356 firms from the three continental regions, and the analysis was conducted on data from the 2001 to 2007 period. The 356 firms included 55 firms in the Asia-Pacific region (Australia, China, Japan, South Korea, and Taiwan); 68 firms in the European region
* * *
, 1 , 1 , 1 , 1
t t t t t t t t
gMMPI TEC TC SEC (20)
m mt t t t t t
gMMPI y y x x
1 1 , 1 1 1
ln , , , k
m k mt t t t t t
D y x t D y x t
ª º
¬ln 1 11, 1, ln 1, , ¼
k l m k l m
t t t t t t
D y x t D y x t
t t
ªw w º
« »
w w
« »
¬ ¼
1 1 1
ln , , ln , ,
1
2
k
l m k l mt t t t t t
TGR y x t TGR y x t
ª º
¬ln 1 1, 1, ln , , ¼
l mt t t t
D y x t D
t w w w
1 1 1
ln , , ln
1 2
l m t tk l m k l m
t t t t t t
y x t t
D y x t D y x t
t t
ª § ·
« ¨
¨ w
« © ¹
«
§w w ·
Ǭ
Ǭ w w
© ¹
¬
1 1 1
, ,
ln , , ln , ,
m m m m
m m
M M
t t t t
M m m m m
t t M M m t t m m x x
ª º
« » u « » ¬ ¼
¦
¦
¦
¦
¦
1 1 1 1 1 1 1 1 1Β 1Β Β 1Β
1
ln ln
2 Β Β (21)
*
, 1 , 1 , 1 , 1 , 1 , 1
k k k k
t t t t t t t t t t t t
gMMPI TEC TC PTCU PTRC SEC (22)
(the United Kingdom, Germany, Denmark, France, and Sweden); and 233 firms in the North American region (the United States and Canada). In addition, when using US$ million as the unit for measuring the input, output, and other variables, we adopted the 2000 Producer Price Index (PPI) in the United States as the basis for deflation.
Definition of variables
The definitions offered for the output and input variables are provided as follows. The output variables include net sales (González and Gascón 2004; Saranga 2007; Li and Li 2008), which is the item under net sales in a company’s income statement. The input variables include fixed assets, staff, and the R&D expenditures. First, fixed assets are the assets listed in a company’s income statement that encompass the machinery and equipment, plant, land, and other hardware; fixed as-sets are the basis for a firm to produce its products. Second, staff is the number of staff employed by a firm on an annual basis. Together, fixed assets and staff are the fundamentals of the production theory (Chiu et al. 2003; González and Gascón 2004; Saranga 2007; Li and Li 2008). Finally, the last input variable is the R&D expenditure. Because the nature of the biotechnology industry technology-and knowledge-intensive, the R&D expenditure is a critical element to the industry, and the studies have proven the benefits that the R&D spending provide to the industry (Chiu et al. 2003; Hsieh et al. 2007; Hashimoto and Haneda 2008; Li and Li 2008).
However, if the R&D expenditure is used as an input variable, then only the expenditure of a particular year is used as the input variable for that year, so this figure does not help to provide a precise measurement of the investment efficiency. The R&D expenditure has a time-lag effect, and this must be considered in the analysis; therefore, this study used the R&D capital stock to estimate investment efficiency. The R&D capital stock can also measure the contribution of innovative efforts to productivity. According to Yang and Chen (2002), the majority of the past studies estimated investment efficiency using an equation which weighted the R&D expenditure of the year and the R&D expenditure of the previous years, and this equation is expressed as Equation (23).
R represents the R&D expenditure, δ is the deprecia-tion rate, and g denotes the growth rate of the R&D expenditure. There is no standard depreciation rate, and rates adopted in past studies have included 7.5% (Chen et al. 2009), 12% (Luh and Shih 2005) and 15% (Chuang and Hsu 1999; Griliches and Mairesse 1984; Yang and Chen 2002). Griliches and Mairesse (1984) indicated that different depreciation rates actually have a little impact on the results of estimation; we therefore adopted the most commonly used depre-ciation rate of 15% for this study. For the estimation of the R&D capital stock, we adopted the method used by Yang and Chen (2002), whereby we used the data from the previous two years for the estimation.
Furthermore, because this study focuses on evalu-ating biotechnology firms in different countries, the internal and external environmental factors must be excluded to achieve the same basis of comparison for measuring the performance of different firms. In the light of this, we categorized environmental variables into three characteristic levels: the country-characteristic, the industry-country-characteristic, and the firm-characteristic variables. In doing so, we can exclude the impact on efficiency and productivity created by the internal and external environmental factors, as experienced by the companies, indus-tries, and nations. For the firm-characteristic and industry-characteristic variables, we adopted the same variables as adopted by Yang and Chen (2009), which included the firm age (FA), the R&D intensity (RDI), the industry scale (IS), the ratio of the number of labourers employed by the first 50% of firms in the group to the average number of labourers employed by all firms (IMES), and the average industry R&D intensity (IRDI). The FA represents how long a firm has been operating, and this may affect its technical efficiency; younger firms may be more efficient than the more established firms, and vice versa. The RDI refers to the technical capabilities and skills possessed by a firm, which are the main factors in improving the firm’s technical efficiency. The IS and IMES are similar in that their scales can affect the firm’s ef-ficiency, so larger firms may be more efficient than the smaller ones. Depending on the overall level of the R&D investment in the industry, the IRDI may affect the ability of new firms to enter into the mar-ket, or it may affect the technical efficiency of the existing firms if they do not face new competition
t
t t
t t t t t t t t
R
K R R R R R
g g ª º
} « »
¬ ¼
¦
¦
2
Ȭ1 Ȭ2
1Ȭ Έ
1Ȭ Έ 1Ȭ Έ 1Ȭ Έ
(Yang and Chen 2009). The country-characteristic variables are dependent on the country’s economic level and its population; because the income levels and consumption both affect a firm’s output levels and the cost control, we therefore used the gross domestic product (GDP) and the population density (POP) as the variables in this category.
Empirical models
The group frontier in this study was obtained using the SFA model to set the translog function. Chiu et al. (2003) reported the advantage of the flexibility of the function; the more flexible it is, the closer it is to the true function, regardless of the functional form. Tsai and Wann (1995) also mentioned that the Cobb-Douglas and CES functions focus only on simplicity, and overlook the fact that they do not of-fer the elasticity of substitution. The majority of the past studies (Chiu et al. 2003; Li and Li 2008) adopted translog function for analysis; therefore, we also used the translog function as it is expressed Equation (22).
In this function, g represents each group frontier;
i is the fi rm code; T is the time trend; Y denotes the output variables, L, K, and R are the number of staff , fi xed assets, and the R&D capital stock, respectively; a and β are the parameter estimates; Vit represents the stochastic variables that are independent and identi-cally distributed ܰሺͲǡ ɐ௩ଶሻ; and U
it = {U exp[–η(t – T)]}. According to Battese and Coelli (1992), Uitand Vit are non-negative random variables that are independent and identically distributed in the terms of technical efficiency; and η denotes the adjusted intertemporal variables.
Battese and Coelli (1995) suggested that the vari-able (Uit), which affects technical inefficiency, can be expressed as a linear function to reflect the charac-teristics of a country; this can further demonstrate
different effects created by resources, social factors, and technology on each firm or country. Uit is a non-negative random variable, and follows the normal distribution, as demonstrated Equation (25).
The FA is the firm age (FA), the RDI is a firm’s R&D intensity, the IS denotes the industry scale, the IMES is the ratio of the number of labourers employed by the first 50% of firms in the group to the average number of labourers employed by all firms, the IRDI denotes the average industry R&D intensity, GDP is the gross domestic product of a nation, and the POP represents the population density.
Battese et al.(2004) used the absolute minimal distance and the squared minimal distance to calcu-late β in Equation (22). By setting a stochastic group frontier parameter of Ⱦሺሻ, k = 1. 2. …, R, the
param-eter β* was estimated; this method is also called the linear programming (LP), whereby the parameters of the individual technical groups (Ⱦሺሻ) are induced to
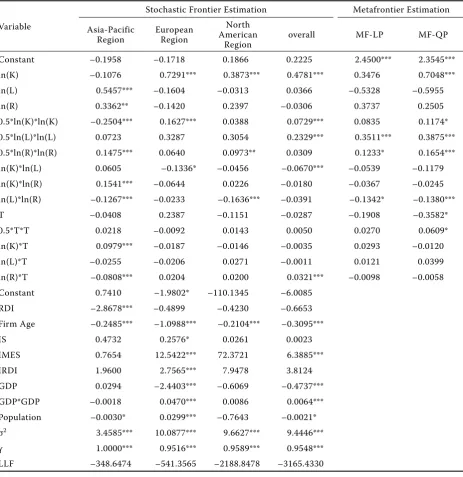
work out the optimal solution. Another method using the squared minimal distance and for the estimation of parameter β* is also referred to as the quadratic programming (QP)4; Table 1 shows the results of the stochastic parameter estimation results.
ANALYSIS OF EMPIRICAL RESULTS
Results of parameter estimation
Table 1 shows the results of the stochastic frontier parameter estimation. In this estimation, the ln(K) values are generally positive, indicating that the firm capital inputs had a positive effect on the output. The cross-product term of the R&D input and time is a positive value, indicating the positive contribution that the R&D expenditure made toward increases in the output year over year. In the Asia-Pacific region, the region’s ln(L) and ln(R) values were both positive
g g g g g g g g g g g
it it it it it it
Y 0 L 2 K 3 R 4 T 1 5 L 2
ln ΅ Ά ln Ά ln Ά ln Ά Ά ln
2
g g g g g g g g
it it it it
K R T L K
6 2 7 2 8 2 9
1 1 1
Ά ln Ά ln Ά Ά ln ln
2 2 2
g
g g g g g g g g git it it it it it
L R K R L T K T
Ά10 ln ln Ά11 ln ln Ά12 ln Ά13 ln
g i R Ά14
lng g
t T V it (24)
Uit = δ0 + δ1(FAit) + δ2(RDIit) + δ3(ISit) + δ4(IMESit) + δ5(IRDIit) + δ5(IRDIit) + δ6(GDPit) +
+ δ7(GDP2it) + δ8(POPit) + ωit (25)
4
T N
it it k it it k
t t
LP objective function L{ x x s t x tx
¦¦
( ) ( )1 1
ȱ ȱ :ȱmin ( ,Ά Ά ) . . ,Ά ,Ά
T N
it it k it it k
t t
QP objective function L x x s t x x
{
¦¦
t2
( ) ( )
1 1
and significant. This means that the labour input and R&D input had a positive effect on the regional out-put. Furthermore, the cross-product term of capital and time indicates the positive contribution made by the capital toward increases in the output year over year. However, the R&D input figures showed a diminishing trend, and this did not accord with the overall estimation results. The reason for this trend was perhaps because the relatively young firms in the Asia-Pacific region regarded the R&D investment as
[image:9.595.66.530.256.734.2]risky due to the long product development period, and thus were unwilling to invest a substantial amount of the R&D during the initial period. In the European region, larger capital inputs had a positive effect on the output. The North American region also displayed a trend of higher capital and R&D inputs resulting in a greater output. These results indicate that the biotechnology firms tend to adopt substantial amounts of capital inputs, and this conforms to the industry characteristic investing heavily. Similarly, by looking
Table 1. Parameter estimation results
Variable
Stochastic Frontier Estimation Metafrontier Estimation
Asia-Pacific Region
European Region
North American
Region
overall MF-LP MF-QP
Constant –0.1958 –0.1718 0.1866 0.2225 2.4500*** 2.3545***
ln(K) –0.1076 0.7291*** 0.3873*** 0.4781*** 0.3476 0.7048***
ln(L) 0.5457*** –0.1604 –0.0313 0.0366 –0.5328 –0.5955
ln(R) 0.3362** –0.1420 0.2397 –0.0306 0.3737 0.2505
0.5*ln(K)*ln(K) –0.2504*** 0.1627*** 0.0388 0.0729*** 0.0835 0.1174*
0.5*ln(L)*ln(L) 0.0723 0.3287 0.3054 0.2329*** 0.3511*** 0.3875***
0.5*ln(R)*ln(R) 0.1475*** 0.0640 0.0973** 0.0309 0.1233* 0.1654***
ln(K)*ln(L) 0.0605 –0.1336* –0.0456 –0.0670*** –0.0539 –0.1179
ln(K)*ln(R) 0.1541*** –0.0644 0.0226 –0.0180 –0.0367 –0.0245
ln(L)*ln(R) –0.1267*** –0.0233 –0.1636*** –0.0391 –0.1342* –0.1380***
T –0.0408 0.2387 –0.1151 –0.0287 –0.1908 –0.3582*
0.5*T*T 0.0218 –0.0092 0.0143 0.0050 0.0270 0.0609*
ln(K)*T 0.0979*** –0.0187 –0.0146 –0.0035 0.0293 –0.0120
ln(L)*T –0.0255 –0.0206 0.0271 –0.0011 0.0121 0.0399
ln(R)*T –0.0808*** 0.0204 0.0200 0.0321*** –0.0098 –0.0058
Constant 0.7410 –1.9802* –110.1345 –6.0085
RDI –2.8678*** –0.4899 –0.4230 –0.6653
Firm Age –0.2485*** –1.0988*** –0.2104*** –0.3095***
IS 0.4732 0.2576* 0.0261 0.0023
IMES 0.7654 12.5422*** 72.3721 6.3885***
IRDI 1.9600 2.7565*** 7.9478 3.8124
GDP 0.0294 –2.4403*** –0.6069 –0.4737***
GDP*GDP –0.0018 0.0470*** 0.0086 0.0064***
Population –0.0030* 0.0299*** –0.7643 –0.0021*
σ2 3.4585*** 10.0877*** 9.6627*** 9.4446***
γ 1.0000*** 0.9516*** 0.9589*** 0.9548***
LLF –348.6474 –541.3565 –2188.8478 –3165.4330
at the metafrontier estimation results, we can see that the capital input and the estimated stochastic frontier parameters both showed a positive effect on the output. The estimation of the inefficiency value γ (gamma) in Table 1 was greater than 0.95, indicating that the inefficiency unquestionably influenced the technical efficiency, and that it arose from human factors that could be controlled. The results from the overall sample showed that the GDP, population density, IMES, and firm age values were all significant; the GDP, population density, and firm age alleviated some of the effect of inefficiency, whereas the IMES amplified this effect.
The average GDP per capita serves as an important indicator of a country’s economic development status; the countries at higher average levels of income have relatively more established societal and economic environments to help stimulating consumption. The results produced by the overall sample and by the European region are significant; the reason that the GDP alleviates inefficiency is possibly that higher incomes suggest a greater purchasing power, and thus the firms generate higher revenues. The estimation results found by this study are similar to that con-ducted by Pasiouras et al. (2009). The comparison of the three continental regions showed that the results for the Asia-Pacific and North American regions were not significant, whereas the results for the European region were negative and significant; and those variables reduced the firm inefficiency.
In addition, the population density is also a critical variable; the density of the population may affect the level of improvement on costs and the firm efficiency (Dietsch and Lozano-Vivas 2000). The results for our overall sample were negative and significant; demonstrating that higher population densities were correlated with the reduced inefficiency. These es-timation results concur with those of Staikouras et al. (2008). The North American region’s POP value was insignificant, but that of the European region was positive and significant, while the value of the Asia-Pacific region’ was negative and significant. The results shown by the European and Asia-Pacific regions were completely opposite; the positive and significant values may be attributed to the fact that whilst both of these continental regions have large populations, the overall consumption power of the population in the European region is greater than that of the Asia-Pacific region; and the densely populated areas in the European region are scattered extensively, rather than concentrated in a few regions or cities
like those in the Asia-Pacific region. For instance, the densely populated areas in China and Australia tend to be located along the coast. This means that the firms in the European region have to invest more in distributing and marketing to the widely scattered channels, increasing their costs and thus decreasing their profits.
A higher IMES means that it may be more difficult for small firms to enter the industry, and may also lead to the larger firms becoming too complacent; consequently, they may not focus on improving their technologies. The results show that the IMES in-creased inefficiency, and this finding is in line with the results presented by Yang and Chen (2009). A pos-sible reason for this effect is that the more dominant a firm is, the more likely it is to become complacent. Many biotechnology firms tend to utilize only a few technologies and patents (including pharmaceutical products) to gain high profits once they have invented and obtained those patents, medicines, or technolo-gies. However, if they do not manage to innovate and develop other patents or products before the existing ones expire, then their profitability will be greatly affected once the term of the patents expires. With regard to the industry scale (IS), Yang and Chen (2009) originally proposed the opinion that larger firms would benefit from technical efficiencies because of their scale. Our estimated values for the IS show that the relationship is positive but insignificant; however, the implications generally concur with Yang and Chen’s (2009) empirical findings. A possible explanation for the difference in the results of the two studies is that once the scale of a firm surpasses a certain point, it may also experience the technical inefficiency. The comparison of the IS and IMES figures shows that they are positive and significant in the European region, but insignificant in the other two regions.
a negative and significant RDI value, it generally ac-cords with the values for the other two regions and the overall sample. Similarly, only the North American region presents an insignificant IRDI value; however, on the whole, the trend is in accordance with those of the other two regions.
The firm age (FA) has often been applied in many studies, and this variable has also produced different results and indicated different effects; in some previ-ous studies, it was verified to increase the inefficiency (Hill and Kalirajan 1993), but some studies found the opposite effect (Yang and Chen 2009). The reason that the firm age may reduce the inefficiency is that the firms can learn from experience, and this learning effect therefore reduces the inefficiency. However, the firm age may actually increase the inefficiency because the technologies adopted by younger firms are relatively newer; so the more obsolete technologies that older firms use may add to their cost, and thus reduce their efficiency (Yang and Chen 2009). The results from our analysis show that the firm age can reduce inefficiency, and this finding accords with that of Yang and Chen (2009). Our results show that the FA values of the different regions and of the overall sample were all negative and significant; therefore, the firm age clearly reduces inefficiency.
Analysis of technical efficiency and technology gap ratio estimations
A likelihood ratio test (LR test) needs to be done prior to conducting the efficiency estimation. The purpose of the LR test is to identify any possible difference between the different groups. Battese et al. (2004) mentioned that if different groups possess the same technical standard, then measuring the metafrontier becomes meaningless. The LR test equa-tion is λ = –2{ln[L(H0)] – ln[L(H1)]}. Here, ln[L(H0)] is the stochastic frontier likelihood function of the individual firms in the sample, and ln[L(H1)] is the total stochastic frontier likelihood function of all firms in the sample. The calculation shows a significance level higher than 5%; this indicates that differences exist between the firms’ technical standards, and the use of the metafrontier model for the analysis is reasonable and appropriate.
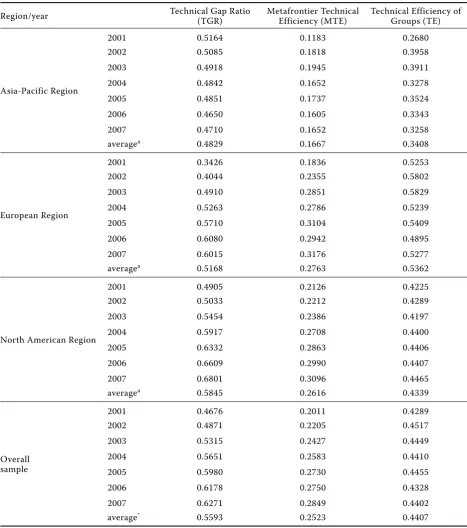
From the estimation results in Table 2, the average TGR of years 2001 to 2007 was 0.5593; the highest TGR was demonstrated by the North American region at 0.5845; the second highest TGR was displayed by
the European region at 0.5145; and finally, the Asia-Pacific region followed with a TGR of 0.4829. Firms in all three regions have a 45% room for improvement in average, with the Asia-Pacific region possessing the highest potential improvement of 51.71%. With regard to the technical efficiency, the Asia-Pacific region showed an average TE value of 0.3408, the European region’s average TE value was 0.5362, and that of the North American region was 0.4339.
The biotechnology firms in the different regions produced a low mean technical efficiency (MTE) value of only 0.2523; the Asia-Pacific region’s MTE was the lowest at only 0.1667, followed by the North American region at 0.2616, and finally by the European region at 0.2763, which was only marginally better than that of the North American region. A possible explanation for these results is that for the majority of the countries, biotechnology is still a developing industry, and the proportion of the resource allocation tends to exceed the expected output. This result is probably correlated with the fact that the biotechnology industry invests heavily, and its growth and development tend to take longer to demonstrate results.
By comparing the results of the different regions, we can see that the Asia-Pacific showed a relatively poorer performance in the terms of the TE (0.3408), TGR (0.4829) and MTE (0.1667); this could be at-tributed to the fact that within this region, Japan is the country whose biotechnology industry is the most established. Japan therefore enjoys superior advantages in the terms of technologies and resources in comparison to the less developed industries of the other four Asia-Pacific countries; hence, their performance is less ideal.
The European region’s estimated TE was 0.5362, and its MTE was the highest of all three regions at 0.2763. Its TGR was only second to the North American region at 0.5145. A possible reason for this is that although the firms in the European region may not be as established, they could still learn from the experi-ence of biotechnology firms in the United States, and therefore minimized the errors and resource waste during their development. The estimation results show that the difference in efficiency between firms of the same region was smaller than the differences between firms in different regions.
TGR, however, was by 0.07 and 0.1016 higher than those of the European and Asia-Pacific regions, re-spectively. The biotechnology industries in the North American region, particularly in the United States, are the most established; but even though there are firms possessing a good technical efficiency, there
are even more firms whose technical efficiency is poor, and this is perhaps why the average efficiency is undesirable.
[image:12.595.63.531.195.724.2]With regard to the fluctuation of the TE over time, the Asia-Pacific region’s TE first increased and then later decreased; however, compared with the 2001, the
Table 2. Technical efficiencies and technical gap ratios of the regions between 2001 and 2007
Region/year Technical Gap Ratio
(TGR)
Metafrontier Technical Efficiency (MTE)
Technical Efficiency of Groups (TE)
Asia-Pacific Region
2001 0.5164 0.1183 0.2680
2002 0.5085 0.1818 0.3958
2003 0.4918 0.1945 0.3911
2004 0.4842 0.1652 0.3278
2005 0.4851 0.1737 0.3524
2006 0.4650 0.1605 0.3343
2007 0.4710 0.1652 0.3258
averagea 0.4829 0.1667 0.3408
European Region
2001 0.3426 0.1836 0.5253
2002 0.4044 0.2355 0.5802
2003 0.4910 0.2851 0.5829
2004 0.5263 0.2786 0.5239
2005 0.5710 0.3104 0.5409
2006 0.6080 0.2942 0.4895
2007 0.6015 0.3176 0.5277
averagea 0.5168 0.2763 0.5362
North American Region
2001 0.4905 0.2126 0.4225
2002 0.5033 0.2212 0.4289
2003 0.5454 0.2386 0.4197
2004 0.5917 0.2708 0.4400
2005 0.6332 0.2863 0.4406
2006 0.6609 0.2990 0.4407
2007 0.6801 0.3096 0.4465
averagea 0.5845 0.2616 0.4339
Overall sample
2001 0.4676 0.2011 0.4289
2002 0.4871 0.2205 0.4517
2003 0.5315 0.2427 0.4449
2004 0.5651 0.2583 0.4410
2005 0.5980 0.2730 0.4455
2006 0.6178 0.2750 0.4328
2007 0.6271 0.2849 0.4402
average* 0.5593 0.2523 0.4407
*The ‘average’ represents arithmetic mean
TE value in 2007 represented a small improvement. Conversely, it’s TGR showed a trend of diminishing over time, which tells us that the firms’ productivities became more and more inefficient, and their techni-cal standards kept decreasing. A possible reason for this is that the R&D capital stock did not generate any substantial growth, and thus affected the firms’ technical efficiencies. The European region’s TE showed a little change over time, possibly because the R&D capital stock hardly increased between 2001 and 2007, and the number of staff even decreased over this time period. However, the European region’s TGR and MTE both showed the trends of increase. The North American region’s performance was similar to that of the European region; however, the North American region’s TE, MTE, and TGR all showed growth, so the overall technical efficiency and stan-dards improved during the period between 2001 and 2007. This improvement may be attributed to the fact that the input and output had both been growing by a certain amount over time.
In addition, we also used 2003 to divide the research sample into two periods, with a former period (2001 to 2003) and a latter period (2004 to 2007). The reason we also conducted the research analysis in this way was to investigate the possible effects of the Severe Acute Respiratory Syndrome (SARS) outbreak, and the completion of the human Genome Project (HGP) in 2003. When the SARS broke out in China in 2003, it quickly spread to other countries, and the
conta-gion was more serious in a few countries including China, Hong Kong, Taiwan, Canada, and Singapore. As a result of this, firms in the industries related to the preventive medicine, vaccinations, and medical equipment may have benefited. The HGP was a proj-ect that made critical breakthroughs in the terms of medical treatment, biotechnology, and medicine. The sequencing of the human genome made it possible for us to develop toward the personalized medi-cal treatment, allowed us to better investigate into genetic diseases, and thus led to a better diagnosis and treatment of those diseases. Consequently, the firms in industries related to preventive medicine, vaccines, and medical equipment may have benefit-ted. Therefore, we used 2003 as the dividing year to analyze and discuss the development of the biotech-nology industry in different countries in these two halves of the research period.
To test whether any differences exist between the estimated average TGR and MTE values of the three continental regions, we conducted a non-parametric Mann-Whitney U-test. The purpose of this test is to compare the mean difference between two populations with the same variance, or to compare the differences between two samples.
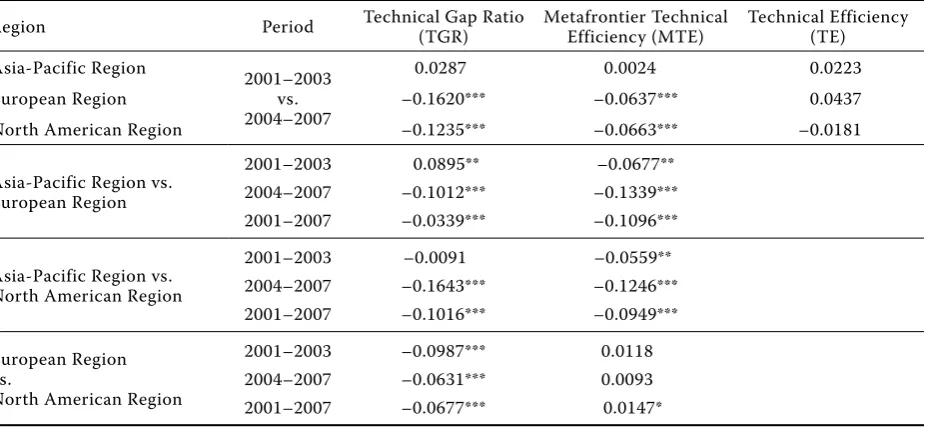
From Table 3 we can see that between the years 2001 and 2007, all three regions displayed significant differences between their estimated TGR and MTE values. At the 1% significance level, the TGR of the European and North American regions was
signifi-Table 3. U-test on the Regional Technical Efficiency and the Technical Gap Ratio
Region Period Technical Gap Ratio
(TGR)
Metafrontier Technical Efficiency (MTE)
Technical Efficiency (TE)
Asia-Pacific Region
2001–2003 vs. 2004–2007
0.0287 0.0024 0.0223
European Region –0.1620*** –0.0637*** 0.0437
North American Region –0.1235*** –0.0663*** –0.0181
Asia-Pacific Region vs. European Region
2001–2003 0.0895** –0.0677**
2004–2007 –0.1012*** –0.1339***
2001–2007 –0.0339*** –0.1096***
Asia-Pacific Region vs. North American Region
2001–2003 –0.0091 –0.0559**
2004–2007 –0.1643*** –0.1246***
2001–2007 –0.1016*** –0.0949***
European Region vs.
North American Region
2001–2003 –0.0987*** 0.0118
2004–2007 –0.0631*** 0.0093
2001–2007 –0.0677*** 0.0147*
*, **, *** denotes 10%, 5%, 1% significance level respectively
[image:13.595.68.531.509.723.2]cantly higher than that of the Asia-Pacific region, and the European region’s TGR was also significantly higher than that of the North American region. In the terms of the MTE, there was a 5% level of sig-nificance between the European and the Asia-Pacific regions, and a 10% level of significance between the European and North American regions. A 1% level of significance was observed between the Asia-Pacific and European regions, and between the Asia-Pacific and North American regions. These outcomes show that the European region’s TGR and MTE values were significantly different from those of the North American and Asia-Pacific regions, despite the dif-ferent levels of significance.
During the former period (2001 to 2003), the Asia-Pacific region’s TGR value was higher than that of the European region at the 5% significance level; however, its MTE value was significantly lower than those of the European region and the North American region. During the latter period of the analysis (2004 to 2007), the Asia-Pacific region’s TGR and MTE values were both lower than those of the European and North American regions at the 1% significance level. In comparison, the North American region’s TGR values in both halves of the research period were significantly higher than those of Europe. During the former period, the active investment and input in the Asia-Pacific region had probably contributed toward the outperformance of its biotechnology industry over that of Europe, but its input and output levels in the latter period fell behind those of Europe; subsequently, its technical efficiency improvement rates also fell behind. Looking at the periods, both the European and North American regions’ TGR and MTE values show significant differences at the 1% level which means that both regions demonstrated improvement.
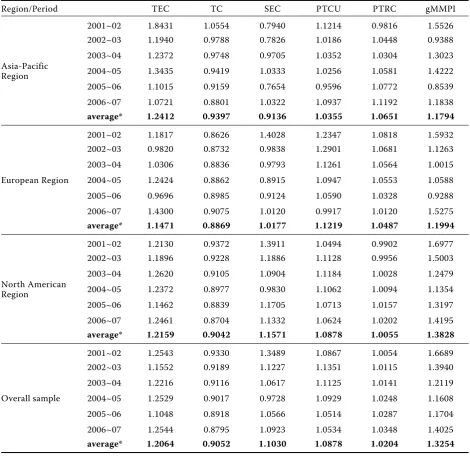
Analysis of productivity estimation
Table 4 shows the estimations of productivity. The overall results show that the gMMPI first decreased, then later increased, with an average change in value of 1.3254. A large proportion of this change was due to the change in the TEC, which means the change in productivity was mainly due to the change in the TEC (by 20.64%). The next largest change was by 10.30% in the SEC, and then in the PTCU by an av-erage of 8.78%.
In the terms of changes in efficiency in each region, the Asia-Pacific region had an average growth rate
of 17.94%, largely due to the 24.12% change in the TEC. This is the biggest change of all three regions. The least influential change was the change in SEC, which actually decreased year on year, with an av-erage decrease of 9.64%. The change in the TC also showed a diminishing trend, though the decrease was not as great as the SEC, but only decreased by an average of 6.03%. In the European region, the average growth reached 19.94%, and the main driver behind the improvement in productivity also came from the change in the TEC. The TEC increased by an average of 14.71%, and a more robust growth was seen between 2006 and 2007. However, the SEC only grew by an average of 1.77%, and the TC showed a diminishing trend, with an average decrease of 11.31%; however, the trend of diminishment also slowed over time. The North American region showed the highest growth out of the three regions, growing by 38.28%. Like in the European region, its improvement in productiv-ity came mainly from increases in the TEC, which were increased by an average of 21.59%, the second highest rate of all. The average change of the North American region in the TC showed a diminishing trend, with an average decrease of 9.58%; but its SEC showed a trend of growth, with an average annual growth of 15.71%.
Moreover, the potential technological relative change (PTRC) measures the rate of the potential improvement in technological standards as compared with the existing technological standards. If the ratio of the relative change is larger than 1, it means that the potential technological standards are improving at a faster rate than the existing technological standards; thus, the potential and room for the technological development is expanding and increasing (Chen and Yang 2008). Again, from Table 4 we can see that the potential technological change of the overall sample
[image:15.595.63.534.270.726.2]increased. The average PTRC value is 1.0204, which indicates an average growth of 2.04%; this growth rate also showed a gradual increase. In terms of the poten-tial technological changes in each region, the Asia-Pacific region showed an average annual change of 1.0651, which means an average growth of 6.51%; and this growth rate showed a gradual increase. Though the growth rate of the European region slowed over time, its average value was 1.0487, resulting in an average growth of 4.87%; on the whole, there is still room for the potential improvement in technology.
Table 4. Estimation and decomposition of productivity
Region/Period TEC TC SEC PTCU PTRC gMMPI
Asia-Pacific Region
2001~02 1.8431 1.0554 0.7940 1.1214 0.9816 1.5526
2002~03 1.1940 0.9788 0.7826 1.0186 1.0448 0.9388
2003~04 1.2372 0.9748 0.9705 1.0352 1.0304 1.3023
2004~05 1.3435 0.9419 1.0333 1.0256 1.0581 1.4222
2005~06 1.1015 0.9159 0.7654 0.9596 1.0772 0.8539
2006~07 1.0721 0.8801 1.0322 1.0937 1.1192 1.1838
average* 1.2412 0.9397 0.9136 1.0355 1.0651 1.1794
European Region
2001~02 1.1817 0.8626 1.4028 1.2347 1.0818 1.5932
2002~03 0.9820 0.8732 0.9838 1.2901 1.0681 1.1263
2003~04 1.0306 0.8836 0.9793 1.1261 1.0564 1.0015
2004~05 1.2424 0.8862 0.8915 1.0947 1.0553 1.0588
2005~06 0.9696 0.8985 0.9124 1.0590 1.0328 0.9288
2006~07 1.4300 0.9075 1.0120 0.9917 1.0120 1.5275
average* 1.1471 0.8869 1.0177 1.1219 1.0487 1.1994
North American Region
2001~02 1.2130 0.9372 1.3911 1.0494 0.9902 1.6977
2002~03 1.1896 0.9228 1.1886 1.1128 0.9956 1.5003
2003~04 1.2620 0.9105 1.0904 1.1184 1.0028 1.2479
2004~05 1.2372 0.8977 0.9830 1.1062 1.0094 1.1354
2005~06 1.1462 0.8839 1.1705 1.0713 1.0157 1.3197
2006~07 1.2461 0.8704 1.1332 1.0624 1.0202 1.4195
average* 1.2159 0.9042 1.1571 1.0878 1.0055 1.3828
Overall sample
2001~02 1.2543 0.9330 1.3489 1.0867 1.0054 1.6689
2002~03 1.1552 0.9189 1.1227 1.1351 1.0115 1.3940
2003~04 1.2216 0.9116 1.0617 1.1125 1.0141 1.2119
2004~05 1.2529 0.9017 0.9728 1.0929 1.0248 1.1608
2005~06 1.1048 0.8918 1.0566 1.0514 1.0287 1.1704
2006~07 1.2544 0.8795 1.0923 1.0534 1.0348 1.4025
average* 1.2064 0.9052 1.1030 1.0878 1.0204 1.3254
*The ‘average’ represents arithmetic mean
The North American region showed a slow but in-creasing trend in improvement, with both decreases and increases in the growth rate along the way. The average annual change was 1.0055, meaning that the average growth was 0.55%; therefore, on the whole, there is still room for the potential technological improvement in the North American region.
Looking at the entire research period of 2001 to 2007, at the 1% significance level, significant decreases were observed in the TC value between the Asia-Pacific and the European regions, and between the Asia-Pacific and North American regions. Significant differences emerged in the SEC value between the Asia-Pacific region and the North American region, and between the European and the North American regions at the 5% level of significance. All three regions showed significant differences in the PTCU values at the 5% significance level. Finally, significant differences were also discovered in the PTRC values at the 5% significance level between the Asia-Pacific and the North American regions, and between the European and the North American regions.
By analyzing the results of the former period (2001 to 2003) and the latter period (2004 to 2007), we can see that in the former period, the TC values of the Asia-Pacific region were significantly higher than those of the European and North American regions. This demonstrates that during the former period, the Asia-Pacific region’s growth in technical standards ex-ceeded the growth of the other two regions. However, in comparison, the Asia-Pacific region’s SEC value was far lower than those of the other two regions, its PTCU was much lower than that of Europe, and its PTRC value was significantly lower than those of the other two regions; which suggest that its potential for technological change was not on par with the other two regions. In the latter period, the Asia-Pacific region’s TC value was still significantly higher and its PTCU value significantly lower than those of the other two regions; however, its PTRC value was significantly superior to those of the other two regions, and its rate of the technical improvement continued to out-perform those of the European and North American regions. This suggests that the firms in the Asia-Pacific region continually gained from the experience and technologies of the firms in the other two regions and learned from them. In the latter period, the Asia-Pacific region’s TC value still showed a significant improve-ment, but the rate of improvement slowed over time; it also demonstrated significant improvements in its SEC and PTRC values. The European region’s PTCU,
PTRC, and gMMPI values all deteriorated; only its TC value improved. In the North American region, only the PTTRC value showed a significant improvement; other values, including the TC, SEC and gMMPI, all deteriorated significantly.
CONCLUSIONS
After the United States initiated the commercial-ization of the biotechnology industry, the industry has since gained a greater recognition in different countries, and those countries have been investing efforts to develop the industry. Likewise, Taiwan has also listed the biotechnology industry as a key industry for development. As different countries continue to develop their biotechnology industries, more attention is being placed on examining the operational efficien-cies of biotechnology firms, and thus many studies continue to discuss the efficiencies of biotechnology firms in various countries, and even to conduct the cross-national efficiency comparisons. However, the studies on the biotechnology industry have not been based on the concept of the metafrontier model. This study adapted the model used by Battese et al.(2004) and the research methodology adopted by Chen and Yang (2008) to conduct an analytical study on the biotechnology industries in different countries. Using the new model, we not only analyze the tech-nical efficiencies of different countries, but through the decomposition of the model equations, we are also able to provid