In connection with increasing demands for the lean meat content in slaughter pigs and the knowl-edge of relations between reproductive and produc-tion traits, particularly carcass value, differentiated breeding of dam and sire breeds was introduced in the sixties and seventies of the last century.
Many authors, e.g. Engel and Walstra (1991), Demo (1994), Demo and Poltársky (1994), Pulkrábek et al. (1994), Walstra and Merkus (1995), Čechová and Mikule (2004), Vítek et al. (2004), etc. analysed the development of carcass value in pigs on the basis of carcass analyses or by post mortem instru-mental methods.
Efforts to simplify the methods of performance testing, and particularly to cut their costs, led to the introduction of non-invasive ultrasonic instru-ments, among others into the system of perform-ance testing for the estimation of breeding values of individuals before they are placed into the herd.
Many foreign authors, e.g. Sather et al. (1987), Gresham et al. (1992), Demo et al. (1994), Kiray (1995) as well as Czech authors, e.g. Václavovský et al. (2002) evaluated the informative capacity of ultrasonic instruments used to measure the lean meat content.
The use of ultrasonic instruments worldwide and in this country resulted in changes in the system of performance testing in pigs and subsequently in modifications of the method of estimation of breeding values of animals. After pig progeny test-ing stations were abolished, a subindex for breed-ing value for lean meat content was substituted for the proportion of valuable lean cuts in the animal model for dam or sire breeds.
Recently, some researchers have pointed out the connection between the progress of selection for higher fleshiness and reproduction problems main-ly in gilts. The placement of gilts into breeding is
Supported by the Ministry of Education, Youth and Sports of the Czech Republic (Research Project No. MSM 6007665806).
The use of performance test parameters for selection
of gilts before their placement into breeding
N. Kernerová, J. Václavovský, V. Matoušek, Z. Hanyková
Department of Special Animal Husbandry, Faculty of Agriculture, University of South Bohemia, České Budějovice, Czech Republic
AbstrAct: The objectives of the paper were to evaluate carcass value in reared gilts on the basis of car-cass analysis during the station test of purebred progeny of pigs and ultrasonically with SoNoMARK-100 or PIGloG-105 instruments in the framework of valid methodology for performance testing, and to verify a pos-sibility of prediction of backfat thickness and/or average daily weight gain since birth and lean meat content of gilts as the elements of objectification for the evaluation of their body condition. In total 54 gilts of two breeds were evaluated: the dam breed Czech large White and the sire breed Czech large White – sire line. Four-param-eter Richards function was used for growth evaluation. The regression function y = 63.870 – 0.447 bt1 – 0.510 bt2 + 0.128 MllT was applied in ultrasonic instruments for the calculation of lean meat content. We calculated linear regression functions for the conversion of performance testing parameters (gain from birth, average backfat thickness and lean meat content) from live weight on the day of measurement per live weight declared during selections in gilts.
connected with early mating, and after conception with the lower number of piglets born in parity 1 and/or with a prolonged time until the onset of further practically utilisable oestrus that may be twice longer than in older sows. For these reasons producers may often be convinced that the gilt de-signed for replacement of the basic herd of sows is a risky factor. Besides nutrition, health and animal welfare the early mating of gilts, early weaning of piglets and optimum farrowing interval are the main production and economic efficiency factors in the piglet industry (Říha et al., 2001).
According to Schneeberger (2005) especially in young gilts in farrowing pens weight losses and negative changes in their body condition occur. He explains it by lower than required daily feed intake. He proves that in operating conditions nursing sows take in only 6 kg of feed on average instead of the required 7 kg. The lower intake of total mixed ration results in the loss of about 10 kg of live weight and 1.5 mm of backfat thickness dur-ing piglet suckdur-ing. Consequently, the sows have irregular or delayed oestrus, and the value of ovula-tion or implantaovula-tion is also influenced negatively. These problems are typical of young gilts whose bodily growth has not been completed yet.
Recent knowledge of the relations between re-productive disorders and carcass composition of gilts (sows) indicates that the reduction of so called fat depot achieved by breeding may explain this problem only partially. However, the absolute or dynamic level of the lean meat content may be at the same time a critical parameter for the normal course of reproductive functions in gilts and sows (Říha et al., 2001).
Similar problems were solved in the papers of Kuhlers and Jungst (1993), Kerr and Cameron (1994), Klausing and lenz (1994), Fiedler et al. (2001).
In the breeding process in pigs aimed at higher meat production not only carcass value and fat-tening performance traits but also growth and live weight development should be controlled. In original pig populations these characteristics are suitable prediction parameters of development and conformation traits of pigs.
The manifestations of growth are a resultant of interactions of all organ and functional systems of the animal. It is extremely difficult to define growth in a clear, exact and exhaustive way as many au-thors stated in their publications, e.g. Šiler et al. (1980), etc.
Some authors use performance traits for the evaluation of growth ability, others use parameters from testing stations (Pavlík et al., 1987; Pavlík and Kolář, 1989; etc.).
A number of methods has been developed to represent growth. Growth analyses were reviewed by Robison (1976). Fitzhugh (1976) and Kníže and Hyánek (1981) examined the growth of farm ani-mals by means of growth curves. Knížetová (1994) studied relationships between the shape of growth curve, feed conversion and carcass quality. Growth curves can be analysed from husbandry and eco-nomic aspects.
The construction of growth models for farm animals in relation to various physiological func-tions was reported by many authors, e.g. Rogers et al. (1987), Emmans (1997), Hurwitz and Talpaz (1997).
MAtErIAL AND MEtHODs
The objectives of the present paper were to de-termine the level of carcass value in reared gilts of the dam breed Czech large White (ClW) and of the sire breed Czech large White – sire line (ClWs) on the basis of “conventional” carcass anal-ysis used by the end of 2003 at pig progeny stations for the testing of purebred progeny of pigs and ul-trasonically with SoNoMARK-100 (SM-100) or PIGloG-105 (PI-105) instruments in the frame-work of valid methodology for performance testing, and to verify a possibility of prediction of backfat (“fat depot”) thickness or average daily gain since birth and lean meat content in gilts as the elements of objectification in the evaluation of their body condition.
For the evaluation of growth abilities and con-struction of growth curves the gilts were weighed at periodic weekly intervals from birth (piglets in herds were weighed at the station until they reached ca. 25 kg) until they reached the average live weight of 127 kg. The growth curves, described by Richards (1959), were simulated according to Nýdl and Tichý (1989) whereas their parameters and characteristics were interpreted in accordance with Knížetováet al. (1985).
A day before slaughter the gilts were measured with ultrasonic instruments SM-100 and PI-105 according to the methodology for determination of PT parameters. A modification of the given meth-odology was that for the purposes of carcass analy-sis of the cold right side of pork the parameters of backfat thickness (bt1 in mm), backfat thickness and depth of MllT (bt2 and MllT in mm) were measured at a distance of 70 mm to the right later-ally from the central line. The regression function
y = 63.870 – 0.447 bt1 – 0.510 bt2 + 0.128 MllT was used in both instruments for the expression of lean meat (lM) content.
In the next part of our study regression coeffi-cients were calculated for the adjustment of param-eters determined by PT (average gain from birth in g, average backfat thickness in mm, lean meat content in %) to single live weight. We used data on performance testing from central records of the
Pig Breeders Union (PBU). Data on gilts were re-classified according to live weight as on the date of measurement in the interval of 4.9 kg in the weight range from 68 to 136 kg and adjusted for extremes. Correlation and regression analysis was done in a sampling set. Regression coefficients (byx) for the adjustment of values measured in vivo with the ul-trasonic instrument SM-100 were obtained from the calculated linear regression equations. This part of the study was performed in the framework of the grant NAZV QC 1041 for PBU for all breeds and hybrid combinations of pigs used in the hy-bridisation programme in the Czech Republic.
rEsULts AND DIscUssION
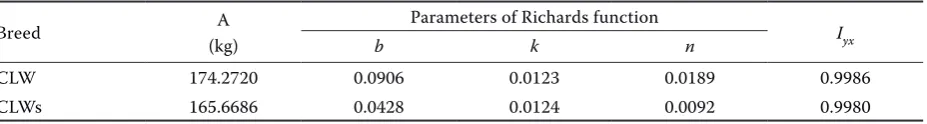
Tables 1 and 2 show the calculated parameters and characteristics for growth curves of gilts of the dam breed ClW and sire breed ClWs. Table 1 documents some differences in growth intensity between gilts of the two breeds: the values of coef-ficients k are almost identical but coefficients n
[image:3.595.68.532.102.164.2]are different. Coefficient k indicates changes in the logarithmic growth rate while coefficient n is con-sidered by some authors, e.g. Knížetová (1994), as an “index of growth earliness”. In our experiment ClWs gilts were “earlier”. The evaluation of the growth of breeds showed that the fastest changes
Table 1. Parameters of Richards function in Czech large White (ClW) and Czech large White – sire line (ClWs) gilts
Breed A
(kg)
Parameters of Richards function
Iyx
b k n
ClW 174.2720 0.0906 0.0123 0.0189 0.9986
[image:3.595.64.532.599.658.2]ClWs 165.6686 0.0428 0.0124 0.0092 0.9980
Table 2. Characteristics of Richards function in Czech large White (ClW) and Czech large White – sire line (ClWs) gilts
Breed Characteristics of Richards function
t1 (days) ti(days) t2 (days) yi (kg) vi (g/day) v (g/day) I (%)
ClW 48.49 127.42 206.35 64.71 781 531 37.13
ClWs 46.03 123.98 201.92 61.23 752 511 36.96
yi = live weight at the inflexion point (kg)
ti = age at the inflexion point (days)
vi = maximum gain at the inflexion point (g/day)
v = average daily gain since birth (g/day)
t1 = age of maximum acceleration of growth (days)
t2 = age of maximum deceleration of growth (days)
in growth in ClWs breed occurred in the auto-ac-celeration part of growth curve whereas changes in the growth rate in this part of growth curve in ClW breed were somewhat slower. ClWs breed appeared earlier in this phase.
Data in Table 2 illustrate changes in the shape of growth curves that occurred in the course of 10 years. E.g. Václavovský et al. (1993) reported coefficients I (%) expressing the ratio of weight at the inflexion point to asymptotic weight in ClW to be at the level of 46–47%. In the studied set this value was 37%. Thanks to the progress of breed-ing work and other changes in the production type the growth curves resemble by their shape growth curves of intensively growing farm animals, par-ticularly poultry (Rogers et al., 1987) and the ap-plication of Gompertz three-parameter function would be possible. The curve has a shorter auto-acceleration part followed by a very long linear seg-ment of growth. It is also evident from values t1 when the growth acceleration is maximum (at
48–49 days of age in ClW), and from ti and yi, i.e. the definition of the inflexion point, which was reached in ClW at 64–65 kg and at 127–128 days, respectively. The growth curve of ClWs breed had a different shape. The auto-acceleration part is also short and steep, followed by a very slightly convexly curved long segment of growth. The linear phase is not expressed very much. The inflexion point was reached at a very early age before day 124 of age, around 61 kg, but the breed tends to “decelerate” its growth at about the 7th month of age.
Table 2 contains maximum and average daily gains. Evaluating their level (daily gain since birth 531 g and 511 g and maximum daily gain at the inflexion point 781 g and 752 g for ClW and ClWs, respectively) it is to note that the maximum mani-festation of growth potential was not the objec-tive of the growth experiment. The animals were selected for the growth experiment randomly, and the experiment should be viewed from the aspect of the rearing of breeding animals. The lower
maxi-Table 3. Basic statistics of primary traits in Czech large White (ClW) and Czech large White – sire line (ClWs) gilts
Parameter Units ClW ClWs
n x ± sx s n x ± sx s
Slaughter weight kg 20 125.80 ± 0.46 2.07 34 124.09 ± 0.77 4.48
Right side of pork kg 20 49.60 ± 0.36 1.59 34 48.94 ± 0.28 1.64
Carcass length mm 20 830 ± 7.13 31.89 34 832 ± 3.05 17.76
Backfat thickness 1 mm 20 34.90 ± 0.20 6.97 34 29.72 ± 0.98 5.72
Backfat thickness 2 mm 20 21.50 ± 0.92 4.09 34 18.83 ± 0.68 3.96
Backfat thickness 3 mm 20 16.00 ± 1.17 5.25 34 12.39 ± 0.56 3.29
Average backfat thickness mm 20 24.13 ± 1.12 4.99 34 20.31 ± 0.64 3.78
loin kg 20 6.04 ± 0.26 1.15 34 5.94 ± 0.10 0.57
Neck kg 20 4.33 ± 0.17 0.75 34 4.37 ± 0.06 0.33
Shoulder kg 20 5.03 ± 0.10 0.47 34 5.20 ± 0.04 0.25
Ham kg 20 10.39 ± 0.18 0.80 34 10.70 ± 0.08 0.46
Belly kg 20 8.47 ± 0.14 0.64 34 8.22 ± 0.12 0.70
Valuable lean cuts % 20 52.02 ± 1.18 5.27 34 53.58 ± 0.43 2.50
Ham % 20 20.95 ± 0.33 1.46 34 21.88 ± 0.18 1.06
Eye-muscle area mm2 20 6077 ± 90.30 851 34 6072 ± 55.72 908
SM – backfat thickness 1 mm 20 12.96 ± 1.00 4.48 34 9.96 ± 0.54 3.12
SM – backfat thickness 2 mm 20 15.08 ± 1.08 4.83 34 11.16 ± 0.72 4.20
SM – muscle depth mm 20 59.96 ± 1.65 7.39 34 59.84 ± 1.23 7.20
SM – lean meat content % 20 58.35 ± 0.83 3.72 34 61.64 ± 0.62 3.60
PI – backfat thickness 1 mm 20 15.60 ± 1.09 5.34 34 11.00 ± 0.50 2.89
PI – backfat thickness 2 mm 20 15.60 ± 0.89 3.98 34 11.79 ± 0.54 3.17
PI – muscle depth mm 20 54.90 ± 2.40 10.71 34 55.58 ± 1.06 6.18
[image:4.595.71.531.393.761.2]mum and average gains in gilts of the sire breed are likely to be connected with higher demands for the formation and growth of muscle volume than in gilts of the dam breed.
Říha et al. (2001) reported a marked improvement of phenotype values in favour of daily gain in gilts of dam breeds ClW and Cl with a positive decrease in the age at the 1st mating and farrowing, and of
the number of all and live born piglets in parities 1 in the years 1995–1998. The reported weight gain of ClW gilts was 555 g. The value in Table 2 (531 g in ClW) proves the stabilised average growth abil-ity and the values correspond with each other. Such growth intensity during rearing will make it pos-sible to mate gilts within 7.5–8.5 months of age and in the weight range of 130–140 kg. So gilts will be mated in practically utilisable not in pubertal oe-strus, and low conception rate and low number of piglets born per litter will be avoided. on the other hand, these values of weight gain during rearing ensure conditions for the harmony of growth with the development of body organs of a maturing in-dividual and do not promote the fattening capacity of breeding animals prematurely.
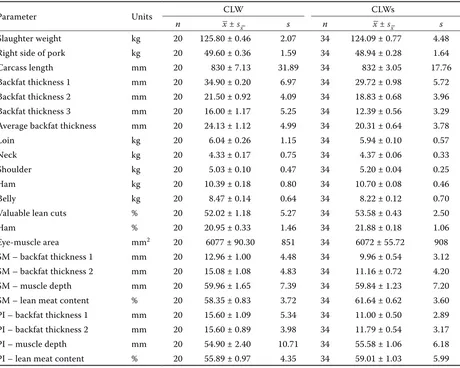
Table 3 contains the basic statistics of primary traits of carcass value measured post mortem and
in vivo in gilts of both breeds. These are animals in which the growth ability was examined during prolonged testing until the average live weight of 127 kg was reached.
The analysis of carcass data confirmed the trend of an increase in the absolute weight of main valu-able cuts (MVC) in kg but it also showed that the proportion of MVC and ham decreased with in-creasing slaughter weight. The proportion of MVC and ham in slaughtered gilts of ClW and ClWs breeds was 52.02 ± 1.18% and 20.95 ± 0.33%, and 53.58 ± 0.43% and 21.88 ± 0.18%, respectively. The respective average backfat thickness in ClW and ClWs gilts was 24.13 ± 1.12 mm and 20.31 ± 0.64 at average slaughter weight of 125.80 ± 0.46 kg and
124.09 ± 0.77, respectively. For the large White breed at 100 kg live weight Demo and Poltársky (1994) reported the proportion of MVC amount-ing to 49.23% and average backfat thickness of 24.3 mm; the proportion of MVC found out by Demo (1994) for hybrid combinations at the same weight was 51.26%, at 155 kg and higher it was 46.19% while the values reported by Pulkrábek et al. (1994) in gilts of ClW breed for the propor-tion of MVC (from detailed analyses at the aver-age weight of sides of pork 46.63 ± 0.412 kg) were 49.31 ± 0.754%. Vítek et al. (2004), who studied the influence of slaughter weight on carcass value in various hybrid combinations produced in the CR, found out the lean meat content in dressed carcass at the weight of 125 kg and higher to amount to 54.32%.
To determine the lean meat content during growth with PI-105 and SM-100 instruments the animals were weighed a day before slaughter, i.e. at average live weight of 127 kg. Using the PI-105 instrument we measured the lean meat content of 55.89 ± 0.97% and 59.01 ± 1.03% in ClW and ClWs breed, respectively; the respective values measured with SM-100 were 58.35 ± 0.83% and 61.64 ± 0.62% while the values of backfat thickness bt1 and bt2 (for the same order of breeds) were 15.60 ± 1.09 mm and 15.60 ± 0.89 mm, and 11.00 ± 0.50 mm and 11.79 ± 0.54 mm if PI-105 was used. The SM-100 instrument showed the backfat thickness of 12.96 ± 1.00 mm and 15.08 ± 1.08 mm, and 9.96 ± 0.54 mm and 11.16 ± 0.72 mm, respectively. In hybrid com-binations measured with PI-105 at the live weight above 115 kg Demo (1994) reported the value of lean meat content 49.37%, bt1 25.68 mm and bt2
[image:5.595.64.532.672.756.2]26.10 mm. In breeding gilts of the White Meaty × Duroc combination and live weight above 120 kg these values were measured (with PI-105) by Demo et al. (1994): bt1 = 23.68 mm, bt2 = 22.39 mm and lean meat content 48.13%. Average lean meat con-tent and average backfat thickness in gilts of ClW
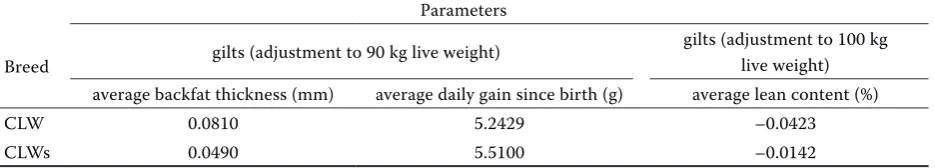
Table 4. Regression coefficients for the adjustment of performance test parameters in ClW and ClWs gilts in vivo to single weight
Parameters
Breed gilts (adjustment to 90 kg live weight)
gilts (adjustment to 100 kg live weight) average backfat thickness (mm) average daily gain since birth (g) average lean content (%)
ClW 0.0810 5.2429 –0.0423
breed from performance testing in 1998 found out by Říha et al. (2001) were 58.59% and 10.66 mm, respectively. These authors also stated that the marked improvement of these phenotype values against 1995 did not have a negative influence on the reproductive performance of gilts; on the con-trary, a positive decrease in age at the 1st mating
and/or farrowing was demonstrated as well as a positive trend of the number piglets born in pa-rity 1.
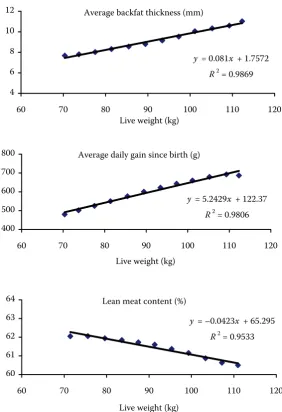
Table 4 shows regression coefficients for breeding gilts of ClW and ClWs breeds currently used by the PBU for the adjustment of parameters under PT to single live weight. Average daily gain and average backfat thickness are converted (in accordance with the valid methodology – CSN 46 6164 standard) per 90 kg live weight whereas lean meat content is converted per 100 kg live weight. Figures 1 and 2 show the trends of measured traits during rearing
at the weight intervals 70–110 kg when they are determined. The regression equations, character-ised by the linear course of correlations with a high level of closeness of the examined relations given by the value of determination coefficient in the range of 0.57 to 0.98 (rxy = 0.76–0.99), document general regularities of increasing backfat thickness and de-creasing lean meat content in the body of gilts with increasing live weight.
As some findings from the evaluation of suit-ability of methodical procedures in breeding programmes of dam breeds after the correlation analysis of the relations between basic perform-ance parameters and breeding measures applied in breeding herds was done, lead to partial conclu-sions that the level of reproductive traits in the herd is not fully associated with the level of traits from station tests and because the coefficients of corre-lation between data describing selection intensity
Average backfat thickness (mm)
y = 0.081x + 1.7572
R2 = 0.9869
4 6 8 10 12
60 70 80 90 100 110 120
[image:6.595.68.351.84.497.2]Live weight (kg)
Figure 1a
Average daily gain since birth (g)
y = 5.2429x + 122.37
R2 = 0.9806
400 500 600 700 800
60 70 80 90 100 110 120
Live weight (kg)
Figure 1b
Lean meat content (%)
y = –0.0423x + 65.295
R2 = 0.9533
60 61 62 63 64
60 70 80 90 100 110 120
Live weight (kg)
Figure 1c
during the rearing of breeding animals and repro-ductive traits and/or traits from a field test have low statistically insignificant values (Fiedler et al., 2001), it would be suitable to introduce some objec-tive elements into mostly subjecobjec-tive evaluation of the body condition of gilts (sows). Besides weight gain these elements may be average backfat thick-ness from measurements bt1 and bt2 and lean meat content as determined by PT in gilts and converted according to the above-mentioned regression func-tions from the weight at the day of measurement per weight declared at selections. The graders (the commission) evaluating the type, constitution and conformation of breeding gilts will be given an ob-jective guide for the allocation of scores 1–5 for the type (lean meat content) and for the condition (backfat thickness).
Klausing and lenz (1994) proposed the evalua-tion of sow body condievalua-tion by a four-point scale
(1 – good, 2 – slightly thin, 3 – very thin, 4 – fat). The aim of husbandry and feeding techniques and nutrition should be to maintain sows in condition 1–2 for the whole reproduction cycle while condi-tion 3 is acceptable only at the end of lactacondi-tion. They point to the relationship between backfat thickness and parity. Gilts (parities 1) with backfat thick-ness of 23 mm have a good condition, those with 17–23 mm have a “normal” condition and animals with less than 17 mm of fat have a bad condition. It is recommended to mate gilts at live weight of 125–145 kg and backfat thickness between 18 and 20 mm.
German producers consider objective ultrasonic measurements as a good method of checking the subjective evaluation of condition. Measurements are done at the last thoracic vertebra at a distance of 65 mm from the central line (Schweinezucht und Schweinemast, 1998). This method corresponds
Figure 2. Regression function in gilts – Czech large White-sire line
Average backfat thickness (mm)
y = 0.049x + 3.1224
R2 = 0.9807 4
6 8 10 12
60 70 80 90 100 110 120
Live weight (kg)
Figure 2a
Average daily gain since birth (g)
y = 5.51x + 99.147
R2 = 0.9778 400
500 600 700 800
60 70 80 90 100 110 120
Live weight (kg)
Figure 2b
Lean meat content (%)
y = –0.0142x + 64.749
R2 = 0.5698 61
62 63 64 65
60 70 80 90 100 110 120
Live weight (kg)
with the measurement of backfat thickness bt2
when PT parameters are determined in the Czech Republic.
rEFErENcEs
Čechová M., Mikule V. (2004): The analysis of carcass value in pigs of different genotypes. Czech J. Anim. Sci., 49, 383–388.
CSN 46 6164 (1990): Performance recording and progeny testing of pigs.
Demo P. (1994): Hodnotenie jatočných tiel ošípaných podľa podielu cenných mäsových častí pomocou re-gresných rovníc. Živoč. Výr., 39, 629–641.
Demo P., Poltársky J. (1994): Predikcia podielu mäsových častí ošípaných s využitím niektorých mier jatočného tela. Živoč. Výr., 39, 275–284.
Demo P., Poltársky J., Borecký P., Parák M. (1994): odhad výšky jatočných parametrov ošípaných pomocou prístrojovej techniky. Živoč. Výr., 39, 549–557. Emmans G.C. (1997): A method to predict the food intake
of domestic animals from birth to maturity as a func-tion of time. J. Theor. Biol., 186, 189–199.
Engel B., Walstra P. (1991): A simple method to increase precision or reduce expense in regression experiments to predict the proportion of lean meat of carcasses. Anim. Prod., 53, 353–359.
Fiedler J., Houška l., Pavlík J. (2001): The evaluation of breeding work in nucleus herd of pigs. Czech J. Anim. Sci., 46, 358–362.
Fitzhugh H.A. (1976): Analysis of growth curves and strategies for altering their shape. J. Anim. Sci., 42, 1036–1051.
Gresham J.D., McPeake S.R., Bernard J.K., Henderson H.H. (1992): Commercial adaptation of ultrasonography to predict pork carcass composition from live animal and carcass measurement. Anim. Sci. J., 70, 631–639. Hurwitz S., Talpaz H. (1997): Modelling of growth. In:
Proc. 11th European Symposium on Poultry Nutrition,
Faaborg, 148–157.
Kerr J.C., Cameron N.D. (1994): Reproductive perform-ance of pig selected for components of efficient lean growth. Anim. Prod., 58, 430.
Kiray A. (1995): odborné stanovisko na ultrazvukový prístroj na meranie hrúbky slaniny a svalstva a diag-nostiky prasnosti SoNoMARK SM 100-S. Research Institute for Animal Breeding and Nutrition Hercegha-lom, Hungary.
Klausing H.K., lenz H. (1994): Füttern auf Kondition – Grundlage einer erfolgreichen Ferkelerzeugung. Schweinezucht und Schweinemast, 42, 14–17.
Kníže B., Hyánek J. (1981): Charakteristika analýzy růstu hospodářských a laboratorních druhů zvířat. Biol. listy, 46, 193.
Knížetová H. (1994): Vztahy mezi tvarem růstové křivky, konverzí krmiva a jatečnou kvalitou. In: Růst hospo-dářských zvířat a metodické přístupy k jeho hodnocení. Praha, VÚŽV Uhříněves. 21–22.
Knížetová H., Kníže B., Hyánek J., Hájková H., Křížová J. (1985): Analýza růstových křivek u kontrastních linií a F1 hybridních kombinací kuřat. Živoč. Výr., 30, 1067– 1075.
Kuhlers D.l., Jungst S.B. (1993): Correlated responses in reproductive and carcass traits to selection for 200-day weight in landrace pigs. Anim. Sci. J., 71, 595–601. Nýdl V., Tichý R. (1989): Modelling growth curves. In:
Sbor. Vysoká škola zemědělská, Fakulta agronomická, České Budějovice, řada zootechnická. 6, 71–80. Pavlík J., Kolář M. (1989): Změny v průběhu růstu prasat
ve vztahu k úrovni jejich produkčních znaků. Živoč. Výr., 34, 775–784.
Pavlík J., Pulkrábek J., Kolář M. (1987): Analýza růstu potomků různých plemenných kanců plemene přeštické černostrakaté. Živoč. Výr., 32, 823–832.
Pulkrábek J., Fiedler J., Smital J., Houška l., Adamec T. (1994): Podíl tkání v jatečném těle u plemen prasat cho-vaných v České republice. Živoč. Výr., 39, 743–751. Richards F.J. (1959): A flexible growth function for
em-pirical use. J. Exp. Bot., 10, 290–300.
Robison o.W. (1976): Growth patterns in swine. J. Anim. Sci., 42, 1042–1035.
Rogers S.R., Pesti G.M., Marks H.l. (1987): Comparison of three nonlinear regression models for describing broiler growth curves. Growth, 51, 229–239.
Říha J., Čeřovský J., Matoušek V., Jakubec V., Kvapilík J., Pražák Č. (2001): Reprodukce v procesu šlechtění pra-sat. 1. vyd., Šumperk, VÚCHS s.r.o., Rapotín. 135 pp. Sather A.P., Tong A.K.W., Harbison D.S. (1987): A study
of ultrasonic probing techniques for swine. 2. Predic-tion of carcass yield from the live pig. Can. J. Anim. Sci., 67, 381–389.
Schneeberger E. (2005): Jak zajistit, aby kojící prasnice zůstaly v nejlepší formě. Úspěch ve stáji, 10, 16. Schneeberger E. (2005): Schweinezucht, Schweinemast
(1998): Wieviel Rückenspeck braucht die Sau? 46, 32–35.
Šiler R., Kníže B., Knížetová H. (1980): Růst a produk- ce masa hospodářských zvířat. 1. vyd. SZN, Praha. 280 pp.
Václavovský J., Matoušek V., Kernerová N., Kouglová P., Nýdl V., Novotný F. (2002): Prediction of lean content in breeding pigs by in vivo and post mortem methods. Czech J. Anim. Sci., 47, 476–483.
Vítek M., Pulkrábek J., Pavlík J., Vališ l. (2004): The analysis of pig carcasses of different weights. In: Actual Question of Production Slaughter Animals. MZlU, Brno, 133–137.
Corresponding Author
Ing. Naděžda Kernerová, Ph.D., Department of Special Animal Husbandry, Faculty of Agriculture, University of South Bohemia, Studentská 13, 370 05 České Budějovice, Czech Republic
Tel. +420 387 772 603, e-mail: [email protected]
Walstra P., Merkus G.S.M. (1995): Procedure for assess-ment of the lean meat percentage as a consequence of the new EU reference dissection method in pig carcass classification. Dlo – Research Institute for Animal Science and Health Research Branch, Zeist, The Neth-erlands, 1–22.