Experimental model of ammonia elimination
by ozone in the air
P. Hutla, B. Petráková, J. Kára
Research Institute of Agricultural Engineering, Prague, Czech Republic
Abstract
Hutla P., Petráková B., Kára J., 2013. Experimental model of ammonia elimination by ozone in the air. Res. Agr. Eng., 59: 39–45.
Experimental device was created to model stable atmosphere. Th e device consists of the glass vessel fi lled with air. Vol-ume of the vessel is 30 litres. Th e ammonia concentration is similar to stable air. Amount of ozone in 2.4 mg was added and subsequently weight loss of ammonia was measured. Measurements were performed at diff erent temperatures (20°C, 45°C) and diff erent air humidity. Th e observed ratio of reacting ozone and ammonia is 5.2:1. It was also found, that this ratio is practically independent of temperature and relative humidity that occur in a stable environment. Th e results are the basis for the design of ozone air purifi cation technology.
Keywords: stable atmosphere; air purifi cation technology; animal stables; air purifi cation by ozone
Th e impact of ozone on the reduction of the am-monia concentration in the air was tested in order to determine the amount of ozone necessary in the environment of animal stables. Th e fundamental mechanism of the ozonizing process with the goal of reducing the concentration of the ammonia in the air assumes powerful oxidation qualities of ozone which through a chemical reaction reduces the ammonia. Th e reaction between ozone and ammonia was periodically investigated in the past 90 years. It can be simply described as (Wikipedia 2010):
2NH3+4O3→NH4NO3+4O2+H2O (1)
Aside from Eq. (1), older studies present another possible reaction (Strecker, Thieneman 1920):
2NH3+3O3→3O2+H2O+NH4NO2 (2)
In the study, an observation was made that dur-ing a certain period of time the ozone bubbles
through the ammonia solution; at the temperature –78°C the solution assumes an intense red-orange colour. With an increased temperature, the colour fades and disappears at –60°C. Red-orange com-pound was analysed in several studies. It was iden-tifi ed (Solomon et al. 1962) as ammonia ozonide
NH4+O3−.
Th e reaction kinetics NH3-O3 producing NH4NO3 were studied in a water solution (Hoigné, Bader 1978) in the gas stage (Olszyna, Heicklen 1972) as well as in the condensation stage (Huston et al. 1983). If ozone and ammonia react in the gas stage at room temperature, the majority of the products are NH4NO3, O2 and H2O, produced according to the noted Eq. (1). Th is was documented by fi ndings that the amount of produced gas products relative to the reacting ozone is 1.05 (O2) and 0.31 (H2O) (OlsZyna, Heicklen 1972). Compare to these stated chemical mechanics, it is noted that the ozone reaction to multiple inner air contaminants
can be active for several months (Boeniger 1995). It is also noted, that a direct oxidation of ammo-nia through the ozone in the water solution is fairly slow (Hoigne 1998).
What is important for further applications in practice is that the half-life of the ozone disinte-gration lasts from 2.5 to 7 min, however in a clean environment this value can increase to 60 min (Keener et al. 1999). In other sources (Wikipedia 2010), the half-life of ozone disintegration is stated as 45 min at 20°C and 20 min at 30°C. Th e ozone concentration is being reduced according to the following equation:
(3)
where:
ρ – ozone concentration (g/m3)
ρ0 – concentration at the beginning (g/m3)
th – half-life of disintegration (min)
t – time (min)
While applying the Eq. (1), the following are the re-sulting ratios of the entering and exiting compounds (NH3:O3:NH4NO3:O2:H2O): 34:192:80:128:18.
MATERIAL AND METHODS
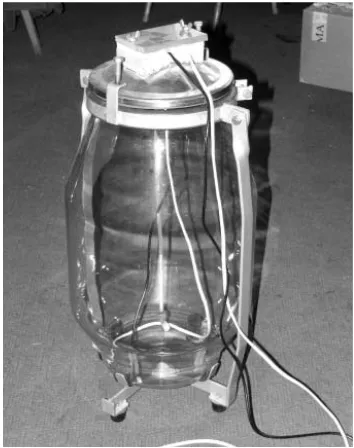
A series of lab work was done in order to dem-onstrate the applications in practice. Amounts of ozone and ammonia entering their reaction were sampled in order to determine how much ozone is necessary to add in order to eliminate a given amount of ammonia from the air. A tightened glass container of 30 l capacity was used for the
experi-ments. Diagnostic equipment Data logger NH3
(Protronix, Chrudim, Czech Republic) (Fig. 1) was used to determine concentration of the ammonia. Th is diagnostic apparatus allows for an independ-ent recording of NH3 values, temperature and rela-tive humidity of the air during one minute, range of diagnosing the NH3 concentration is 0–50 2 ppm; temperature is measured in the range between 0 and 40 0.5°C, air humidity 0–100% (up to 90 2 %). Th e apparatus can be connected through a USB ca-ble to a computer which allows for a direct reading of the specifi c quantities. For the purpose of homog-enization with a possible warm-up of the air in the container, an apparatus was constructed to include a ventilator with a diameter of 45 mm and a series of halogen lights with input 3 × 50 W. Th e entire equip-ment was powered by a source of voltage 12 V. Th e
entry points of the power and measuring conduc-tors were inserted and fully sealed into the lid of the container. Th e lid also contained closable openings for the entry and exit of gases. Th e entire measuring system for confi rmation of reaction O3 and NH3 is shown in the Fig. 2.
A portable ozone generator (Fig. 3), brand ITTU 500.ACE (AZCO Industries, Langley, Canada), is the source of the actual ozone. Th e principle of this equipment is based on the electrical discharge (corona discharge), during which the two-atom oxygen molecules divide themselves into singular atoms, which then re-connect, partially into three-atom molecules. Th e entering air is being dried
[image:2.595.329.506.84.308.2]us-Fig. 1. Data logger NH3
Fig. 2. Measuring equipment for confi rmation of reaction O3-NH3
[image:2.595.307.528.527.725.2]ing silica-gel heaters/dryers to practically a zero value of relative humidity. Th e ozone generator al-lows for regulation of the entering volume of air as well as the intensity of the source of the ozone.
For further confi rmation of the reaction between NH3-O3, the density values of the ammonia and ozone were found to be of importance at various temperature levels, as well as the resulting volume and mass concentrations.
In case of ammonia:
ρ= 0.73 kg/m3 at 15°C
In case of ozone:
ρ = 2.144 kg/m3 at 0°C
For calculations of the density value at diff erent temperature levels, the following equation may be used:
V
T = const. (4)
where:
V – volume of the gas (m3)
T – the absolute temperature of the gas (K)
and which means ρ × T = const.
where:
ρ – the density of the gas (kg/m3)
During the measurements, the reached ammo-nia concentration was up to 70 ppm, which cor-responded to the amount of approximately up to 1.7 mg. According to the Eq. (1) in order to create reaction of this amount of ammonia, about 9.5 mg of ozone was necessary. Th is corresponds to the amount of 6 l at the exiting ozone concentration of 1.6 g/m3. Prior to the beginning of each reaction, the container was rinsed with the technical air, which among other also achieved a very low level of relative humidity of the gas.
Confi rmation of calibration dependence of the ozone generator.Since the quantities of the react-ing gases are bereact-ing confi rmed in the container, it is necessary to assure for suffi cient exactness of the found mass of the reacting ozone. For this pur-pose, the ozone concentration level at the exit from the ozone generator was determined by using the measuring equipment APOA 350 E (Horiba,
[image:3.595.65.403.83.309.2]Kyo-Fig. 3. Portable ozone generator ITTU 500.ACE
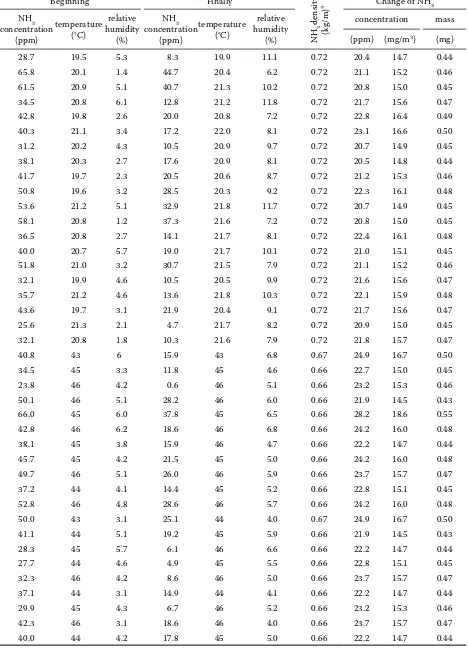
[image:3.595.63.291.451.727.2]Table 1. Reaction NH3-O3 in the air with low relative humidity of gas in the vessel with a capacity of 30 l
Beginning Finally
NH
3
density
(kg/m)
3 Change of NH3 NH3
concentration (ppm)
temperature (°C)
relative humidity
(%)
NH3 concentration
(ppm)
temperature (°C)
relative humidity
(%)
concentration mass
(ppm) (mg/m3) (mg)
28.7 19.5 5.3 8.3 19.9 11.1 0.72 20.4 14.7 0.44
65.8 20.1 1.4 44.7 20.4 6.2 0.72 21.1 15.2 0.46
61.5 20.9 5.1 40.7 21.3 10.2 0.72 20.8 15.0 0.45
34.5 20.8 6.1 12.8 21.2 11.8 0.72 21.7 15.6 0.47
42.8 19.8 2.6 20.0 20.8 7.2 0.72 22.8 16.4 0.49
40.3 21.1 3.4 17.2 22.0 8.1 0.72 23.1 16.6 0.50
31.2 20.2 4.3 10.5 20.9 9.7 0.72 20.7 14.9 0.45
38.1 20.3 2.7 17.6 20.9 8.1 0.72 20.5 14.8 0.44
41.7 19.7 2.3 20.5 20.6 8.7 0.72 21.2 15.3 0.46
50.8 19.6 3.2 28.5 20.3 9.2 0.72 22.3 16.1 0.48
53.6 21.2 5.1 32.9 21.8 11.7 0.72 20.7 14.9 0.45
58.1 20.8 1.2 37.3 21.6 7.2 0.72 20.8 15.0 0.45
36.5 20.8 2.7 14.1 21.7 8.1 0.72 22.4 16.1 0.48
40.0 20.7 5.7 19.0 21.7 10.1 0.72 21.0 15.1 0.45
51.8 21.0 3.2 30.7 21.5 7.9 0.72 21.1 15.2 0.46
32.1 19.9 4.6 10.5 20.5 9.9 0.72 21.6 15.6 0.47
35.7 21.2 4.6 13.6 21.8 10.3 0.72 22.1 15.9 0.48
43.6 19.7 3.1 21.9 20.4 9.1 0.72 21.7 15.6 0.47
25.6 21.3 2.1 4.7 21.7 8.2 0.72 20.9 15.0 0.45
32.1 20.8 1.8 10.3 21.6 7.9 0.72 21.8 15.7 0.47
40.8 43 6 15.9 43 6.8 0.67 24.9 16.7 0.50
34.5 45 3.3 11.8 45 4.6 0.66 22.7 15.0 0.45
23.8 46 4.2 0.6 46 5.1 0.66 23.2 15.3 0.46
50.1 46 5.1 28.2 46 6.0 0.66 21.9 14.5 0.43
66.0 45 6.0 37.8 45 6.5 0.66 28.2 18.6 0.55
42.8 46 6.2 18.6 46 6.8 0.66 24.2 16.0 0.48
38.1 45 3.8 15.9 46 4.7 0.66 22.2 14.7 0.44
45.7 45 4.2 21.5 45 5.0 0.66 24.2 16.0 0.48
49.7 46 5.1 26.0 46 5.9 0.66 23.7 15.7 0.47
37.2 44 4.1 14.4 45 5.2 0.66 22.8 15.1 0.45
52.8 46 4.8 28.6 46 5.7 0.66 24.2 16.0 0.48
50.0 43 3.1 25.1 44 4.0 0.67 24.9 16.7 0.50
41.1 44 5.1 19.2 45 5.9 0.66 21.9 14.5 0.43
28.3 45 5.7 6.1 46 6.6 0.66 22.2 14.7 0.44
27.7 44 4.6 4.9 45 5.5 0.66 22.8 15.1 0.45
32.3 46 4.2 8.6 46 5.0 0.66 23.7 15.7 0.47
37.1 44 3.1 14.9 44 4.1 0.66 22.2 14.7 0.44
29.9 45 4.3 6.7 46 5.2 0.66 23.2 15.3 0.46
42.3 46 3.1 18.6 46 4.0 0.66 23.7 15.7 0.47
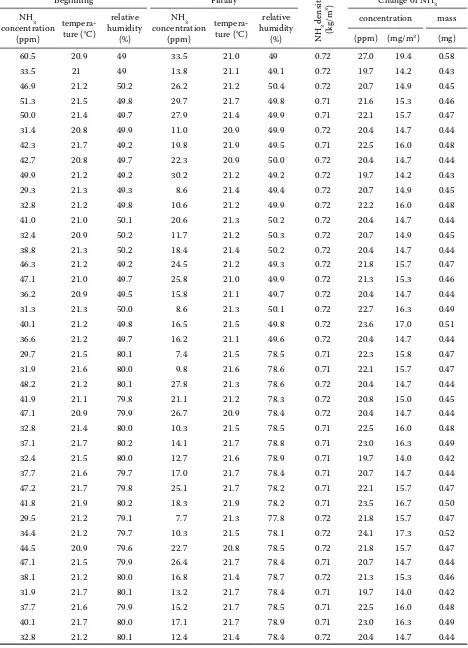
Table 2. Reaction NH3-O3 in the air with high relative humidity of gas in the vessel with a capacity of 30 l
Beginning Finally
NH
3
density
(kg/m
3)
Change of NH3
NH3 concentration
(ppm)
tempera-ture (°C)
relative humidity
(%)
NH3 concentration
(ppm)
tempera-ture (°C)
relative humidity
(%)
concentration mass
(ppm) (mg/m3) (mg)
60.5 20.9 49 33.5 21.0 49 0.72 27.0 19.4 0.58
33.5 21 49 13.8 21.1 49.1 0.72 19.7 14.2 0.43
46.9 21.2 50.2 26.2 21.2 50.4 0.72 20.7 14.9 0.45
51.3 21.5 49.8 29.7 21.7 49.8 0.71 21.6 15.3 0.46
50.0 21.4 49.7 27.9 21.4 49.9 0.71 22.1 15.7 0.47
31.4 20.8 49.9 11.0 20.9 49.9 0.72 20.4 14.7 0.44
42.3 21.7 49.2 19.8 21.9 49.5 0.71 22.5 16.0 0.48
42.7 20.8 49.7 22.3 20.9 50.0 0.72 20.4 14.7 0.44
49.9 21.2 49.2 30.2 21.2 49.2 0.72 19.7 14.2 0.43
29.3 21.3 49.3 8.6 21.4 49.4 0.72 20.7 14.9 0.45
32.8 21.2 49.8 10.6 21.2 49.9 0.72 22.2 16.0 0.48
41.0 21.0 50.1 20.6 21.3 50.2 0.72 20.4 14.7 0.44
32.4 20.9 50.2 11.7 21.2 50.3 0.72 20.7 14.9 0.45
38.8 21.3 50.2 18.4 21.4 50.2 0.72 20.4 14.7 0.44
46.3 21.2 49.2 24.5 21.2 49.3 0.72 21.8 15.7 0.47
47.1 21.0 49.7 25.8 21.0 49.9 0.72 21.3 15.3 0.46
36.2 20.9 49.5 15.8 21.1 49.7 0.72 20.4 14.7 0.44
31.3 21.3 50.0 8.6 21.3 50.1 0.72 22.7 16.3 0.49
40.1 21.2 49.8 16.5 21.5 49.8 0.72 23.6 17.0 0.51
36.6 21.2 49.7 16.2 21.1 49.6 0.72 20.4 14.7 0.44
29.7 21.5 80.1 7.4 21.5 78.5 0.71 22.3 15.8 0.47
31.9 21.6 80.0 9.8 21.6 78.6 0.71 22.1 15.7 0.47
48.2 21.2 80.1 27.8 21.3 78.6 0.72 20.4 14.7 0.44
41.9 21.1 79.8 21.1 21.2 78.3 0.72 20.8 15.0 0.45
47.1 20.9 79.9 26.7 20.9 78.4 0.72 20.4 14.7 0.44
32.8 21.4 80.0 10.3 21.5 78.5 0.71 22.5 16.0 0.48
37.1 21.7 80.2 14.1 21.7 78.8 0.71 23.0 16.3 0.49
32.4 21.5 80.0 12.7 21.6 78.9 0.71 19.7 14.0 0.42
37.7 21.6 79.7 17.0 21.7 78.4 0.71 20.7 14.7 0.44
47.2 21.7 79.8 25.1 21.7 78.2 0.71 22.1 15.7 0.47
41.8 21.9 80.2 18.3 21.9 78.2 0.71 23.5 16.7 0.50
29.5 21.2 79.1 7.7 21.3 77.8 0.72 21.8 15.7 0.47
34.4 21.2 79.7 10.3 21.5 78.1 0.72 24.1 17.3 0.52
44.5 20.9 79.6 22.7 20.8 78.5 0.72 21.8 15.7 0.47
47.1 21.5 79.9 26.4 21.7 78.4 0.71 20.7 14.7 0.44
38.1 21.2 80.0 16.8 21.4 78.7 0.72 21.3 15.3 0.46
31.9 21.7 80.1 13.2 21.7 78.4 0.71 19.7 14.0 0.42
37.7 21.6 79.9 15.2 21.7 78.5 0.71 22.5 16.0 0.48
40.1 21.7 80.0 17.1 21.7 78.9 0.71 23.0 16.3 0.49
to, Japan). Th e measuring equipment (Fig. 4) is a part of a diagnostic vehicle, which is being admin-istered by the State Medical Institute, Prague. Th e measuring equipment operates on the principle of UV light absorption, supported by the Cross-Flow modulation technique. Th is technique minimizes any possible fl uctuation of the zero, it assures the long-term stability of the measurements and allows the measurement to be highly sensitive. Th e tech-nician uses the heated container to produce the referenced gas by the decomposition of the O3 in the sample. Th is causes some limited interference as well as a higher resistance against the presence of humidity in the sample. Th e range of the meas-urements is 0–100/200/500/1000 ppb (e.g. approx-imately up to 2 mg/m3). Th e reproducibility of the
measurements is 1% of the full deviation, threshold of detection is 0.3 ppb.
Th e process of the measurements was as follows. A tedlar bag of volume 47 l was fi lled with technical air. 1 ml of ozone-rich air from the ozone generator was added. Th e ozone generator was set to produce ozone in the intensity No. 10 with the fl ow amount of 1.5 l/minute. Once set, the air was let go into the measuring equipment Horiba. Th e confi rmed ozone concentration was in the range of 33 to 35 μg/m3. Out of that, the calculated ozone
con-centration in the exit area of the ozone generator with 1.6 g/m3, plus minus 5%. Th is process was
re-peated three times with the same results. Next, the amount of added ozone air was increased to 3 ml. Th e resulting concentration in the bag was deter-mined to be 103 to 106 μg/m3.
RESULTS AND DISCUSSION
Th e results of the reduction of concentration of ammonia by adding ozone (as measured at vari-ous temperature levels of gas), are shown at Table 1. In all cases, dry ozone-rich air was being added with ozone concentration of 1.6 g/m3 during one minute, e.g. total of 2.4 mg of ozone. Table 1 shows the amount of ammonia reacting with 2.4 mg of ozone. Th e confi rmed amounts are in the range of 0.43 to 0.55 mg; mid value with temperature level of 21 1°C is 0.46 mg with standard deviation of 0.016 mg. For temperature level of 44.5 1.5°C then 0.46 mg with standard deviation 0.028 mg. In comparison with the Eq. (1) it is clear that the ratio O3:NH3 here is lower – 5.2:1. However, for practical applications, it is relatively satisfactory.
Next, the infl uence of relative humidity of the gas on the mass ratio of O3 and NH3 during the reac-tion was being investigated. Th e results are shown in Table 2. Th e amount of ammonia, which reacts with 2.4 mg of ozone is according to Table 2 simi-lar as during the reaction in the environment with a very low relative humidity (Table 1). Th e con-fi rmed amounts are in the range of 0.42 to 0.58 mg, the mean value for relative humidity of 50% being 0.46 mg with standard deviation of 0.034 mg, for rel-ative humidity of 80% being 0.46 with standard de-viation of 0.026 mg. Ratio O3:NH3 being again 5.2:1.
CONCLUSIONS
Th e measurements confi rmed the mass ratios in the reaction of O3 and NH3 within the gas environ-ment. Th e ratio of the reacting materials is 5.2:1. A possibility of an error in this ratio depends on the exactness of the measurements of the reacting ammonia, e.g. with the maximum of the standard deviation, as well as an error in the measurements of the amount of the ozone, which depends on the exactness of the measuring apparatus and the error of the measurements itself, total of 10%. Th e en-tire possible error in determining the mass ratios is therefore under 15%.
Ammonia is the most important gas pollutant in livestock buildings. Its elimination or possible signifi cant reduction of its concentration by ozone technologies is one of the perspective trends of technical development. Th e result is either a direct improvement of stable environment, or reduction of negative impact of animal production on the living environment. Knowledge of the required amount of added ozone is the necessary assumption for design and project of ozonizing device. When using ozone technology, it is possible to install the source of ozone into the entire of air-conditioning system. In this case, ozone works for improvement of the quality of air in the area of animal husbandry. Here, it is necessary to watch carefully the permit-ted limits of O3 throughout the interior. In the sim-ple case, the sources of ozone can be installed in the outlet pipe of the air conditioning system. It leads to the elimination of ammonia emissions into the surrounding area.
Corresponding author:
Ing. Petr Hutla, CSc., Research Institute of Agricultural Engineering, Drnovská 507, 161 01 Prague-Ruzyně, Czech Republic
phone: + 420 233 022 238, fax: + 420 233 312 507, e-mail: petr.hutla@vuzt.cz
stable environment. It was also confi rmed especial-ly for the practical working applications, that the mass ratios of the particles of O3 and NH3 are not dependent during this reaction on the relative hu-midity either on the air temperature of the gas, in which this reaction proceeds.
R e f e r e n c e s
Boeniger M., 1995. Use of ozone generating devices to improve indoor air quality. American Industrial Hygiene Association Journal, 56: 590–598.
Hoigné J., Bader H., 1978. Ozonization of water: Kinetics of oxidation of ammonia by ozone and hydroxyl radicals. Environmental Science & Technology, 12: 79–84. Hoigne J., 1998. Th e Handbook of Environmental Chemistry.
Vol. 5, Part 6, Quality and Treatment of Drinking Water II. Springer-Verlag,Berlin: 83–141.
Huston T., Hisatsune I.C., Heicklen J., 1983. Condensed-phase reactions of O3 with NH3 and NH2OH. Canadian Journal of Chemistry, 61: 2070–2076.
Keener K.K., Bottcher R.W., Munilla R.D., Van Wick-len G.L., 1999. Field evaluation of an indoor ozonation system for oder control. In: ASAE Annual International Meeting, July 18–21, 1999. Toronto: 1–14.
Olszyna K., Heicklen J., 1972. Th e reaction of ozone with ammonia. Advances in Chemistry, 113: 191–210. Solomon I. J., Hattori K., Kacmarek A.J., Platz G.M.,
Klein M.J., 1962. Ammonium ozonide. Journal of the American Chemical Society, 84: 34–36.
Strecker W., ThienemanN H., 1920. Über die Einwirkung von Ozon auf die Alkalimetalle, Ammoniak und Substitu-tionsprodukte des Ammoniaks (About the eff ect of ozone on the alkali metals, ammonia and substitution products of ammonia). Berichte der deutschen chemischen Gesells-chaft (A and B Series), 53: 2096–2113.
Wikipedia, 2010. Ozone. Available at http://en.wikipedia. org/wiki/Ozone (accessed March 12, 2010).