Effect of Sn Addition on the Mechanical and Electrical Properties
of Cu–15%Cr
In-Situ
Composites
Shigeki Skai
1, Hirowo G. Suzuki
2;*, Kuniteru Mihara
1and Jusheng Ma
3 1THE FURUKAWA ELECTRIC CO. LTD., Nikko 321-1493, Japan 2Japan Science Promotion Society, Tokyo 102-8471, Japan 3Tsinghua University, Beijing 100084, P.R. China
Effect of Sn addition on the mechanical and electrical properties of Cu–15%Crin-situcomposites has been studied. The addition of 0.1%Sn is effective for the solid solution hardening. Accumulation of high density of dislocations and development of banding structure by cold drawing give the increment of tensile strength. The precipitation of Cr in cupper matrix was accelerated and distinct secondary hardening occurs after cold rolling and aging treatment. It was found that the tensile strength of 1100 MPa with electrical conductivity of 70%IACS were attained in the Cu–15%Cr–0.1%Sn by the optimization of thermomechanical processing.
(Received July 8, 2002; Accepted December 6, 2002)
Keywords: Cu alloy, high strength, electrical conductivity, Cr, composite
1. Introduction
Cu basein-situcomposites have superior characteristics of high strength with high electrical conductivity (EC). The alloys having the tensile strength of more than 1000 MPa with ECof more than 70%IACS have been developed.In-situ
composites mean that the alloying elements having small solubility solidify dendritically by themselves in the Cu matrix during cooling from the melt and exist as a fiber or ribbon-like second phase in the Cu matrix after hot or cold rolling. Extensive studies have been carried out on Cu base
in-situcomposites such as Cu–(Fe,Cr,Si),1)–Fe,2–4)–Mo,2,5) –Ag,6–9)–Cr.2,3,10)Among them, Cu–15%Ag8,9)alloy is the best combination of strength and ECand thus in practical use for coil of strong magnetic generator except production cost. We have invented economical Cu–15%Cr (15Cr) binary alloy11)(strength level is 900 MPa and ECof 75%IACS and Cu–15%Cr–0.15%Zr (15CZ) and/or 0.2%Ti (15CT) ternary alloys,12,13)which have the strength level of 1150 MPa and EC of 70%IACS. Very fine precipitates of Cr, Zr and/or Ti were accelerated by the cold rolling and aging treatment. One of the weak point is that Ti and Zr are very active elements, so some difficulty exist in the melting process.
In this report, the effect of alloying of Sn is studied aiming to get high strength with high ECand lower production cost. Sn is a solid solution hardener of Cu matrix and is very popular element for dilute Cu alloys, but no research on the behavior in the 15Crin-situcomposites.
2. Experimental Procedure
Four nine level of pure Cu, Cr, Fe blocks, and Cu–30%Sn master alloy were prepared and vacuum induction melted under the pressure of2102Pa. The melting temperature
is 1800 K. The size of4545120mm3and 2 kg weighing ingots were produced. The chemical compositions of these alloys were tabulated in Table1. 15C1S denotes Cu–15%Cr–
[image:1.595.305.549.342.564.2]0.1%Sn and 15C5S means Cu–15%Cr–0.5%Sn. Reference alloys are called as 15Cr(Cu–15%Cr). The procedure for the sample preparation was schematically shown in Fig.1. The ingots were hot-forged at 1173 K with the reduction of¼ 1:4to break down the cast structure and then solution treated at 1273 K for 1 h, followed by water quenching to room temperature. The test coupons were sliced into a cross section of 400 mm2to 1 mm2 and cold rolled using rolling mill and roller dice to produce wire specimens having various drawing strainof 0 to 6.9. After cold rolling, wire specimens were subjected to the aging treatment in the range from 623 K to 1023 K for 1 h (STCA specimens, solution treatment-cold rolling-aging). STCindicates the specimens subjected to the solution treatment and cold rolling. STA specimens mean solution treatment and direct aging.
Table 1 Chemical compositions of the alloys.
(mass%)
C r Sn C a Al Fe C u
15C1S 15.02 0.095 0.002 <0:001 <0:001 Bal. 15C5S 15.05 0.498 0.002 <0:001 <0:001 Bal.
Melting and casting VIM, Casting at 1823K
Hot forging 1173K, =1.4(R.A.=75%)
Solution treatment 1273K − 1hr W.Q.
Cold drawing =0 6.9(R.A.=0 Final diameter =1.0 / 0.7mm
Solution treatment 1273K − 1hr W.Q. Aging
623 1023K − 1hr
Aging
623 1023K − 1hr
STA specimen
STC specimen STCA specimen
Aging 99.9%) η
η
Fig. 1 Schematic presentation of thermomechanical processing of Cu–Cr
in-situcomposites.
*Present address: Tsinghua University, Beijing 100084, P.R. China.
Microstructural examination was done by optical micro-scopy, SEM (JSM-6100) and TEM (JEM-2000FX) attached by EDX analyzer. Thin foils were prepared by twin jet polishing using an electrolyte of phosphoric acid plus methanol. Thin foils were electrolytically polished under the condition of liquid nitrogen temperature at 10 V and 0.1 A and followed by ion milling for 10 min at 293 K and 3 kV. EC of wire specimens was measured by four point terminal method in a thermostatic bath at 293 K. It was then calculated as an average of two measurements with the polarity reversed on the terminals 200 mm apart.
3. Experimental Results
3.1 Microstructure
Cast structure consists of Cr dendrite and Cu matrix (Fig.2). This Cr dendrite was extracted by chemical etching with HNO3and is chemically analyzed as shown in Table 2.
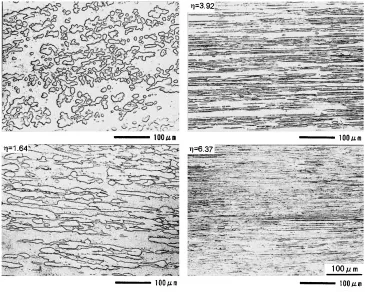
Half content of the alloying Sn is partitioned into Cr phase in 15C1S and 31% of Sn is into Cr phase in 15C5S alloy. It is also noted that impurity elements such as Fe and Care scavenged into Cr phase. Microstructural change by cold drawing is shown in Fig. 3. Dendritic Cr deforms into rolling direction and fine lamellar structure is formed after heavy deformation such as ¼6:37, resulting in the two phase composite.
3.2 Cold drawing
Figure 4 shows both the Cr lamellar spacing (d) and thickness of Cr lamellar (t) against cold drawing strain. The measurement was done at the cross section parallel to the
rolling direction. Maximum drawing strain was¼6:37and
d was 0.8mm, where fracture occurred by shearing the Cr lamellar. The relation oftanddwithis derived by the least square fitting method as follows;t¼3:25 expð0:29Þ,d¼ 12:04 expð0:45Þ for 15C5S and t¼7:58 expð0:42Þ,
d¼7:18 expð0:31Þfor 15C1S. The square shape data in
[image:2.595.314.541.71.225.2]Fig. 2 Cast structure of Cu–15%Cr–0.1%Sn alloy.
Table 2 Chemical compositions of Cr phase extracted from the Cu–Cr–Sn alloys.
(mass%)
Sn Cu Fe C S Cr
15C1S 0.31 0.27 0.012 0.012 <0:001 Bal. 15C5S 1.02 0.32 0.011 0.007 0.002 Bal.
[image:2.595.303.548.304.345.2] [image:2.595.115.480.477.771.2]this figure is for 15Cr, which indicates the lamellar spacing of two Sn doped alloys is coarser than that of binary alloy. One reason for this is due to the initial coarse dendrite structure of Sn doped alloys.
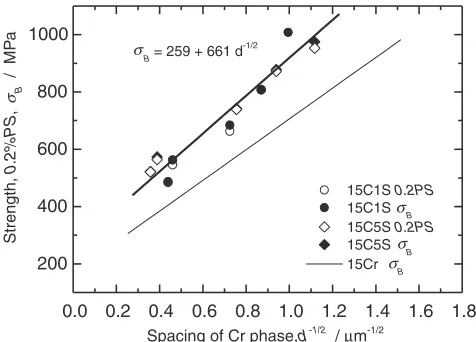
Figure 5 shows the relation between macrohardness and drawing strain. Hardness shows sharp increase in the early stage of straining and then gradually increases with drawing strain until¼6:37(maximum strain). The change of tensile strength was shown in Fig.6. This result shows more clearly the beneficial effect of Sn addition. The increase of the strength is evident even in 15C1S, low Sn addition. The maximum strength attained is 1000 MPa in 15C1S. 0.2%PS and tensile strength were plotted as a function of lamellar spacing d (Fig.7), which shows the linear relationship between strength and d1=2 suggesting Hall-Petch like
relationship exists in this cold rolled alloys as already discussed.11–13)
3.3 Effect of aging
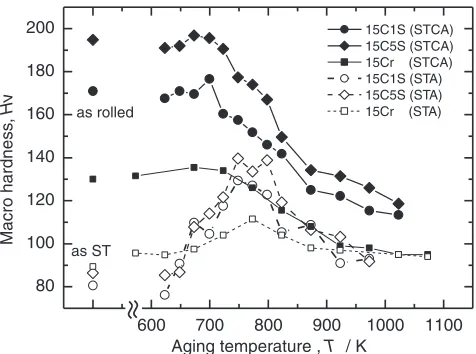
Figure8 shows the hardness change with aging tempera-ture, where open circle and open square data are STA treated ones and solid circle and solid square data are from the STCA (cold rolled and aged). Both results of STA and STCA clearly show that there exists the secondary hardening due to the precipitation and peak temperature lies around 750 K. On the other hand, in the STCA process, peak hardness is shifted to lower temperature around 700 K and peak hardness reached to 200 Hv due to the acceleration of precipitation on the defects introduced by cold drawing. It is evident from these data that the addition of Sn to Cu–15%Cr is effective to increase the hardness. The result for the tensile strength against aging temperature is shown in Fig. 9. These values are unexpectedly low ones in view from the hardness value. The actual strength level can be higher than this. This point will be discussed later.
The data for ECagainst aging temperature is shown in Fig.10. It is noted that ECrecovers from the beginning of aging treatment and increases with the increment of aging temperature, reaching maximum around 800 to 900 K and then goes down again. This behavior corresponds to the
0 1 2 3 4 5 6 7 8
1 10
15C1S d
15C1S t
15C5S d
15C5S t
15Cr d 15Cr t
Spacing and thic
kness of Cr phase
,
d,t
/
µ
m
Drawing strain , η
Fig. 4 Effect of drawing strain on spacing (d) and thickness (t) of Cr phase in Cu–15%Cr–0.1%Sn (15C1S), Cu–15%Cr–0.5%Sn (15C5S) and Cu– 15%Cr (15Cr).
Fig. 5 Effect of drawing strain on macrohardness in 15C1S, 15C5S and 15Cr.
Fig. 6 Relation between tensile strength and drawing strain in 15C1S, 15C5S and 15Cr.
0.0 0.2 0.4 0.6 0.8 1.0 1.2 1.4 1.6 1.8 200
400 600 800 1000
B = 259 + 661 d
-1/2
15C1S 0.2PS 15C1S
B
15C5S 0.2PS 15C5S B 15Cr
B
Strength,
0.2%PS
,
B
/ MP
a
Spacing of Cr phase,d-1/2 / µm-1/2 σσ
σ σ
σ
[image:3.595.51.289.59.254.2] [image:3.595.308.546.72.243.2] [image:3.595.307.545.301.472.2] [image:3.595.50.289.324.520.2]precipitation and re-solutioning of Cr precipitates in Cu matrix and quite similar characteristics with those of already reported ones.14,15)It is noted that aging temperature giving the ECmaximum is the overaging region, where the strength goes down.
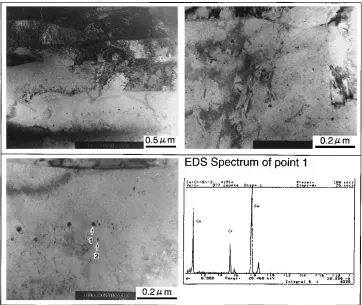
Microstructure at the aging temperature corresponding to the peak hardness, 698 K, high density of dislocations (Fig.11, top left), banded structure (Fig.11, top right) and fine precipitates on the dislocations and in the matrix (Fig.11
bottom left) were observed. These precipitates were deter-mined as Cr by EDSin-situanalysis and there was no signal corresponds to Sn (Fig.11, bottom right). Figure12 is the TEM micrographs taken after being aged at 873 K for 1 h, at the stage of overaged condition. Top left of Fig.12 is low magnification. Top right and bottom left figures are high magnifications showing Cr precipitates in the Cu matrix and bottom right is the result of EDX analysis showing Cr signal from Cr precipitates.
4. Discussion
4.1 Effect of Sn addition to Cu–15%Crin-situcomposite
As was expected from the conventional Cu–Sn alloys (bronze), the addition of Sn in Cu–15Crin-situcomposites is effective to increase the strength of cold rolled as well as aged specimens. In the cold rolled specimens, solid solution of Sn retards the dynamic recrystallization of Cu matrix, leading to the high density of dislocations as shown in Fig.11. Because the strength of cold rolled specimens follows Hall-Petch type equation, it is important to refine the Cr lamellar spacing by cold rolling. It was not realized in this experiment, but if the cast structure becomes finer, the lamellar spacing can be refined more. Also, coarse dendritic structure gives rise to the heterogeneity of rolling strain leading to the localization of strain resulted in the limitation of cold drawability.
In the aged specimens, it is quite clear from Fig.8that the precipitation of Cr in Cu is accelerated by the addition of Sn. The precipitates such as Cu3Sn (" phase) or Cu41Sn11 (
phase) was not detected because the solubility of Sn is large even in the low temperature (ex, Sn solubility in Cu is 11 mass% at 573 K16)). Therefore, it is suggested that the solubility of Cr in cupper matrix at lower temperature is limited by Sn addition which promotes the precipitation of Cr. Higher content of Sn gives higher strength for the cold rolled and aged specimens, but ECdecreases to some extent. So, it is preferable to add 0.1 to 0.2 mass% of Sn in the Cu– 15%Crin-situcomposites to get high strength with high EC.
4.2 The strengthening mechanism
The factors governing the overall strengthening are high density of dislocations, banded structure of cupper matrix, spacing of Cr lamellar phase, which acts as barrier for the dislocation motion, and precipitation of Cr in the cupper matrix. Sun et al.17) has discussed in details on the strengthening of the Cu–Cr in-situ composites and derived the following equation as the model of strengthening.
600 700 800 900 1000 1100
80 100 120 140 160 180
200 15C1S (STCA)
15C5S (STCA) 15Cr (STCA) 15C1S (STA) 15C5S (STA) 15Cr (STA)
as ST as rolled
Macro hardness
,
Hv
Aging temperature , T / K
Fig. 8 Effect of aging temperature on the macrohardness of STCA specimens in 15C1S, 15C5S and 15Cr. Drawing strain is ¼5:3 for 15C1S, 15C5S and¼5for 15Cr.
600 700 800 900 1000 1100 200 300 400 500 600 700 800 900 1000 1100
STCA 15C1S 0.2PS 15C1S σ
σ
σ
B
15C5S 0.2PS
15C5S σB 15Cr B
Strength,
0.2%PS
,
B
/ MP
a
As rolled
Aging temperature ,T / K
Fig. 9 Effect of aging temperature on 0.2%PS and tensile strength of STCA specimens in 15C1S, 15C5S and 15Cr. Drawing strain is¼5:3
for 15C1S, 15C5S and¼5for 15Cr.
[image:4.595.51.289.70.247.2] [image:4.595.50.285.316.500.2] [image:4.595.50.290.568.748.2]Fig. 11 TEM bright field images and EDS spectrum of the STCA specimen in 15C1S alloy.¼5:3and aged at 698 K for 1 h (peak hardness condition).
[image:5.595.117.479.432.737.2]C¼T0þkd1=2 ð1Þ
T0¼VCuðCu0 þA" n
CuÞ þVCrðCr0 þB" n
CrÞ ð2Þ
Here, VCu, VCr are volume fraction of each phase. d is Cr
lamellar spacing.
AandBare constant and n is strain hardening exponent. This equation has described well in the case of cold rolled specimens. However, it is necessary further to modify this equation in the case of cold rolled and aged specimens. Because, the precipitates nucleated on the vacancies and dislocations contributes to the strengthening to great extent as seen in Fig.8, while work hardening term in the eq. (2) tends to decrease.
4.3The relation between the strength and hardness
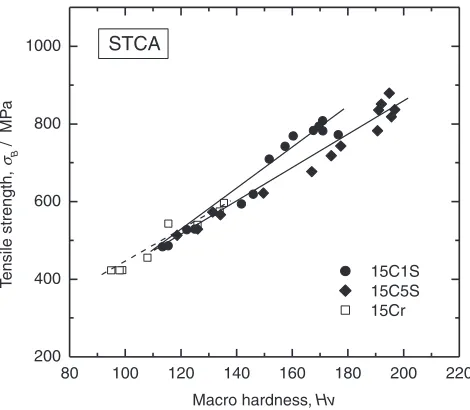
It is generally accepted the linear relation between the tensile strength (usually 0.2%PS is also true) and hardness. Figures 13 and 14 show the results for STCand STCA specimens in the 15C1S, 15C5S and 15Cr alloys. If one pays
attention to the data for STCof 15C1S, tensile strength is given as a function of hardness as in the following:
B¼11.3 Hv930. From this figure and equation, the
tensile strength of B¼1000MPa corresponds to 170 Hv.
On the other hand, in the STCA specimens of 15C1S, the tensile strength of B¼5.5 Hv150 is derived. Tensile
strength (B) of STCA is less sensitive to the hardness, leading to the lower strength even having higher hardness for peak age hardened stage (Fig.9). One of the reasons for this is that the cracking tendency becomes higher when tensile tested, resulted in the lower tensile strength due to the lower yield fracture.
Biselli4) is discussing the difference between the 0.2%PS and tensile strength for tensile test and compression test to elucidate the elastic residual strain introduced by the heavy cold drawing in thein-situcomposite Cu–Fe alloy. It shows that 0.2%PS in the tensile test is higher than that of compression test in the range of drawing strain less than 4.5 because of elastic residual strain (compression strain), but if the drawing strain is higher than 4.5 or at the tensile strength level, the difference becomes negligible small. This argument does not apply in the present case. If one can extrapolate Hv of the STCA data (Fig.14) to STCresult (Fig.13), tensile strength of the STCA becomes 1000 MPa for 15C1S and 1250 MPa for 15C5S alloy. This point is meaningful to conduct further research.
4.4 The relation between EC and tensile strength
[image:6.595.51.286.543.748.2]In order to see the optimum process condition giving the best combination of strength and EC, experimental data was summarized in Fig. 15for the three alloys, 15C1S, 15C5S and 15Cr. The region, where hardness over 160 Hv corre-sponds to the tensile strength of more than 800 MPa and EC over 70%IACS, is the area of optimum processing condition. Best combination is cold drawing to ¼5:3 and aging at 698 K for 1 h which gives 180 Hv (tensile strength is 1100 MPa) and EC is 70%IACS in Cu–15%Cr–0.1%Sn (15C1S).
Fig. 13 Relation between tensile strength and macrohardness in the cold drawn 15C1S, 15C5S and 15Cr (STC specimens).
80 100 120 140 160 180 200 220
200 400 600 800
1000 STCA
15C1S 15C5S 15Cr
T
e
nsile strength,
B
/ MP
a
Macro hardness, Hv
σ
[image:6.595.305.545.552.736.2]Fig. 14 Relation between tensile strength and macrohardness of STCA specimens in 15C1S, 15C5S and 15Cr. Drawing strain is ¼5:3 for 15C1S, 15C5S and¼5for 15Cr.
Fig. 15 Relation between electrical conductivity and macrohardness of STCA specimens in 15C1S, 15C5S and 15Cr. Drawing strain is¼5:3
5. Conclusion
Effect of Sn addition on the mechanical and electrical properties has been studied. Main results are as follows. (1) Sn is effective to increase the strength of as-cold rolled
as well as aged specimens in Cu–15%Cr in-situ
composites.
(2) Sn acts as a solid solution hardener and retards the dynamic recrystallization of Cu matrix, resulted in high density of dislocations and banded structure. The addition of 0.5%Sn gives maximum tensile strength of 1000 MPa in the cold rolled stage.
(3) Sn addition accelerates the precipitation of Cr in Cu matrix.
(4) Electrical conductivity decreases sharply with the addi-tion of Sn.
(5) Optimum condition for having tensile strength of 1100 MPa and electrical conductivity of 70%IACS is cold drawing¼5:3and aging at 698 K for 1 h in the Cu–15%Cr–0.1%Snin-situcomposites.
Acknowledgements
Authors are indebted to Prof. M. Kato and his colleagues of Tokyo Institute of Technology for their stimulus discussions. The authors gratefully thank to the related members of NIMS, National Institute for Materials Science and NEDO, New Energy Development Organization of their financial support. This work was mainly done at NIMS under the contract with NEDO. They are also grateful to JSPS, Japan Science Promotion Society for her financial support of H. G. Suzuki’s staying in Beijing. This work was partially done in
Tsinghua University, which faculty members are greatly appreciated.
REFERENCES
1) Y. Umakoshi, M. Yamaguchi, T. Kondo and G. Mima: J. Japan Inst. Metals35(1971) 223–230.
2) P. D. Funkenbusch, T. H. Courtney and D. G. Kubisch: Scr. Metall.18
(1984) 1099–1104.
3) P. D. Funkenbusch and T. H. Courtney: Acta Metall.33(1985) 913– 922.
4) C. Biselli and D. G. Morris: Acta Metal. Mater.42(1994) 163–176. 5) T. Takeuchi, K. Togano, K. Inoue and H. Maeda: J. Less-Common Met.
157(1990) 25–35.
6) G. Frommeyer and G. Wassermann: Acta Metall. 23(1975) 1353– 1360.
7) G. Frommeyer: Phys. Chem.82(1978) 323–328.
8) Y. Sakai, K. Inoue, T. Asano, H. Wada and H. Maeda: Appl. Phys. Lett.
59(1991) 2965–2967.
9) Y. Sakai, K. Inoue, T. Asano and H. Maeda: J. Japan Inst. Metals55
(1991) 1382–1391.
10) J. D. Verhoeven, W. A. Spitzig, L. L. Jones, H. L. Downing, C. L. Trybus, E. D. Gibson, L. S. Chumbley, L. G. Fritzemeier and G. D. Schmittgrund: J. Mater. Eng.12(1990) 127–139.
11) K. Adachi, S. Tsubokawa, T. Takeuchi and H. G. Suzuki: J. Japan Inst. Metals61(1997) 397–403.
12) K. Mihara, T. Takeuchi and H. G. Suzuki: J. Japan Inst. Metals62
(1998) 238–245.
13) K. Mihara, T. Takeuchi and H. G. Suzuki: J. Japan Inst. Metals62
(1998) 599–606.
14) Y. Jin, K. Adachi, T. Takeuchi and H. G. Suzuki: Mater. Sci. Eng.
A212(1996) 149–156.
15) Y. Jin, K. Adachi, T. Takeuchi and H. G. Suzuki: Metal. Trans. A29A
(1998) 2195–2203.
16) T. B. Massalski:Binary Alloy Phase Diagram, 2nd ed.,Vol. 2 (1992) 1481, ASM Int.