ISSN Online: 1945-3108 ISSN Print: 1945-3094
Linking a Simulated Annealing Based
Optimization Model with PHT3D Simulation
Model for Chemically Reactive Transport
Processes to Optimally Characterize
Unknown Contaminant Sources in a
Former Mine Site in Australia
Bithin Datta
1,2*, Claire Petit
1,3, Marine Palliser
1,3, Hamed K. Esfahani
1, Om Prakash
41Discipline of Civil Engineering, College of Science and Engineering, James Cook University, Townsville, QLD, Australia 2CRC-CARE (Cooperative Research Centre for Remediation and Assessment of the Environment),
University of Newcastle, Callaghan NSW, Australia
3Water and Environment Program, Ecole Nationale Supérieure d’Ingénieurs de Limoges (ENSIL), Limoges, France 4Department of Civil and Environmental Engineering, I. I. T. Patna, India
Abstract
Historical mining activities often lead to continuing wide spread contami-nants in both groundwater and surface water in previously operational mine site areas. The contamination may continue for many years after closing down the mining activities. The essential first step for sustainable management of groundwater and development of remediation strategies is the unknown con-taminant source characterization. In a mining site, there are multiple species of contaminants involving complex geochemical processes. It is difficult to identify the potential sources and pathways incorporating the chemically reactive multiple species of contaminants making the source characterization process more challenging. To address this issue, a reactive transport simula-tion model PHT3D is linked to a Simulated Annealing based the optimum de-cision model. The numerical simulation model PHT3D is utilized for numer-ically simulating the reactive transport process involving multiple species in the former mine site area. The simulation results from the calibrated PHT3D model are illustrated, with and without incorporating the chemical reactions. These comparisons show the utility of using a reactive, geochemical transport process’ simulation model. Performance evaluation of the linked simulation optimization methodology is evaluated for a contamination scenario in a for-mer mine site in Queensland, Australia. These performance evaluation results
How to cite this paper: Datta, B., Petit, C., Palliser, M., Esfahani, H.K. and Prakash, O. (2017) Linking a Simulated Annealing Based Optimization Model with PHT3D Simulation Model for Chemically Reactive Transport Processes to Optimally Charac-terize Unknown Contaminant Sources in a Former Mine Site in Australia. Journal of Water Resource and Protection, 9, 432-454.
https://doi.org/10.4236/jwarp.2017.95028
Received: December 5, 2016 Accepted: April 17, 2017 Published: April 20, 2017
Copyright © 2017 by authors and Scientific Research Publishing Inc. This work is licensed under the Creative Commons Attribution International License (CC BY 4.0).
http://creativecommons.org/licenses/by/4.0/
illustrate the applicability of linked simulation optimization model to identify the source characteristics while using PHT3D as a numerical reactive chemi-cal species’ transport simulation model for the hydro-geochemichemi-cally complex aquifer study area.
Keywords
Groundwater Contamination, Source Characterization, PHT3D, Linked Simulation Optimization Methodology, Chemically Reactive Transport Simulation, Mine Site Contamination, Simulated Annealing
1. Introduction
Characterization of unknown contaminant sources is an essential first step for effective remediation and management of contaminated groundwater resources. Linked optimization methodologies are widely used for characterization of un-known groundwater contaminated source, in terms of flux magnitude, location and activity history in contaminated aquifers [1] [2]. Transport of contaminants comprising of multiple chemically reactive species, in contaminated groundwa-ter systems, is complex and highly non-linear process. Therefore, robust numer-ical simulation models incorporating chemnumer-ical reactions of the contaminant species in the transport process are necessary in linked simulation-optimization methodology. The purpose of the present study is to propose and evaluate a linked simulation optimization methodology, linking a multiple species’ reactive transport simulation model to an optimization model for unknown groundwater source characterization. The methodology is evaluated for a former mine site in Queensland, Australia involving multiple reactive contaminant species under-going complex geochemical reactions.
PHREEQE [3], a reactive, chemical transport model, is a widely used comput-er code using the two-step procedure for solution. Tebes-Stevensa, Valocchia [4]
developed a reactive transport simulation code (FEREACT) to investigate the chemical reaction-based transport for cobalt and EDTA (Ethylene Diamine Te-tra-acetic Acid) through an iron oxide-coated sand column. Prommer, Barry [5]
presented numerical computation results for both reactive and non-reactive chemical species transport in an aquifer site contaminated by hydrocarbons. They used the PHT3D [6] model, coupling the non-reactive part of MT3DMS
reactive chemical species in an aquifers, has also gained popularity in recent years [19] [20] [21] [22]. Wissmeier and Barry [23] presented a software tool for groundwater flow and transport movement in combination with geochemistry in two and three-dimensional systems. Their study coupled the reaction-based transport equations used in IPHREEQC [24], to the finite element method solver COMSOL [25] for the simulation of flow and transport processes in the form of a computer code. In this study, the PHREEQC/MT3DMS-based reactive multi- component transport model PHT3D [26] is used to simulate the reactive trans-port process and it is linked to Simulated Annealing (SA) based optimization algorithm to identify the optimal source characteristics.
Initial attempts for identifying the flux magnitude, location and activity dura-tion of unknown groundwater polludura-tion sources utilized linear optimizadura-tion mod-el based on linear response matrix approach [27] and statistical pattern recogni-tion [28]. Other methodologies proposed latter include: determining optimal es-timates of the unknown model parameters and source characteristics using non- linear maximum likelihood estimation based inverse models [29]; source identi-fication using embedded nonlinear optimization technique [30] [31] [32]; clas-sical optimization based approach [33]; Genetic Algorithm (GA) based optimi-zation approach [34] [35]; Artificial Neural Network (ANN) approach; heuristic harmony for source identification [36]; Simulated Annealing (SA); and Adaptive Simulated Annealing (ASA) based linked optimization algorithm for source iden-tification [1] [22] [37] [38] [39]; and differential evolution algorithm for ground- water source identification [40] [41]. Optimization techniques for solving source identification problems are reviewed in Chadalavada, Datta [42], Ketabchi and Ataie-Ashtiani [43] and Sreekanth and Datta [44].
A linked simulation optimization approach is implemented in the present stu- dy. This approach links multiple species reactive transport simulation model with SA based optimum decision model. Performance of its efficiency and reliability is evaluated for a contaminated aquifer site hydro-geologically representing an abandoned mine site in Queensland, Australia.
2. Methodology
processes in the contaminated aquifer. The flow simulation results are compared with field measurement data [45] to obtain acceptable calibration results based on measured flow data. In the second step, the simulation model is linked to Si-mulated Annealing (SA) optimization algorithm within a linked simulation-op- timization framework to obtain the optimal source characteristics in terms of location, flux magnitude and time of activity.
2.1. Simulation of Groundwater Flow and Physical Transport
The widely used three-dimensional numerical flow simulation model MODFLOW
[46] is used for simulation of the flow in the selected aquifer study area. The MODFLOW can simulate steady and transient flow. As several variables affect the groundwater flow, it is generally modelled by the spatial and temporal go-verning partial differential equations.
MT3DMS [7] is a modular three-dimensional transport model used to simu-late the transport process. It is capable of incorporating dispersion, advection, and chemical reactions of dissolved chemical species in groundwater systems. MT3DMS utilizes the flow simulation MODFLOW to compute the pollutants transport processes. In this study, MT3DMS is used for physical transport pro- cess. Equation (1) [47] represents the three-dimensional reactive transport pro- cess in groundwater systems:
( )
1 N s
ij i s k
k
i j i
q
c c
D v C C R
t x x x
θ
=
∂ = ∂ ∂ − ∂ + +
∂ ∂ ∂ ∂
∑
(1)where
C is the pollutant concentration (M∙L−3);
t is time (T);
xi is the Cartesian coordinate axis i (L);
Dij is the hydrodynamic dispersion coefficient tensor (L2∙T−1);
vi is the linear pore water or seepage velocity (L∙T−1);
qs is volumetric flux of water per unit volume of aquifer (positive for source
and negative for sinks (T−1));
Cs is the source or sinks concentration (M∙L−3);
θ is the porosity of the porous medium (dimension less);
Rk is the chemical reaction term representing each of the N species (M∙L−3∙T−1).
The multiple component multiple species reactive transport model PHT3D
[48] is utilized in this study or linking with the optimal source characterization
model. PHT3D combines MT3DMS and PHREEQC [49]. The PHREEQC
reac
c r t ∂ =
∂ (2)
1,
s i i
i n
C c Y s
=
= +
∑
(3)where
rreac is a source/sink chemical reaction rate term; c is the concentration (molar)
of the uncomplexed aqueous component, siis the concentration (molar) of the ith
complexed species, n is the number of dissolved chemical species t complexed with the aqueous component, s
i
Y is the stoichiometric coefficient of the aqueous
component in the ith complexed species.
2.2. Source Characterization Model Using Simulated
Annealing Algorithm
The evolutionary optimization algorithm Simulated Annealing (SA) [50] is used as the optimization algorithm for optimal solution of the contaminant source characterization model linked with PHT3D as the reactive transport simulation model. The SA is based on analogy with thermodynamics. The analogy is with the process of slowly cooling (annealing) molted metals to a state of low energy. The important features of SA which make it a potentially powerful optimization algorithm are: it can handle multiple optima and the algorithm can move uphill, thus escaping from local optima to find global optima. The capability of SA for convergence to a global optimal solution in complex, multivariate problems in-volving higher degree non-linear functions makes it an ideal choice for solving unknown groundwater pollution source characterization problems.
In the search process of the SA algorithm, a random nearby solution is re-placed utilizing the probability depending on the difference between the corres-ponding function values and algorithm control parameters (initial temperature, temperature reduction rate, etc.). Here, SIMANN a FORTRAN code developed by [51] is utilized as the optimization algorithm.
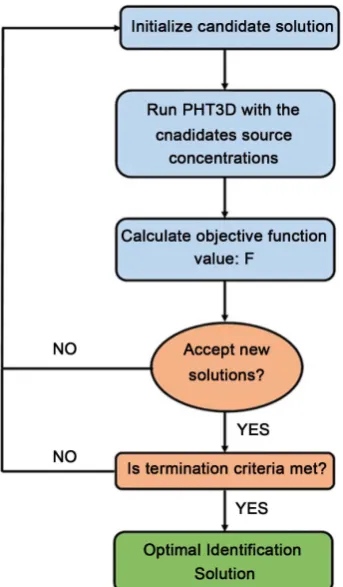
A new linked simulation optimization model linking SIMANN, the SA based optimization algorithm with reactive transport simulation model (PHT3D) is developed for this study. Figure 1 shows the schematic linking of the reactive transport simulation model (PHT3D) with the SA based optimization model in a linked simulation-optimization framework. The reactive transport simulation model PHT3D utilizes the flow field simulated by MODFLOW.
In order to achieve computational efficiency, the SA algorithm parameters need to be suitably specified. The SA parameters needed to be specified include the following:
The initial temperature (T);
The error tolerance for termination (called EPS); The temperature reduction factor (RT).
The objective function of the optimal source characterization model can be described as [38] [39]:
(
)
1 1
Minimize 1 Abs .
k ob n n
k k
est iob obsiob k job
F C C
= =
Figure 1. Representative flowchart of the linked simulation-optimization model using si- mulated annealing algorithm.
Subject to the implicit constraints defining the simulation model of the flow and reactive transport processes [38],
where
Abs is the absolute difference; k
est iob
C
is the estimated concentration simulated by the transport model at monitoring point iob and at end of the time period k (mole/L);nk is the number of time steps for monitoring;
nob is the total number of monitoring points;
k obsiob
C
is the observed concentration at monitoring location iob and at the end of the period k (mole/L).3. Performance Evaluation
Performance of the proposed source characterization methodology is evaluated for a polluted aquifer study area hydrogeologically resembling the Mount Mor-gan, a former mine site in Queensland, Australia. The hydrogeological and geo-chemical parameters for the study area is obtained from previous studies [Esfa-hani and Datta 22; Wels and Findlater 45].
3.1. Polluted Aquifer Site Description
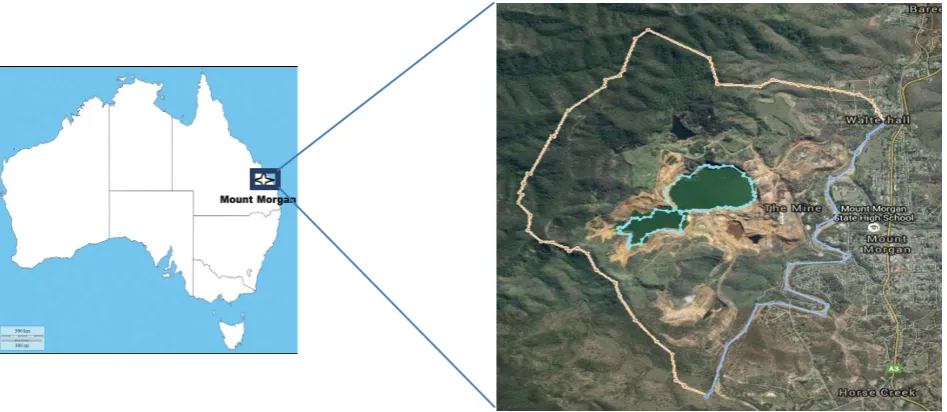
geolo-gy of Mount Morgan mainly constitute of volcanic and metamorphic rocks (quartz, feldspar, basalt etc.). Mount Morgan mine site was operational for a pe-riod close to 100 years starting 1889 till 1990. It was once a large mine located in Queensland, Australia (Figure 2). It is surrounded by Dee River on the down-stream of the mine site which flows into the Fitzroy River. The ground topogra-phy generally slopes from north east towards the river in south. Gold, silver, and copper ores were primarily mined during its operational life time.
The climate at the site show seasonal variation with average maximum monthly temperatures ranging from 32˚C in January to 23.1˚C in July. The average an-nual rainfall is approximately 815.5 mm of which a large portion is received during the wet season from November until March. During the winter season the average rainfall is in between 22 and 43 mm, while, from October to March, the rainfall may exceed 100 mm [53].
Hazardous contaminants which mainly remain buried deep in the earth’s crust are exposed to the atmosphere due to open cuts, waste deposits from the ore and the created tailing dams. These hazardous compounds travel through the drai-nage path and contaminate the groundwater as well as surface water in the vi-cinity of the mine site. Once these hazardous contaminants and their compo-nents interact with water (in from of rainfall or get collected in the tailings dam as a result of overland flow), generate Acid Rock Drainage (ARD) and Acid Mine Drainage (AMD). Although several remediation measures were underta-ken for this area, accurate contaminant sources characterization of ARD and AMD, physical and chemical behaviors of the contaminants in the groundwater system all along the transport pathway are required to achieve effective and effi-cient remediation strategies, and for optimal groundwater management.
[image:7.595.64.538.508.714.2]During the early 1900s there was little or no environmental regulation. Heigh- tened mining activities with no environmental regulations have left a legacy of impacts on the Dee River and the site itself. The current environmental pollution
can possibly be attributed to acid and metalliferous drainage also known as acid mine drainage. Such pollution occurs when sulfidic rocks, such as pyrite, are exposed to atmospheric water and oxygen rather than being isolated as crystal-line rock underground [54]. This exposure leads to the formation of sulfuric ac-id, which in turn dissolves high concentrations of salts and hazardous materials, such as copper, arsenic, nickel, cadmium, zinc, aluminum, iron and many more. Acid mine drainage is a very toxic concoction of hazardous chemicals threaten-ing aquatic ecosystems and biodiversity [19]. Starting in 1982, tailings were dredged from Sandstone Gully and treated using the Carbon-In-Pulp (CIP) process for recovery of gold, before being backfilled into the open cut. After final closure in 1990, the partially backfilled open cut (and Sandstone Gully) were al-lowed to flood by natural inflows (surface runoff and groundwater inflow) [54].
A major part of the waste rock deposit from the open cut is acid-forming as it contains up to 10% sulphur with sulphide minerals such as pyrite (FeS2, also
called fool's gold). The term “Mundic” describes a copper ore that begins to melt. Historically, the Mundic tailings were placed into Mundic Creek drainage chan-nel and the other tailings were placed into tailing dams. Geochemical tests car-ried out [55] show that the Mundic Red tailings were unreactive whereas the Mundic Grey tailings are highly reactive releasing sulphate ( 2
4
SO −), iron (Fe),
aluminum (Al) and copper (Cu). If tailings were deposited without proper con-tainment, this would be a real environmental issue [54] [56]. Thus, it is evident that the mining activity at Mount Morgan throughout its period of operation produced many chemically reactive hazardous pollutants in large quantities leading to environmental pollution issues.
The major ore at the site is Devonian Mount Morgan Tonalite which is almost impermeable. Devonian rhyolitic volcanic depositshave provided Au-Cu mine-ralization. Permeability of the porous medium comprise of primary permeability resulting from the formation of rocks (mostly considered negligible in rock for-mations in Australia) andsecondary permeability controlled by the presence of faults and fractures in the rock strata. Compartmented dykes in the area causes groundwater discharge deeper into the mine site [56]. Mining activities for ex-tracting Pyrite ore mineral has resulted in large waste deposit comprising mainly of quartz–pyrite waste rocks. Sulphide oxidation, pyrite waste rock exposition, and also tailings at the site generate hazardous acidic and metal-rich drainage. The absence of carbonate rocks to naturalize groundwater pH has exacerbated this situation [57]. The geology of the site has been described in detail in [56] [58] [59].
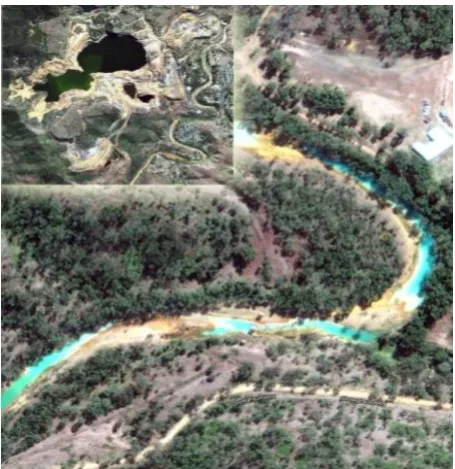
The high pH values as associated with AMD result in dissolution of metals (e.g., copper, iron, aluminum) in the water. As and when the pH value rises and become closer to neutrality, the dissolved metals precipitates leaving behind a yellow-orange substance or a light-blue substance as in Figure 3.
Figure 3. Acid mine drainage consequences in the dee river.
weathered bedrock; partially weathered bedrock; and tight bedrock. Groundwa-ter flow is simulated with specified hydrogeological parameGroundwa-ters as given in Table 1. An aerial view of the mine site is shown in Figure 4.
The flow model is calibrated against the available head data. The flow models were calibrated with the aim to assign proper head boundary conditions, and es-timate the spatially and temporally averaged recharge. The calibration was par-tially based on the earlier flow model calibration for the same study area as re-ported in [60]. The flow model was calibrated against limited and sparse meas-ured hydraulic head field data available for the site. Hydraulic head measure-ment data recorded between 2002 and 2003 [45] from 11 observation locations spread across the impacted area were used for model calibration. A portion of the average rainfall intensity per year is specified as recharge to the groundwater aquifer for calibration of the flow simulation model. Calibration targets were set to be within two meter intervals of the observed hydraulic head value with a confidence level of 90 percent. The model boundary conditions were manually adjusted based on best judgment of the existing boundary conditions, to achieve the calibration targets. Figure 5 shows the calibration results in form of box plots. More rigorous calibration can be undertaken if a large number of spati-otemporal field measurement data is available.
Figure 4. Open cut and dee river illustration at mount morgan site.
Figure 5. Flow simulation and calibration results [21].
Table 1. Hydrogeologic parameters used in flow and transport models of the study area
[21].
Parameters Unit Values
Length of study area m 4000
Width of the study area m 4000
Saturated thickness m variable
Grid spacing in x direction m 40
Grid spacing in y direction m 40
Number of layer in z direction - 4
Horizontal K: -
Layer 1 m/d 0.98673
Layer 2 m/d 0.163555
Layer 3 m/d 0.014369
Layer 4 m/d 0.009365
Vertical K all layers m/d 0.2
Effective porosity all layers 0.28
Longitudinal dispersivity m 20
Transverse dispersivity m 4
[image:10.595.207.535.490.741.2]terization in such a complex aquifer system, while incorporating chemically re- active transport processes. Table 2 shows the chemical equations related to the contaminant transport processes in the contaminated aquifer.
3.2. Pollutant Transport Simulation in the Mine Site Area
To demonstrate the role of chemically reactive transport process with chemical reactive multi-species in the contaminated aquifer, the reactive contaminant transport simulation results are compared with the simulation model results in-corporating only the physical and chemical transport processes (MT3DMS). PHT3D is utilized to simulate the chemically reactive transport process in the contaminated aquifer. For the purpose of implementation, and to synthetically generate simulated concentration measurement data at specified monitoring lo-cations, specified pollutant concentrations are specified along the boundary of the mining pit. The transport model uses the flow field generated by the flow simulation model to predict the movement of the pollutants in the impacted area of the aquifer over a specified five year period.
The Dispersion Package in MT3DMS and PHT3Dis utilized to simulate the effect of advection, longitudinal dispersion, transverse dispersion and the effec-tive molecular diffusion. The relevant parameter values are given in Table 1. Advection and dispersion occur in every transport process for both non-reactive contaminants and chemical reactive contaminants. But for transport of the reac-tive species, chemical reactions also impact the spreading and movement of the pollutant plume. These reactions are handled by using PHT3D reactive species transport simulation model.
Since advection and dispersion are not impacted by reactions, the input pa-rameters for these two aspects of the transport are the same as in advective and dispersive transport process. PHT3D handle the reactions that the user need to consider. In the developed linked simulation optimization model developed in-corporating PHT3D, the chemical reactions need to be specified in a database file, which will be used by the model during the simulation process.
[image:11.595.209.539.585.731.2]There are certain norms for creation of the reactions input data base for PHT3D. This reaction database enables consideration of the specified reactions.
Table 2. Copper reactions and constants of reaction [22].
Reactions Constant rate (log K)
2
Cu++e−= Cu+ 2.72
( )
2 2
Cu++H O=Cu OH ++H+ −9.19
( )2 2
2
Cu++2H O=Cu OH +2H+ −16.19
( )3 2
2
Cu++3H O=Cu OH −+3H+ −26.9
( )2 2
2 4
Cu++4H O=Cu OH −+4H+ −39.6
2 2
4 4
In this study, reaction databases were utilized to simulate copper related conta-mination. Once the database is created, it has to be linked to PHT3D in order to launch the simulation. In the Basic Transport Package for PHT3D, defining spe-cies also implies choosing a reactions database. This is where the database can be linked to the simulation program. The different active species existing in the da-tabases is then considered in the simulation (Table 2).
Since every species (even the products of the reaction) are considered, the ini-tial concentration must be defined for every species in all the areas and in the pit (a potential source of contamination). As only copper is considered in this study, the species that are considered for the reactions are Cu2+, 2
4
SO − and water for
the reagents. Water does not have to be defined as a species; indeed it is part of the flow model. Then the products of the reactions between copper and water and copper and sulphate are: Cu(OH)+ (named Cu(3) in the database), Cu(OH)2
(named Cu(4)), CuOH3
− (named Cu(5)),
(
)
24
Cu OH − (named Cu(6)) and
CuSO4 (named Cu(7)). There is also Cu+, which is called Cu(1) in the reaction
database, which is formed due to the presence of electrons.
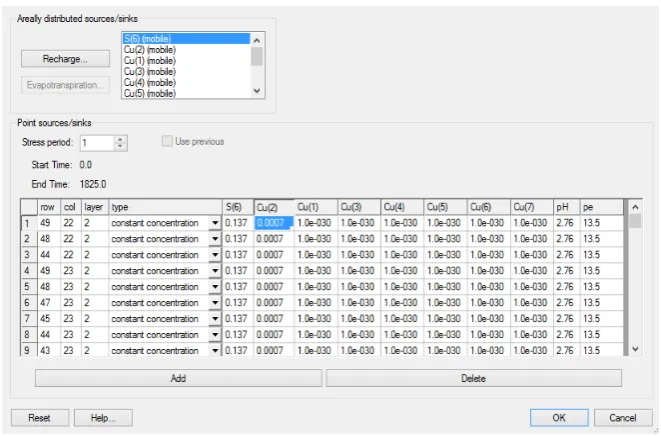
Initial value for these species in the study area is defined in Figure 6. A con-centration of 1.0 × 10⁻³⁰ Mole/L is set in order to avoid numerical error because
of a zero concentration for all the compounds. pH and pe also have to be de-fined. An arbitrary value of 6 is set for the pH because the media is rather acidic than neutral with heterogeneous values. The pe is set at 13.5. The Source/Sink Mixing Package also need to be change.
3.3. Comparison of Advection Dispersion and Reaction
[image:12.595.208.539.488.706.2]The concentrations of all the reaction products in the pit are the same as in all the rest of the study area. Indeed, only copper (II) is assumed to originate from the pit for this simulation. When these parameters are defined, the simulation is
Figure 6. Screen shot of the Source/Sink Mixing Package concentrations input for the
ready to be launched. The plume contours in the study area are obtained based on advection, dispersion, and chemical reaction in the transport process. To show the contaminant transport contours with better resolution, adjust the area close to the pit it showed in Figures 7-9. Figure 7 shows the contaminants spreading with time from North to South. Indeed, with advection, the pollutants spread following the direction of flow, thus from North to South.
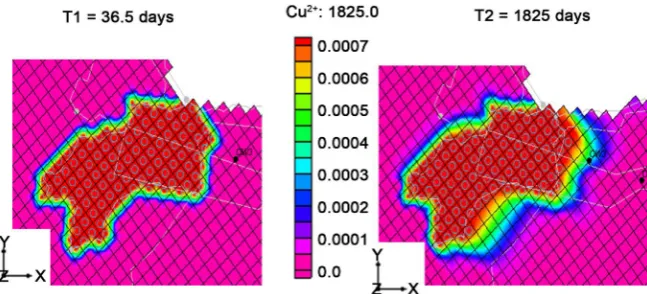
[image:13.595.211.535.382.529.2]Figure 8 represents the simulation results obtained at the beginning and at the end of the simulation based on advection and dispersion. Figure 8 shows the ef-
Figure 7. Evolution of the contaminant plume from the Open Pit between T1 = 36.5
[image:13.595.214.536.577.699.2]days and T2 = 1825 days with only advection.
Figure 8. Evolution of the contaminant plume from the Open Pit between T1 = 36.5
days and T2 = 1825 days with advection and dispersion.
Figure 9. Evolution of the contaminant plume from the Open Pit between T1 = 36.5
fect of dispersion as well. The spread of the pollutant plume is similar to that observed with advection, meaning that the spread occurs generally from North to South, following flow direction. However, with the added effect of dispersion the plume is more diffuse compared to that with only advection. Indeed, with dispersion, the contaminant spreading follows the general direction of flow as well as the longitudinal and transverse directions. Thus the dispersivity allows the contaminant to reach locations in the site further than that with advection. Subsequently, the reaction process is added to the simulation process, in order to see the effect of reactive chemical species transport with Cu2+. Figure 9 show
the simulation results at the beginning and at the end of the simulation time span. Figure 9 shows that the contaminant spread is smaller compared to that for advection and dispersion without reaction. The contaminant concerned in this study is the Cu2+. However, Cu2+ chemically reacts with water and sulphate
in the site. Thus it is because copper (Cu2+) is transformed to other forms of
copper or products, and there is an associated loss of mass resulting in smaller concentrations when the reactive transport process is incorporated.
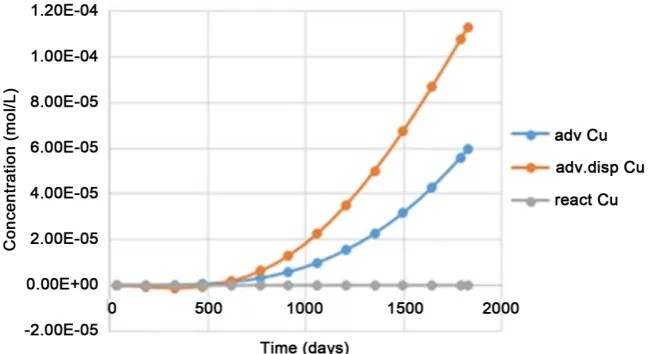
To illustrate a better comparison of different transport processes (Advection, Dispersion, and Chemical Reaction), the Cu2+ concentration in particular at
dif-ferent times is considered using each variation in the transport process. For this purpose, the point A (layer (L) 2, row (R) 53 and column (C) 30) is selected. This point is chosen because it is situated east of the open pit, where the conta-minant spread is evident and the distinction between the advection, dispersion and reaction is prominent (Figure 10).
As shows in Figure 10, for the same point, the Cu2+ concentration is larger
[image:14.595.212.537.523.700.2]with advection and dispersion and smaller with copper reactions. Indeed, the advection allows the contaminants to be spread following the flow direction in the site. However, due to dispersion in addition to advection, at certain locations and time, larger total quantity of contaminant species may be transported, com-pared to advection alone. Thus, at the point A, the dispersion advection process
Figure 10. Graph representing the copper concentration (Mole/L) as a function of
results in more contaminant quantity than the advection process alone. Moreo-ver, the addition of reaction package to the dispersion transport model incorpo-rates the copper product formation following the reactions presented in Table 3. A very small amount of Cu is produced from the chemical reaction equations. There are some reasons for it such as all equations are equilibrium and without any changes in the ion balance the Cu production is very low. Only the Cu+2
transport is shown here.
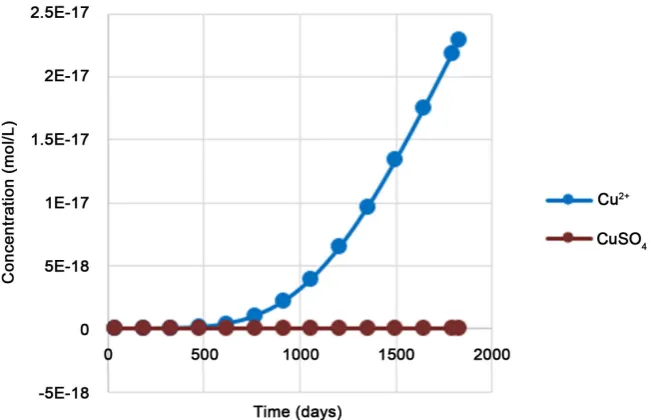
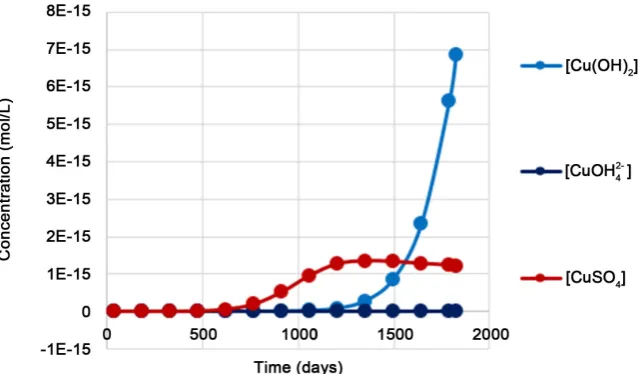
3.4. Copper Products Repartition
[image:15.595.212.538.326.536.2]The different forms of copper are studied at the location A (L: 2, R: 53, C: 30). This point is located on the right hand side (east) of the open pit, in the area where the copper is prominently present and most spread out of the source. Therefore at this location, the Cu2+ reactive transport is likely. Figure 11 and Figure 12 show the different copper forms as a function of time. As shows in
Figure 11, the majority of copper at the point A is in the form of Cu+ at a
con-centration of 2.34E−6 Mole/L at 1825 days. The reaction allowing the formation
Figure 11. Graph representing the concentrations of the different forms of copper
(Mole/L) as a function of time at the point A.
Table 3. Results of the SA algorithm and comparison with real concentrations in the
open pit.
Species Optimal estimated concentrations from linked SA model (mole/L) in the Open Pit (mole/L) Actual concentrations Error (%)
2 4
SO− 0.14622 0.137 6.73
Cu2+ 0.00067 0.0007 4.3
Cu+ 0.00004 1E−30 <100
Cu(OH)2 0.00004 1E−30 <100
[image:15.595.209.540.615.735.2]Figure 12. Graph representing the concentrations of the different forms of copper (Mole/L) as a function of time at the Point A without Cu+.
of Cu+ from Cu2+ (Table 2) has a reaction constant of 2.72 that means a strong
tendency to form Cu+ at the detriment of the Cu2+. The Cu+ is presented with the
most concentration on this point but other products are presented in smaller concentrations (Figure 12).
As shown on Figure 12, two other species are major forms of copper at the point A are: Cu(OH)2 and the CuSO4 at concentrations of 6.87E−15 Mole/L and
1.22E−15 Mole/L respectively at 1825 days. The formation constant for the Cu-SO4 is 2.36, that is higher than that for Cu(OH)2 which is −16.19. But the water is
in excess that could explain why the Cu(OH)2 concentration is more important
than CuSO4 concentration. The other copper forms such as CuOH+, Cu(OH)3−
and Cu(OH)42− are not in large enough concentration to be considered as major
copper forms. Indeed, their formation constants are lower than the Cu+, Cu(OH) 2
and CuSO4. That is why they are almost not traceable. Moreover, Cu(OH)2 is the
product of the reaction between water and Cu2+ the most stable. Thus if formed, CuOH+ is transformed to Cu(OH)
2. Very small amount if any, of Cu(OH)3− and
Cu(OH)42− are formed. The four major forms of copper in the site are Cu2+, Cu+,
Cu(OH)2 and CuSO4. These four species are considered as the relevant
conta-minants for the groundwater pollution source identification using the linked SA algorithm and PHT3D reactive transport simulation model
4. Source Characterization Using PHT3D as the
Reactive Chemical Species Transport Model
data are generated for the study area for specified source characteristics. Then these synthetic concentration measurement data are utilized together with the linked simulation-optimization models, to evaluate the potential applicability, accuracy and feasibility of the developed methodology. The Cp it is considered as a distributed source of reactive contaminants. For simplification, it is assumed that the unknown contamination source characterization problem can be repre- sented by using unknown concentrations on the periphery of the open pit. Therefore discharge into the aquifer from the pit with specified water surface elevation (estimated by the calibrated flow model) and the unknown concentra-tions to be estimated as the source concentration by using the linked optimiza-tion simulaoptimiza-tion model, will determine the unknown contaminant mass flux. Therefore, the liked source characterization model essentially needs to estimate the unknown concentrations along the periphery of the open pit in order to characterize the unknown contaminant sources.
5. Results and Discussion
The performance evaluation results of source characterization using PHT3D model linked SA optimization algorithm are presented in Table 3. The conta-minant source concentration magnitude is in mole per liter. In Table 3, the linked optimization model solution results for reactive transport process are compared with synthetically simulated actual concentrations at the observation wells for specified pollution sources. The errors associated with source characte-rization using the PHT3D model linked optimization model are very small. However, source magnitude results is comparatively large for some Cu compo-nents due to site complexity with associated chemically reactive multiple species. These performance evaluation results demonstrate that the developed metho-dology with PHT3D models is capable of optimally identifying the actual source magnitudes and locations in the mine site area with small estimation errors.
Figure 13 illustrates the number of iteration in source characterization optimi-zation model and the corresponding objective function value. The objective function value should converge to nearly a zero value for an optimal solution. The objective function value trend line, by decreasing, indicates that the optimal function value converges towards zero that should mean that the estimated sul-phate and copper concentrations converge towards their respective actual values related to the open pit source.
In order to verify if the optimal concentration values given by SA algorithm correspond to the real initial concentrations integrated in the Open Pit, these values are used as input to the PHT3D simulation model to simulate the result-ing concentrations at the monitorresult-ing locations. A typical solution result ob-tained for the Copper (II) at the point A (L = 2, R = 57, C = 28) is presented on
Figure 14.
Figure 14 shows that the Cu2+ concentrations obtained for different times at
Figure 13. Graph representing the objective function values as a function of the number of iterations for one typical trial.
Figure 14. Graphs representing the concentrations of Cu2+ obtained from the con-
trol source and the concentrations of Cu2+ obtained when the source concentra-
tions correspond to the concentrations given by the SA simulation, as a function of times in the point 2.
concentrations obtained by using the estimated source does not exceed 16%. Thus, this trial shows that the linked simulation optimization model incorpo-rating reactive chemical species transport is potentially useful for estimating the unknown contaminant source accurately. No doubt more rigorous performance evaluations are necessary to establish this beyond doubt, or to determine the li-mitations.
6. Conclusions
[image:18.595.212.535.306.481.2]the aquifer to the Dee River, situated downstream of the mine site. This pheno-menon is characterized by acid water rich in metals which polluted the ecosys-tem of the water sysecosys-tems present in the mine site.
Following this problem of contamination, the aim of this study was to estab-lish a transport model of the contaminants: the copper (II); and to validate this model in order to be able to use it for the identification of unknown pollution sources present in the site. For that, a three-dimensional reactive transport si-mulation model PHT3D, along with the groundwater flow sisi-mulation model MODFLOW (also available within the processing software GMS) has been used. This reactive species transport simulation model allows numerical three-dimen- sional transient simulation of reactive chemical species.
Once the transport models for different transport process scenarios are im-plemented, one aim was to verify the validity of these models. For that, an un-known pollution sources characterization software is used. The dispersion and reactions models, which are the more representative of the phenomenon present on the site, are verified by testing the simulation model for a specified source: the Open Pit, and considering copper related reactions. Very limited evaluations show that the methodology can identify the source concentrations with the larg-est error of 16%. These errors are comparatively larger than those obtained when using MT3DMS with advection and dispersion only. However, those results do not represent realistic description of all the hydrogeochemical processes in this site. Including the reactive processes represents more realistic description of the actual transport processes in the site and these results are within acceptable range of accuracy. Therefore, the methodology using PHT3D as a simulation model linked to the optimization algorithm (SA) can be considered as potential-ly applicable for characterization of unknown contaminant sources in a complex contaminated aquifer with chemically reactive contaminant species. However, more rigorous evaluations are necessary to establish widespread applicability of the proposed computational code and the methodology. It is also noted that the SA optimization algorithm may have few inherent limitations in terms of effi-ciency in reaching an optimal solution. Application of Adoptive Simulated An-nealing Algorithm (ASA) [22] could be a better choice to ensure more efficient convergence to a global optimal solution.
Acknowledgements
This study is a continuation of studies previously undertaken, with financial su- pport from CRC-CARE, Australia through Project No. 5.6.0.3.09/10 (2.6.03), CRC- CARE-Bithin Datta, at James Cook University, Australia.
References
[1] Chadalavada, S., Datta, B. and Naidu, R. (2012) Optimal Identification of Ground-water Pollution Sources Using Feedback Monitoring Information: A Case Study.
Environmental Forensics, 13, 140-154.
https://doi.org/10.1080/15275922.2012.676147
Charac-terization and Management. Hydrogeology Journal, 23, 1043-1049.
https://doi.org/10.1007/s10040-015-1297-3
[3] Parkhurst, D.L., Thorstenson, D.C. and Plummet,L.N. (1982) PHREEQE: A Com-puter Program for Geochemical Calculations: Water-Resources Investigations Re-port 80-96. Vol. 210.
[4] Tebes-Stevensa, C., Valocchia, A.J., VanBriesen, J.M. and Rittmannb, B.E. (1998) Multicomponent Transport with Coupled Geochemical and Microbiological Reac-tions: Model Description and Example Simulations. Journal of Hydrology, 209, 8- 26.
[5] Prommer, H., Barry, D.A. and Davis, G.B. (2002) Modelling of Physical and Reac-tive Processes during Biodegradation of a Hydrocarbon Plume under Transient Groundwater Flow Conditions. Journal of Contaminant Hydrology, 59, 113-131. [6] Prommer, H. (2002) PHT3D—A Reactive Multi-Component Transport Model for
Saturated Porous Media. Version 1.0 User’s Manual, Technical Report, Contami-nated Land Assessment and Remediation Research Centre, The University of Ed-inburgh.
[7] Zheng, C. and Wang, P.P. (1999) MT3DMS: A Modular Three-Dimensional Multi- species Model for Simulation of Advection, Dispersion and Chemical Reactions of Contaminants in Groundwater Systems; Documentation and User’s Guide. Con-tract Report SERDP-99-1, US Army Engineer Research and Development Center, Vicksburg, MS.
[8] Parkhurst, D.L. and Appelo,C.A.J. (1999) User’s Guide to PHREEQC—A Compu- ter Program for Speciation, Reaction-Path, 1D-Transport, and Inverse Geochemical Calculations. Technical Report 99-4259, US Geol. Survey Water-Resources Investi-gations Report.
[9] Clement, T.P. (1997) RT3D—A Modular Computer Code for Simulating Reactive Multi-Species Transport in 3-Dimensional Groundwater Systems. Battelle Pacific Northwest National Laboratory Research Report, PNNL-SA-28967.
[10] Waddill, D.W. and Widdowson, M.A. (1998) SEAM3D: A Numerical Model for Three-Dimensional Solute Transport and Sequential Electron Acceptor-Based Bio-remediation in Groundwater. Technical Report, Virginia Tech., Blacksburg, Vir-ginia.
[11] Carey, G.R., Van Geel, P.J. and Murphy, J.R. (1999) BioRedox-MT3DMS V2.0: A Coupled Biodegradation-Redox Model for Simulating Natural and Enhanced Biore- mediation of Organic Pollutants. User’s Guide Conestoga Rovers and Associates, Waterloo, Ontario, Canada.
[12] Freedman, V. and Ibaraki, M. (2002) Effects of Chemical Reactions on Density-De- pendent Fluid Flow: On the Numerical Formulation and the Development of Insta-bilities. Advances in Water Resources, 25, 439-453.
[13] Parkhurst, D.L., Kipp, K.L., Engesgaard, P. and Charlton, S.R. (2004) PHAST e A Program for Simulating Ground-water Flow, Solute transport, and Multicomponent Geochemical Reactions. U.S. Geological Survey, Denver, Colorado.
[14] Mao, X., et al. (2006) Three-Dimensional Model for Multi-Component Reactive Transport with Variable Density Groundwater Flow. Environmental Modelling & Software, 21, 615-628.
[15] Simunek, J., Ejna, M., Saito, H., Sakai, M. and Van Genuchten, M.T. (2009) The HYDRUS-1D Software Package for Simulating the Movement of Water, Heat, and Multiple Solutes in Variably Saturated Media, Version 4.0. Department of Environ- mental Sciences, University of California Riverside, Riverside, California.
into PHREEQC for the Simulation of Biogeochemical Reactions in the Vadose Zone. Environmental Modelling & Software, 25, 526-538.
[17] Sun, J. (2004) A Three-Dimensional Model of Fluid Flow, Thermal Transport, and Hydrogeochemical Transport through Variably Saturated Conditions. M.S. Thesis. Department of Civil and Environmental Engineering, University of Central Florida, Orlando, FL.
[18] Yeh, G.T., et al. (2004) HYDROGEOCHEM 5.0: A Three-Dimensional Model of Coupled Fluid Flow, Thermal Transport, and Hydrogeochemical Transport through Variably Saturated Conditions. Version 5.0. National Laboratory Oak Ridge, Ten-nessee.
[19] Esfahani, K.H. and Datta, B. (2015) Simulation of Reactive Geochemical Transport Processes in Contaminated Aquifers Using Surrogate Models. International Journal of GEOMATE, 8, 1190-1196.
[20] Esfahani, K.H. and Datta, B. (2015) Use of Genetic Programming Based Surrogate Models to Simulate Complex Geochemical Transport Processes in Contaminated Mine Sites. In: Gandomi, A.H., Alavi, A.H. and Ryan, C., Eds., Handbook of Gene- tic Programming Application, Springer International Publishing, Switzerland, 359- 379. https://doi.org/10.1007/978-3-319-20883-1_14
[21] Datta, B., et al. (2016) Preliminary Hydrogeologic Modeling and Optimal Monitor-ing Network Design for a Contaminated Abandoned Mine Site Area: Application of a Developed Monitoring Net-work Design Software. Journal of Water Resource and Protection, 8, 46-64. https://doi.org/10.4236/jwarp.2016.81005
[22] Esfahani, K.H. and Datta, B. (2016) Linked Optimal Reactive Contaminant Source Characterization in Contaminated Mine Sites: A Case Study. Journal of Water Re-source Planning and Management, 142.
https://doi.org/10.1061/(ASCE)WR.1943-5452.0000707
[23] Wissmeier, L. and Barry, D.A. (2011) Simulation Tool for Variably Saturated Flow with Comprehensive Geochemical Reactions in Two- and Three-Dimensional Do-mains. Environmental Modelling & Software, 26, 210-218.
[24] Charlton, S.R. and Parkhurst, D.L. (2011) Modules Based on the Geochemical Mo- del PHREEQC for Use in Scripting and Programming Languages. Computers and Geosciences, 37, 1653-1663.
[25] COMSOL (2010) Multiphysics. http://www.comsol.com/
[26] Prommer, H., Barry, D.A. and Zheng, C. (2003) MODFLOW/MT3DMS Based Re-active Multicomponent Transport Modelling. Groundwater, 41, 247-257.
https://doi.org/10.1111/j.1745-6584.2003.tb02588.x
[27] Gorelick, S.M., Evans, B. and Remson, I. (1983) Identifying Sources of Groundwater Pollution: An Optimization Approach. Water Resources Research, 19, 779-790.
https://doi.org/10.1029/WR019i003p00779
[28] Datta, B., Beegle, J.E., Kavvas, M.L. and Orlob, G.T. (1989) Development of an Ex-pert System Embedding Pattern Recognition Techniques for Pollution Source Iden-tification. Completion Rep.for U.S.G.S. Grant No. 14-08-0001-G1500, Dept. of Ci- vil Engineering, Univ. of California, Davis, Calif.
[29] Wagner, B.J. (1992) Simultaneous Parameter Estimation and Pollutant Source Cha- racterization for Coupled Groundwater Flow and Pollutant Transport Modeling.
Journal of Hydrology, 135, 275-303.
[30] Mahar, P.S. and Datta, B. (1997) Optimal Monitoring Network and Ground-Water- Pollution Source Identification. Journal of Water Resource Planning and Manage-ment, 123, 199-207. https://doi.org/10.1061/(ASCE)0733-9496(1997)123:4(199)
Groundwater System. Water Resource Management, 14, 209-227.
https://doi.org/10.1023/A:1026527901213
[32] Mahar, P.S. and Datta, B. (2001) Optimal Identification of Ground-Water Pollution Sources and Parameter Estimation. Journal of Water Resource Planning and Man-agement, 127, 20-30. https://doi.org/10.1061/(ASCE)0733-9496(2001)127:1(20)
[33] Datta, B., Chakrabarty, D. and Dhar, A. (2009) Simultaneous Identification of Un-known Groundwater Pollution Sources and Estimation of Aquifer Parameters. Jour- nal of Hydrology, 376, 48-57.
[34] Aral, M.M., Guan, J.I. and Maslia, M.L. (2001) Identification of Pollutant Source Location and Release History in Aquifers. Journal of Hydrologic Engineering, 6, 10.
https://doi.org/10.1061/(ASCE)1084-0699(2001)6:3(225)
[35] Singh, R.M. and Datta, B. (2006) Identification of Groundwater Pollution Sources Using GA-Based Linked Simulation Optimization Model. Journal of Hydrologic Engineering, 11, 101-110. https://doi.org/10.1061/(ASCE)1084-0699(2006)11:2(101)
[36] Ayvaz, M.T. (2010) A Linked Simulation-Optimization Model for Solving the Un-known Groundwater Pollution Source Identification Problems.Journal of Contami- nant Hydrology, 117, 46-59.
[37] Jha, M.K. and Datta, B. (2011) Simulated Annealing Based Simulation-Optimization Approach for Identification of Unknown Contaminant Sources in Groundwater Aquifers. Desalination and Water Treatment, 32, 79-85.
https://doi.org/10.5004/dwt.2011.2681
[38] Prakash, O. and Datta, B. (2014) Characterization of Groundwater Pollution Sources with Unknown Release Time History. Journal of Water Resource and Pro-tection, 6, 337-350. https://doi.org/10.4236/jwarp.2014.64036
[39] Prakash, O. and Datta, B. (2015) Optimal Characterization of Pollutant Sources in Contaminated Aquifers by Integrating Sequential-Monitoring-Network Design and Source Identification: Methodology and an Application in Australia. Hydrogeology Journal, 23, 1089-1107. https://doi.org/10.1007/s10040-015-1292-8
[40] Gurarslan, G. and Karahan, H. (2015) Solving Inverse Problems of Groundwater- Pollution-Source Identification Using a Differential Evolution Algorithm. Hydro-geology Journal, 23, 1109-1119. https://doi.org/10.1007/s10040-015-1256-z
[41] Elçi, A. and Ayvaz, M.T. (2014) Differential-Evolution Algorithm Based Optimiza-tion for the Site SelecOptimiza-tion of Groundwater ProducOptimiza-tion Wells with the ConsideraOptimiza-tion of the Vulnerability Concept. Journal of Hydrology, 511, 736-749.
[42] Chadalavada, S., Datta, B. and Naidu, R. (2011) Optimisation Approach for Pollu-tion Source IdentificaPollu-tion in Groundwater: An Overview. International of Environ- ment and Waste Management, 8, 40-61.
https://doi.org/10.1504/IJEWM.2011.040964
[43] Ketabchi, H. and Ataie-Ashtiani, B. (2015) Review: Coastal Groundwater Optimiza-tion—Advances, Challenges, and Practical Solutions. Hydrogeology Journal, 23, 1129-1154. https://doi.org/10.1007/s10040-015-1254-1
[44] Sreekanth, J. and Datta, B. (2015) Review: Simulation-Optimization Models for the Management and Monitoring of Coastal Aquifers. Hydrogeology Journal, 23, 1155- 1166. https://doi.org/10.1007/s10040-015-1272-z
[45] Wels, C., Findlater, L. and McCombe, C. (2006) Assessment of Groundwater Im-pacts at the Historic Mount Morgan Mine Site, Queensland, Australia. The 7th In-ternational Conference on Acid Rock Drainage (ICARD), Lexington, 2311-2331. [46] Harbaugh, A.W., Banta, E.R., Hill, M.C. and McDonald, M.G. (2000) MODFLOW-
Modularization Concepts and the Ground-Water Flow Process. Open-File Report 2000-92, U.S. Geological Survey, 121 p.
[47] Domenico, P.A. and Schwartz,F.W. (1998) Physical and Chemical Hydrogeology. 2nd Edition, John Wiley & Sons, Inc., New York.
[48] Prommer, H., Davis, G.B. and Barry, D.A. (1999) PHT3D—A Three-Dimensional Biogeochemical Transport Model for Modelling Natural and Enhanced Remedia-tion. Contaminated Site Remediation: Challenges Posed by Urban and Industrial Contaminants, Fremantle, Western Australia, 21-25 March 1999 (C. D. Johnston, Ed.), 351-358.
[49] Parkhurst, D.L. (1995) User’s Guide to PHREEQC—A Computer Program for Spe- ciation, Reaction-Path, Advective-Transport, and Inverse Geochemical Calcula-tions. Technical Report 4227, U.S. Geological Survey Water-Resources Investiga-tions Report.
[50] Kirkpatrick, S., Gelatt Jr., C.D. and Vecchi, M.P. (1983) Optimization by Simulated Annealing. Science, 220, 671-680. https://doi.org/10.1126/science.220.4598.671
[51] Goffe, W.L. (1996) SIMANN: A Global Optimization Algorithm Using Simulated Annealing. Studies in Nonlinear Dynamics and Econometrics, 1, No. 3, 1-9. [52] Jones, M.R. (2003) Mount Morgan-Biloela Basin District, Queensland. DERM
(De-partment of Natural Resources and Mines). Government of Queensland, Australia. [53] MLA (2008) Meat & Livestock Australia. Mount Morgan Climate History, 113. [54] Edraki, M., Golding, S.D., Baublys, K.A. and Lawrence, M.G. (2005)
Hydrochemis-try, Mineralogy and Sulfur Isotope Geochemistry of Acid Mine Drainage at the Mt. Morgan Mine Environment, Queensland, Australia. Applied Geochemistry, 20, 789-805.
[55] Jones, D. (2001) Contaminant Source Study, Mount Morgan Mine. EWL Sciences Pty Ltd., Darwin.
[56] Taube, A. (2000) Dumps and Tailings on the Mt Morgan Mine Lease. In: Paddon, B. and Unger, C. Eds., Proceedings of the Mt Morgan Rehabilitation Planning Workshop, Dept of Mines and Energy Central Region, Rockhampton.
[57] Edraki, M., Golding, S.D., Baublys, K.A. and Lawrence, M.G. (2005) Hydrochemis-try, Mineralogy and Sulfur Isotope Geochemistry of Acid Mine Drainage at the Mt. Morgan Mine Environment, Queensland, Australia. Applied Geochemistry, 20, 789-805.
[58] Taube, A. (1986) The Mount Morgan Gold-Copper Mine and Environment, Queensland; a Volcanogenic Massive Sulfide Deposit Associated with Penecontem- poraneous Faulting.Economic Geology, 81, 1322-1340.
https://doi.org/10.2113/gsecongeo.81.6.1322
[59] Ulrich, T., Golding, S.D., Kamber, B.S., Khin, Z. and Taube, A. (2003) Different Mi- neralization Styles in a Volcanic-Hosted Ore Deposit: The Fluid and Isotopic Sig-natures of the Mt. Morgan Au-Cu Deposit Australia. Ore Geology Reviews, 22, 61- 90.
[60] Jha, M. and Datta, B. (2015) Application of Unknown Groundwater Pollution Source Release History Estimation Methodology to Distributed Sources Incorpo-rating Surface-Groundwater Interactions. Environmental Forensics, 16, 143-162.
Submit or recommend next manuscript to SCIRP and we will provide best service for you:
Accepting pre-submission inquiries through Email, Facebook, LinkedIn, Twitter, etc. A wide selection of journals (inclusive of 9 subjects, more than 200 journals)
Providing 24-hour high-quality service User-friendly online submission system Fair and swift peer-review system
Efficient typesetting and proofreading procedure
Display of the result of downloads and visits, as well as the number of cited articles Maximum dissemination of your research work
Submit your manuscript at: http://papersubmission.scirp.org/
![Figure 5. Flow simulation and calibration results [21].](https://thumb-us.123doks.com/thumbv2/123dok_us/7767821.715731/10.595.269.476.253.424/figure-flow-simulation-calibration-results.webp)
![Table 2. Copper reactions and constants of reaction [22].](https://thumb-us.123doks.com/thumbv2/123dok_us/7767821.715731/11.595.209.539.585.731/table-copper-reactions-constants-reaction.webp)