Munich Personal RePEc Archive
Financial Market Contagion During the
Global Financial Crisis: Evidence from
the Moroccan Stock Market
El Ghini, Ahmed and Saidi, Youssef
FSJES, Mohamed V University-Souissi, Rabat, Morocco, Research
Department, Bank Al-Maghrib, Rabat, Morocco
28 December 2013
Online at
https://mpra.ub.uni-muenchen.de/53490/
Financial Market Contagion During the Global Financial Crisis:
Evidence from the Moroccan Stock Market
∗Ahmed EL GHINI
†FSJES, Mohamed V University-Souissi, Rabat, Morocco
Youssef SAIDI
‡Research Department, Bank Al-Maghrib, Rabat, Morocco
Abstract
In this paper, we aim at the study of the contagion of the global financial crisis (2007-2009) on Moroccan
stock market. Our study focuses to examine whether contagion effects exist on Moroccan stock market, during
the current financial crisis. Following Forbes and Rigobon (2002), we define contagion as a positive shift in the
degree of comovement between asset returns. We use stock returns in MASI, CAC, DAX, FTSE and NASDAQ
as representatives of Moroccan, French, German, British and U.S. markets respectively. To measure the degree
of volatility comovement, time-varying correlation coefficients are estimated by flexible multivariate dynamic
conditional correlation (DCC). We investigate empirical studies using the DCC-GARCH model to test the
contagion hypothesis from U.S. and European markets to the Moroccan one.
Key-words : Multivariate GARCH model, financial crisis, contagion hypothesis, break identification,
conditional volatility, volatility comovement.
JEL Classification : C5, C22, G1, G01, G15.
1
Introduction
The global financial crisis of 2007-2009 is generally recognized as one of the most severe since the Great
De-pression of 1929 and will be well-known in the books of history and finance. Stock market crash around the
∗The views expressed herein are those of the authors and not necessarily those of their institutions. The authors are grateful for
fruitful discussions with participants of the 20th International Forecasting Financial Markets Conference, Hannover, Germany. †Economics Department, Eradiass, Faculty of Juridical, Economic and Social Sciences, Souissi, Av. Mohammed Ben Abdellah
Ragragui, Al Irfane B.P : 6430, Rabat, Morocco, TEL : +212 5 37 67 17 09, FAX : +212 5 37 67 17 51, e-mail : aelghini@gmail.com. ‡Bank Al-Maghrib, Espace les Patios - Angle Avenue Mehdi Benbarka et Avenue Annakhil Hay Ryad - Rabat, Morocco
world during the crisis period demonstrated the financial contagion of recent global financial crisis.
Notwith-standing the financial crisis firstly hit stock markets in the United States and other developed markets, it soon
spread around the world to hit stock markets in emerging countries. Current studies on contagion offer many
methods for measuring the propagation of international shocks across countries. Some of the more widely used
processes include the cross-market correlation coefficient procedures (e.g., King and Wadhwani 1990), analysis
with a cointegration relationship between markets (e.g., Longin and Solnik 1995), probit-logit models (e.g.,
Eichengreen, Rose, and Wyplosz 1996), and autoregressive conditional heteroskedasticity (ARCH) or GARCH
models (e.g., Hamao et al. 1990). Forbes and Rigobon (2002) survey other prevailing contagion procedures
used to measure how shocks are transmitted on different equity markets in the world.
The initial empirical literature on financial contagion was the simple comparative analysis of Pearson’
correlation coefficients between markets in calm and in crisis periods. Contagion was found when significant
increases in correlations occurred in periods of crisis. King and Wadhwani (1990), and Lee and Kim (1993)
employed the correlation coefficient between stock returns to test for the impact of the U.S. stock crash in 1987
on the equity markets of several countries. Empirical findings show that the correlation coefficients between
several markets significantly increased during the crash. Hamao and al. (1990) employed the conditional
variance estimated under the GARCH model to test for correlations between market volatilities for the crisis of
1987. Edwards and Susmel (2001) used switching ARCH model. They found that many Latin American equity
markets, during the times of high market volatility, were significantly correlated which proved the existence of
contagion effects.
Many recent studies have dealt with the recent global financial crisis. Some of them tackle the specific
issue of market contagion. Among them Guo et al (2011) and Longstaff (2010) study the cross-asset contagion
between several asset classes in the US market. Kenourgios et al (2011) deal with the contagion in the BRIC
emerging equity markets. Johansson (2011) examines equity market movements in East Asia and Europe during
the global financial crisis. The issue with Johansson (2011) is that it uses a time period 2004-2008 and thus
the time period ends in a period when the global financial markets enter the highest level of turmoil. Neaime
(2012) examined the impact of the recent financial crisis in the MENA region, he found a higher correlation
with the U.S. stock market during the crisis, the index of the place of Egypt, the CASE30, ended 2008 with a
change of -56.43 %. All of these studies find evidence of contagion.
The current paper focuses to investigate empirically the comovements between the Moroccan stock market
and the U.S., France, U.K. and Germany stock markets over the period of 2002-2012. Therefore, we contribute
to the literature of contagion among the financial markets around the financial crisis of 2007-2009. We employ
tow flexible multivariate GARCH models (CCC, and DCC) to measure conditional correlations between the
Germany to Morocco.
In fact, DCC-GARCH model of Engle (2002) has been extensively used in the contagion literature, mainly
because of its intuitive interpretation property and the fact that it involves a simpler estimation procedure
than the VEC models described in Engle and Kroner (1995). In addition, it does not suffer from the simplistic
assumption of constant correlation as is does the CCC-GARCH. Finally, being part of the GARCH family of
models gives the DCC-GARCH the flexibility to be combined with any univariate GARCH model to capture
asymmetric or long memory effects. On the other hand, the restrictive assumption of constant correlations
(CCC) is employed to whether will be rejected by the data.
The rest of the paper is organized as follows. Section 2 describes the data used and provides the different
used econometric tools. Section 3 is devoted to our empirical findings including their analysis and discussion.
Finally, Section 4 provides conclusion.
2
Data and Methodology
In this section, we firstly present the description of the different data used in our analysis. Secondly, we present
the econometric tools we use to develop our empirical analysis. We define shift contagion as a significant
increase in correlations between stock returns during financial crisis period. Then, time-varying correlation
coefficients are estimated by the Dynamic Conditional Correlation (DCC) Multivariate GARCH model. We
use also its restriction CCC-GARCH model to test whether the assumption of constant correlations will be
rejected by the data. In order to recognize the contagion effects, we test whether the mean of the DCC-GARCH
estimated conditional correlation coefficients in post-crisis period differs from that in the pre-crisis period. This
paper considers the same break point due to the financial crisis estimated previously in El Ghini and Saidi
(2013) based on the structural break tests of Bai-Perron (1998, 2003) and Lee-Strazicich (2003, 2004).
2.1
Data and Descriptive Statistics
The Casablanca Stock Exchange (CSE), which achieves one of the best performances in the region of the Middle
East and North Africa (MENA), is Africa’s third largest Bourse after Johannesburg Stock Exchange (South
Africa) and Nigerian Stock Exchange in Lagos. Originally, CSE had the "Indice General Boursier" (IGB) as
an index. IGB was replaced on January 2002 by two indices: MASI (Moroccan All Shares Index) and MADEX
(Moroccan Most Active Shares Index). The Open Market Days are Monday-Friday and the financial market
trading hours are 9:00 AM to 03:30 PM (GMT/GMT+1 in the summer).
In our empirical studies, we consider the stock market indices, namely, MASI (Morocco), NASDAQ 100
extensively based on financial and econometric literature and are considered as the most comprehensive index
for the above countries. The sample set of data used are daily closing prices of the five indices from January
2002 to December 2012 excluding holidays (2869 observations).
We compute the returns (Stock return, Rit is measured as logarithmic difference of the price series, Pit
as follows: Rit = 100∗ln(Pit/Pi(t−1))) for each index. Then we proceeded the pretreatment of the data by
filtering method to remove the whole linear structure from the returns, which were present in the first moment
of the series. Panel 1 displayed in the Appendix shows the dynamics of all return series.
Following El Ghini and Saidi (2013), we use the date September 26, 2008 as break point of NASDAQ due to
the subprime crisis. The break point due to the subprime crisis is estimated using Lee-Strazicich (2003,2004)
and Bai-Perron (1998, 2003) structural break tests. In the following, we divide the overall sample data into
two sub-periods: the pre-crisis (January 2, 2002-September 26, 2008: 1758 observations) and the post-crisis
(September 29, 2008 - December 31, 2012: 1111 observations). Following the NASDAQ crash, the MASI and
the three other European markets indices, shown in the Panel 2 displayed in the Appendix, appears to decrease
dramatically around September 26, 2008.
Table A.1 given in the Appendix contains the summary statistics of the market returns in the full and two
defined sub-periods. The kurtosis of all return series is much larger than three. Further, the Jarque-Berra
normality test (p<0.0001) reveals a statistically significant deviation of the data form normality. The
Ljung-Box test Q statistics confirm the presence of autocorrelation on the return series. The Ljung-Box test for
heteroscedasticity,Q2statistics, is significant (p<0.0001) for all squared returns, which confirm the presence of
heteroscedasticity in all return sample series. The Augmented Dickey-Fuller (ADF) and Phillips-Perron (PP)
test statistics for all return series are less than their critical values at the1%.
2.2
Multivariate GARCH models
In conventional econometrics, the variance of the error terms is assumed to be constant (homoskedasticity) over
time. But it is unlikely in the framework of financial time series. Many financial time series have exhibited the
property of ’long-memory’ (the presence of statistically significant correlations between observations that are
a large distance apart), see e.g. Harris and Sollis (2003). Another distinguishing feature of the financial time
series is known as ’volatility clustering’, i.e large (small) volatility followed by large (small) volatility. In other
terms, the current level of the volatility is positively related with its level during the immediately preceding
periods (Brooks 2002).
Engle (1982) developed the ARCH (Autoregressive Conditional Heteroscedasticity) model that allows for
the conditional variance to be time-varying. However there are some limitations for ARCH(q) model.
Heteroscedasticity), which allows for the conditional variance to be dependent upon previous own lags.
However, some researchers are interested in quantifying the interactions between the volatility of N
differ-ent financial time series. In this context, the multivariate GARCH models are utilized instead of univariate
counterparts.
In this section, we present the econometric tools we use to develop our empirical analysis. We define
shift-contagion as a significant increase in correlations between stock returns during financial crisis period. Then,
time-varying correlation coefficients are estimated by the Dynamic Conditional Correlation (DCC) Multivariate
GARCH model. We use also its restriction CCC-GARCH model to test whether the assumption of constant
correlations will be rejected by the data. In order to recognize the contagion effects, we test whether the mean
of the DCC estimated conditional correlation coefficients in post-crisis period differs from that in the pre-crisis
period.
2.2.1
DCC-GARCH model
In multivariate GARCH models, considering a stochastic vector series(Xt)with a dimension of(N×1), the conditional mean of Xt is an (N×1) vector µt and the conditional covariance of Xt is an(N ×N) matrix
Ht. Engle (2002) and Tse and Tsui (2002) attempted to model both variances and conditional correlations of
several series using the DCC-GARCH process. To measure the degree of comovement time-varying correlation
coefficients, we apply DCC-GARCH model of Engle (2002). The multivariate model is defined as follows:
Xt=µt+Ht1/2ǫt (1)
where
Ht = DtRtDt (2)
Rt =
diag(Qt)−1/2Qt
diag(Qt)−1/2 (3)
Dt = diag
p h11,t,
p
h22,t, . . . ,
p
hN N,t (4)
such thatXt=
X1t, X2t, . . . , XN t
is the vector of past observations, µt=
µ1t, µ2t, . . . , µN t
is the vector
of conditional returns, ǫt =
ǫ1t, ǫ2t, . . . , ǫN t
is the vector of the standardized residuals, Rt is a (N ×N)
symmetric dynamic correlations matrix and Dt is a diagonal matrix of standard deviations for each of the
returns series, obtained from estimating a univariate GARCH process in Equation 1:
hii,t=ωi+αiǫi,t2 −1+βihii,t−1 (5) Qtis aN×N variance-covariance matrix of standardized residuals
ut= √ǫt
ht
which defined as follows :
Qt= (1−θ1−θ2)Q+θ1ut−1u
′
where Q = E(utu
′
t) refers to (N ×N) symmetric positively-defined matrix of the unconditional
variance-covariance of standardized residuals. θ1 and θ2 are the unknown parameters to be estimated. The sum of
these coefficients must be less than one in order to insure positivity of the matrixQt. Therefore, for a pair of
marketsi andj , their conditional correlation at timetcan be written as :
ρij,t=
(1−θ1−θ2)qij+θ1ui,t−1uj,t−1+θ2qij,t−1
(1−θ1−θ2)qii+θ1u2i,t−1+θ2qii,t−1 1/2
(1−θ1−θ2)qjj+θ1u2j,t−1+θ2qjj,t−1
1/2, (7)
whereqij is the element on the ithline andjth column of the matrixQt.
The parameters are estimated using quasi-maximum likelihood method (QMLE) introduced by Bollerslev
and Wooldridge (1992). This method permits to obtain, for each variable, the conditional variance and the
conditional covariance. Under the Gaussian assumption, the likelihood function can be rewritten as:
L(θ) =−1
2 T
X
t=1
nln(2π) + 2 ln|Dt|+ ln|Rt|+u
′
tR−t1ut
(8)
withut=√ǫt
ht =D−
1
t ǫt.
2.2.2
CCC-GARCH model
The Constant Conditional Correlation multivariate GARCH model was introduced by Bollerslev in 1990 to
primarily model the conditional covariance matrix indirectly by estimating the conditional correlation matrix.
The conditional correlation is assumed to be constant while the conditional variances are varying. Obviously,
this assumption is impractical for real financial time series. Then certain modifications were made grounded
on this form, see Silvennoinen and Teräsvirta (2009) for more details.
3
Empirical results
In this part, we test the contagion effects of the U.S. subprime crisis on the Moroccan market by examining the
variation in the time-varying conditional correlation coefficients estimated by using bivariate DCC-GARCH
model.
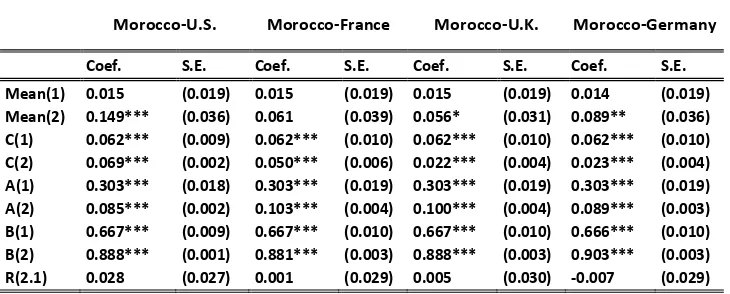
In the Appendix, Tables A2-A3 give estimation results of the bivariate DCC-GARCH model in pre- and
post-crisis periods for each pair: Morocco-U.S., Morocco-France, Morocco-UK and Morocco-Germany. The
empirical results obtained from the CCC model presented in Tables A.4 and A.5, where it was found that the
ARCH and GARCH estimated coefficients in the pre- and post-crisis periods are also statistically significant at
1% level, are so in accordance with the DCC estimation results. In order to investigate the contagion effects,
forthcoming subsection to test, using Forbes and Rigobon (2002), the cross market contagion from the U.S.,
France, U.K. and Germany stock markets to Moroccan one. In the second, we present our discussion of the
results.
3.1
Testing the contagion effect of the U.S. subprime crisis
The definition of the term contagion varies widely across the literature. Hence, the initial literature of this
phenomenon has usually been divided as to whether transmission through real or financial channels constitutes
contagion. The broad definition of theWorld Bank is : "Contagion is the cross-country transmission of shocks
or the general cross-country spillover effects. Contagion can take place both during ’good’ times and ’bad’ times.
Then, contagion does not need to be related to crises. However, contagion has been emphasized during crisis
times". During the past decades, there have been several empirical studies which seek to analyze the contagion
and the cross-country economic comovement via real transmission channels or through a financial links or both.
By real sector channel, and as been identified by the theoretical and empirical literatures, shocks
propa-gate through trade, foreign direct investment (FDI), policy coordination, country evaluation, and unexpected
shocks in global economic. In addition, the correlated information, the correlated liquidity and the portfolio
rebalancing are considered as the main channels of financial linkages through which cross-country shocks could
affect an equity market (see Kodres and Pritsker, 1999).
In our paper we adopt the definition of contagion introduced by Forbes and Rigobon (2002) and we define
the contagion as a significant increase in cross-market comovement after a shock occurred in one country. With
respect to this definition, the condition for contagion is a significant increase in comovements as a result of a
shock in one market. This implies, if two markets display a high degree of comovement during the stability
period, even if they are highly correlated during a crisis, if this crisis-correlation shift is not significant it
does not amount to contagion. In the absence of a significant correlation during the crisis-period, the term
’interdependence’ is used to qualify the situation between the two markets.
Let Xt andYtbe time series representing stock market returns following the relationship (cf. Forbes and
Rigobon, 2002):
Yt=α+βXt+ǫt (9)
where αandβ are constants, ǫtrepresents the error terms. The correlation coefficient between Xt and Yt is
defined as :
ρ=ρ(Xt, Yt) =Cov(Xt, Yt)
σxσy
:= σxy
σxσy
Following Forbes and Rigobon (2002), the correlation coefficient is adjusted by the transformation defined by:
ρ∗= ρ
p
1 +δ(1−ρ2) (11)
such that
δ= σ h x
σℓ x
−1 (12)
where δ denotes the change in high-period volatility against low-period volatility,σh
x and σxℓ the conditional
variances of stochastic variableXt in the high- and low-period volatility respectively. For the purpose of the
calculation of the adjusted correlation coefficient ρ∗, we assume that the turmoil-period is considered as high
volatility period and the stable period as the low volatility period. In our empirical analysis, the variableYt
represents Moroccan market returns data andXt the foreign market returns data for each considered pair of
countries in the previously estimated DCC-GARCH models.
To evaluate if there is significant increase in the unadjusted and adjusted correlation coefficients during the
crisis-period1, we use the hypothesis test :
H0: ρh=ρl
H1: ρh> ρl
(13)
where H0 is the null hypothesis of no-contagion (N), H1 is the alternative hypothesis for the presence of
contagion (C), and ρh and ρl represent the correlation coefficients in high and low volatility periods. The
hypotheses are tested using the Collins and Biekpe (2003) t-test statistic defined by:
t= (ρh−ρl)
s
nh+nl−4
1−(ρh−ρl)2 (14)
which is distributed as t(α,nh+nl−4), nl (nh) indicates the number of observations during the low volatility
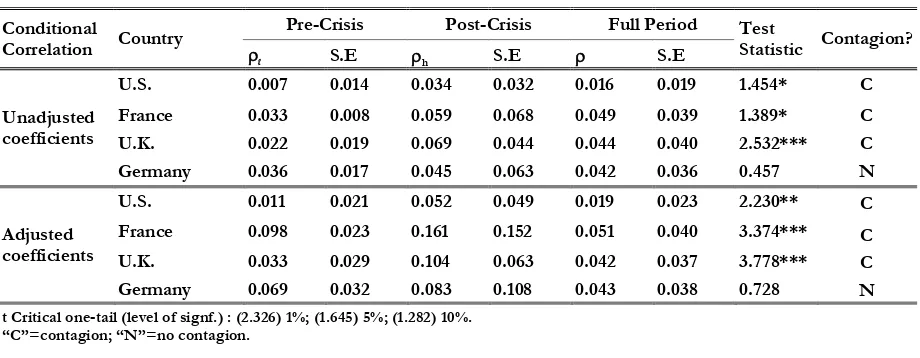
(high) period. In Table 1 we report respectively the estimated unadjusted and adjusted correlation coefficients
(ρl;ρh;ρ)for the pre-crisis (low volatility), post-crisis (high volatility) and full-period calculated using DCC bivariate-GARCH. The test statistics and results are reported on the right of table. According to the testing
results, we find evidence of contagion from most of the countries except from Germany (see Table 1). Further,
the tests with adjusted correlation coefficient give clear evidence of contagion from U.S., U.K. and France.
The fundamental linkages (trade integration and financial connectivity) between Morocco and France/U.K.
economies, and the effect of the collective behavior (herding and financial panics) after the occurrence of the
last U.S. crisis can explain the shift-contagion under the DCC model.
Conditional
Correlation Country
Pre-Crisis Post-Crisis Full Period Test
Statistic Contagion?
l S.E h S.E S.E
Unadjusted coefficients
U.S. 0.007 0.014 0.034 0.032 0.016 0.019 1.454* C France 0.033 0.008 0.059 0.068 0.049 0.039 1.389* C U.K. 0.022 0.019 0.069 0.044 0.044 0.040 2.532*** C Germany 0.036 0.017 0.045 0.063 0.042 0.036 0.457 N
Adjusted coefficients
U.S. 0.011 0.021 0.052 0.049 0.019 0.023 2.230** C France 0.098 0.023 0.161 0.152 0.051 0.040 3.374*** C U.K. 0.033 0.029 0.104 0.063 0.042 0.037 3.778*** C Germany 0.069 0.032 0.083 0.108 0.043 0.038 0.728 N
t Critical one-tail (level of signf.) : (2.326) 1%; (1.645) 5%; (1.282) 10%. “C”=contagion; “N”=no contagion.
[image:10.612.86.546.100.279.2]
Table 1: Contagion test in the Moroccan stock market during the global financial crisis
3.2
Discussions
This section discusses the results obtained from the implementation of the DCC model outlined in the
method-ology. We present at first the empirical results obtained by country and we conclude by providing a brief
comparison of results (see Tables 1, A2-A3) according to the correlation corrected version of Forbes and
Rigobon (2002).
Morocco-U.S.: The DCC-GARCH results provide evidence of contagion from the U.S. financial market to
the Moroccan one. This consistent finding provides evidence in favor of volatility linkage between the Moroccan
stock market and the U.S. stock Market.
Morocco-France: From the DCC-GARCH results we find evidence to the presence of a shift in comovement
in stock market returns between France and Morocco in the crisis-period. Likewise here, we also find evidence of
volatility linkage between the Moroccan stock market and the French one. The real and financial transmission
channels as an explanation of the nature of contagion appears more relevant for this case.
Morocco-U.K.: The DCC-GARCH results indicate that the comovement of the Moroccan and the U.K.
markets was higher after the subprime crisis. This can be explained by the significant impact of the subprime
crisis on the U.K. market, and the increasing integration of the Moroccan and the U.K. stock markets.
Morocco-Germany: The DCC-GARCH results implies that there is no contagion from the German stock
market to the Moroccan one. Thing to note about this result is that it can be related to fact that the financial
contagion resulting from the U.S. subprime crisis was less important in Germany in comparison with the case
of France and U.K.(see Horta et al. (2008)).
better captured by adjusted estimated conditional correlation coefficient. Our results are in line with the
evidence of Collins and Biekpe (2002) and Lagoarde-Segot and Lucey (2009) concerning contagion in Morocco.
4
Conclusion
The current international financial crisis which started in U.S. has revealed a high interdependence between
financial markets worldwide. The aim of this paper focuses to investigate empirically the comovements between
the Moroccan stock market and the France, Germany, U.K. and U.S. stock markets over the period of 2002-2012.
The paper contributes to the literature of contagion among the financial markets around the financial crisis of
2007-2009. Then, tow flexible multivariate models were applied (CCC, and DCC) to examine the contagion
from U.S., France, U.K and Germany to Morocco. The restrictive assumption of constant correlations (CCC)
was rejected by the data.
The empirical results of our paper suggest that it is important to highlight the correlation of the Moroccan
stock market with those of U.S., U.K. and France. The presence of a significant comovements between the
considered economic partners and Morocco was pointed. Furthermore, we find that bad news about economic
partners of Morocco can in fact generate contagion in the local stock market.
Given these latter findings, it is apparent that the recent global financial crisis leads to increase the financial
linkages between Moroccan market and the other considered markets. This rising integration can be usefully
considered by the international investors in their trading strategy which consists of taking a position in one
market following the signals given by the volatility of another market. A good understanding of the contagion
effect is an important ingredient for designing trading and hedging strategies and optimizing portfolios.
Some promising issues to develop in our future research concern the assessment of integration degree of
Moroccan financial market within International markets using the co-integration techniques. Other interesting
perspectives concern the detecting of changing regime in the Moroccan stock index volatility using other
References
[1] Baillie, R.T. and Bollerslev, T. (1991). Intra-Day and Inter-Market Volatility in Foreign Exchange Rates.
Review of Economic StudiesVol.58, 565-585.
[2] Bhar, R. and Hamori, S. (2003). New Evidence of Linkages among G-7 Stock Markets. Finance Letters,
Vol.1, 35–40.
[3] Bollerslev, T. (1986). Generalized autoregressive conditional heteroskedasticity.Journal of Econometrics,
Vol.31, 307–327.
[4] Bollerslev, T. and Wooldridge, M. (1992). Quasi-Maximum Likelihood Estimation and Inference in
Dy-namic Models with Time-Varying Covariances.Econometric Reviews, Vol.11, 143-172.
[5] Collins D., and Biekpe, N. (2003). Contagion: a fear for African equity markets?.Journal of Economics
and Business, Vol.55, 285–297.
[6] Edwards S. and Susmel, R. (2001). Volatility dependence and contagion in emerging equity markets.
Journal of Development Economics, Vol.66(2), 505-532.
[7] Eichengreen, B, Rose, AK & Wyplosz, C. (1996). Contagious currency crises.NBER Working Paper, 5681.
[8] El Ghini, A. & Saidi, Y. (2013). Return and Volatility Spillovers in the Moroccan Stock Market During
The Financial Crisis.Working Paper.
[9] Engle, R.F. (1982). Autoregressive conditional heteroscedasticity with estimates of the variance of United
Kingdom inflation.Econometrica, Vol.50(4), 987–1007.
[10] Engle, R.F. (2002). Dynamic conditional correlation: A simple class of multivariate generalized
autore-gressive conditional heteroskedasticity models. Journal of Business and Economic Statistics, Vol. 20,
339–350.
[11] Engle, R. F. and Kroner F. K. (1995). Multivariate Simultaneous Generalized ARCH.Econometric Theory,
Vol.11, 122–150.
[12] Forbes, K, & Rigobon, R. (2002). No contagion, only interdependence: Measuring stock market
comove-ment.The Journal of Finance, Vol.57, 2223-2261.
[13] Guo, F., Chen, C.R., Huang, Y.S. (2011). Markets contagion during financial crisis: A regime-switching
approach.International Review of Economics and Finance, Vol.20, 95–109
[14] Hamao, Y., Masulis, R. & Ng, V. (1990). Correlations in price changes and volatility across international
stock markets. Review of Financial Studies, Vol.3, 281–307.
[16] Horta, P., Mendes, C., Vieira, I (2008). Contagion effects of the US Subprime Crisis on Developed
Coun-tries.CEFAGEUE Working Paper, 2008.
[17] Kenourgios, D., Samitas, A., Paltalidis, N. (2011). Financial crises and stock market contagion in a
multivariate time-varying asymmetric framework.Journal of International Financial Markets, Institutions
and Money, Vol.21, 92–106.
[18] King, M, & Wadhwani S. (1990). Transmission of volatility between stock markets.The Review of Financial
Studies,3, 5–33.
[19] Kodres, L.E., and Pritsker, M. (1999). A Rational Expectations Model of Financial Contagion. FEDS
Working Paper 1998-48, The Federal Reserve Board.
[20] Johansson, A.C. (2011). Financial Markets in East Asia and Europe during the Global Financial Crisis.
The World Economy, 2011, 1088–1105.
[21] Lagoarde-segot T., Lucey B.M. (2009). Shift-contagion vulnerability in the MENA stock markets. The
World Economy, Vol.32(10), 1478–1497.
[22] Lee, S. B., & Kim, K. J. (1993). Does the October 1987 crash strengthen the co-movements among national
stocks markets? Review of Financial Economics,3, 89–102.
[23] Longin, F. & Solnik, B. (2001). Extreme correlation of international equity markets. The Journal of
Finance, Vol.56 (2), 649–676.
[24] Longstaff, F.A. (2011). The subprime credit crisis and contagion in financial markets.Journal of Financial
Economics,97, 436–450.
[25] Neaime, S. (2012). The global financial crisis, financial linkages and correlations in returns and volatilities
in emerging MENA stock markets.Emerging Markets Review, 268–282.
[26] Silvennoinen, A. & Teräsvirta, T. (2009). Modeling Multivariate Autoregressive Conditional
Heteroskedas-ticity with the Double Smooth Transition Conditional Correlation GARCH Model.Journal of Financial
Econometrics, Society for Financial Econometrics, Vol.7(4), 373–411.
[27] Tse, Y. K., Tsui, A. K. C., 2002. A multivariate generalized autorregressive conditional heteroscedasticity
-8 -4 0 4 8 12
02 03 04 05 06 07 08 09 10 11 12
MASI
-15 -10 -5 0 5 10 15
02 03 04 05 06 07 08 09 10 11 12
NASDAQ
-10 -5 0 5 10 15
02 03 04 05 06 07 08 09 10 11 12
CAC
-10 -5 0 5 10
02 03 04 05 06 07 08 09 10 11 12
FTSE
-8 -4 0 4 8 12
02 03 04 05 06 07 08 09 10 11 12
Panel 2 : Daily Stock Market Indices
400 800 1,200 1,600 2,000 2,400 2,800 3,20002 03 04 05 06 07 08 09 10 11 12
NASDAQ 2,000 4,000 6,000 8,000 10,000 12,000 14,000 16,000
02 03 04 05 06 07 08 09 10 11 12
MASI 2,000 2,500 3,000 3,500 4,000 4,500 5,000 5,500 6,000 6,500
02 03 04 05 06 07 08 09 10 11 12
CAC 3,200 3,600 4,000 4,400 4,800 5,200 5,600 6,000 6,400 6,800
02 03 04 05 06 07 08 09 10 11 12
FTSE 2,000 3,000 4,000 5,000 6,000 7,000 8,000 9,000
02 03 04 05 06 07 08 09 10 11 12
MASI NASDAQ CAC FTSE DAX
Mean 0.035 0.022 -0.008 0.004 0.014
Median 0.019 0.044 0.000 0.000 0.044
Maximum 8.192 13.588 10.595 9.384 10.797 Minimum -7.435 -11.115 -9.472 -9.265 -7.433 Std. Dev. 0.859 1.617 1.556 1.280 1.595 Skewness -0.163 0.259 0.084 -0.122 0.059 Kurtosis 14.235 9.392 8.275 9.864 7.688 Jarque-Bera 15096.8*** 4914.3*** 3328.9*** 5637.3*** 2627.4*** Ljung-Box Q(24) 169.1*** 47.8*** 70.4*** 92.0*** 35.6* Ljung-Box Q2(24) 820.4*** 1991.7*** 2856.7*** 3702.1*** 3118.2*** ADF -42.6*** -58.5*** -26.8*** -26.0*** -54.9*** PP -42.3*** -58.9*** -56.4*** -57.1*** -55.1*** ( Observations : 2868) Significance level: *** 1%, ** 5%, *10%
MASI NASDAQ CAC FTSE DAX
Mean 0.076 0.002 -0.005 -0.001 0.009
Median 0.054 0.022 0.000 0.000 0.045
Maximum 5.564 10.097 8.868 8.469 7.553
Minimum -5.017 -6.191 -7.077 -5.637 -7.433 Std. Dev. 0.824 1.544 1.379 1.148 1.498 Skewness -0.268 0.191 0.093 0.041 -0.049
Kurtosis 9.459 5.579 7.366 8.058 6.684
Jarque-Bera 3075.0*** 497.5*** 1397.9*** 1873.1*** 994.5*** Ljung-Box Q(24) 199.2*** 41.3** 78.5*** 102.9*** 57.4*** Ljung-Box Q2(24) 634.5*** 1605.1*** 1950.4*** 1394.7*** 2815.4*** ADF -30.2*** -45.8*** -44.2*** -27.8*** -44.7*** PP -30.0*** -46.0*** -44.9*** -47.1*** -44.8*** ( Observations : 1757) Significance level: *** 1%, ** 5%, *10%
MASI NASDAQ CAC FTSE DAX
Mean -0.031 0.052 -0.013 0.011 0.019
Median 0.000 0.062 0.000 0.001 0.041
Maximum 8.192 13.588 10.595 9.384 10.797 Minimum -7.435 -11.115 -9.472 -9.265 -7.336 Std. Dev. 0.908 1.725 1.801 1.466 1.738 Skewness -0.001 0.324 0.078 -0.247 0.167 Kurtosis 19.310 13.033 7.904 10.019 8.243 Jarque-Bera 12325.4*** 4683.5*** 1115.4*** 2293.9*** 1278.8*** Ljung-Box Q(24) 39.6** 28.3 41.8** 52.6*** 26.8 Ljung-Box Q2(24) 318.1*** 626.1*** 785.2*** 1269.1*** 893.9*** ADF -30.1*** -36.3*** -34.0*** -16.1*** -25.2*** PP -29.9*** -36.5*** -34.5*** -34.1*** -32.6*** (Observations : 1111) Significance level: *** 1%, ** 5%, *10%
[image:16.612.120.491.117.646.2]Post-Crisis Period
Table A.1 : Descriptive statistics of return series
(September 29, 2008 to December 31, 2012) (January 3, 2002 to September 26, 2008) (January 3, 2002 to December 31, 2012)
Full Period
Table A.2 : Bivariate DCC-GARCH model estimations - Pre-Crisis Period
Morocco-U.S. Morocco-France Morocco-U.K. Morocco-Germany
Coef. S.E. Coef. S.E. Coef. S.E. Coef. S.E.
Mean(1) -0.019* (0.011) -0.018 (0.011) -0.019* (0.011) -0.018 (0.011)
Mean(2) 0.037 (0.028) 0.055** (0.024) 0.034** (0.018) 0.076*** (0.025)
C(1) 0.050*** (0.005) 0.049*** (0.005) 0.005*** (0.005) 0.050*** (0.005)
C(2) 0.006** (0.003) 0.019*** (0.005) 0.011*** (0.003) 0.021*** (0.005)
A(1) 0.444*** (0.024) 0.442*** (0.024) 0.443*** (0.024) 0.443*** (0.024)
A(2) 0.036*** (0.007) 0.099*** (0.011) 0.111*** (0.013) 0.089*** (0.011)
B(1) 0.572*** (0.017) 0.574*** (0.017) 0.572*** (0.017) 0.573*** (0.017)
B(2) 0.962*** (0.007) 0.893*** (0.012) 0.883*** (0.013) 0.901*** (0.012)
DCC(1) 0.005 (0.012) 0.003 (0.009) 0.007 (0.010) 0.014 (0.029)
DCC(2) 0.947*** (0.194) 0.941** (0.413) 0.935*** (0.170) 0.694 (0.819)
Table A.3 : Bivariate DCC-GARCH model estimations - Post-Crisis Period
Morocco-U.S. Morocco-France Morocco-U.K. Morocco-Germany
Coef. S.E. Coef. S.E. Coef. S.E. Coef. S.E.
Mean(1) 0.016 (0.019) 0.016 (0.019) 0.015 (0.019) 0.016 (0.019)
Mean(2) 0.152*** (0.037) 0.067 (0.041) 0.057* (0.031) 0.092** (0.038)
C(1) 0.062*** (0.006) 0.062*** (0.006) 0.062*** (0.006) 0.062*** (0.006)
C(2) 0.070*** (0.015) 0.047*** (0.015) 0.021** (0.008) 0.022** (0.009)
A(1) 0.303*** (0.020) 0.303*** (0.020) 0.301*** (0.020) 0.303*** (0.020)
A(2) 0.087*** (0.015) 0.100*** (0.013) 0.098*** (0.014) 0.087*** (0.012)
B(1) 0.667*** (0.013) 0.667*** (0.013) 0.668*** (0.013) 0.667*** (0.013)
B(2) 0.886*** (0.019) 0.884*** (0.015) 0.890*** (0.014) 0.905*** (0.012)
DCC(1) 0.008 (0.014) 0.017 (0.014) 0.048 (0.038) 0.015 (0.011)
[image:17.612.131.499.467.628.2]Table A.4 : Bivariate CCC-GARCH model estimations - Pre-Crisis Period
Morocco-U.S. Morocco-France Morocco-U.K. Morocco-Germany
Coef. S.E. Coef. S.E. Coef. S.E. Coef. S.E.
Mean(1) -0.019 (0.012) -0.019 (0.012) -0.019 (0.012) -0.018 (0.012) Mean(2) 0.037 (0.027) 0.055** (0.022) 0.040** (0.017) 0.076*** (0.022) C(1) 0.049*** (0.009) 0.049*** (0.009) 0.049*** (0.009) 0.049*** (0.008) C(2) 0.006*** (0.001) 0.019*** (0.005) 0.011*** (0.003) 0.021*** (0.004) A(1) 0.443*** (0.051) 0.441*** (0.052) 0.442*** (0.046) 0.441*** (0.051) A(2) 0.036*** (0.001) 0.098*** (0.004) 0.111*** (0.005) 0.089*** (0.004) B(1) 0.573*** (0.039) 0.574*** (0.040) 0.573*** (0.038) 0.574*** (0.039) B(2) 0.962*** (0.001) 0.893*** (0.005) 0.884*** (0.003) 0.901*** (0.003) R(2.1) -0.005 (0.024) 0.021 (0.024) 0.003 (0.024) 0.037 (0.024)
Table A.5 : Bivariate CCC-GARCH model estimations - Post-Crisis Period
Morocco-U.S. Morocco-France Morocco-U.K. Morocco-Germany
Coef. S.E. Coef. S.E. Coef. S.E. Coef. S.E.
[image:18.612.127.492.451.598.2]