DEVELOPMENT AND VALIDATION OF UV SPECTROMETRIC
METHOD FOR QUANTITATIVE DETERMINATION OF
ENOXAPARIN SODIUM IN BULK AND INJECTABLE
Prasanthi Chengalva* and Aruna Gundala
Department of Pharmaceutical Analysis, Krishna Teja Pharmacy College, Tirupati-517506,
Andhra Pradesh, India.
ABSTRACT
A simple and rapid UV spectrophotometric method was developed for
the estimation of Enoxaparin sodium. The absorption maximum for the
drug was observed at 219 nm in 0.1N sodium hydroxide. Linearity was
obtained in the concentration range of 5-15 μg/ml. The % recovery of
the proposed method was found to be 99.73%-101.52%. The values of
% RSD precision studies were found to be <2.0%. Limits of detection
and quantitation were found to be 0.179 μg/ml and 5.455 μg/ml
respectively. The method was successfully applied for the estimation
of Enoxaparin sodium in bulk and injectable dosage form.
KEYWORDS: Enoxaparin sodium, 0.1N sodium hydroxide, UV
spectrometry, Method development, Validation.
INTRODUCTION
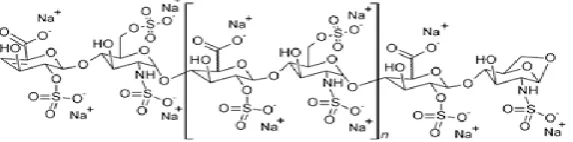
Enoxaparin sodium (ES) is the sodium salt of a low-molecular-mass heparin[1] (figure 1). It is
official in EP[1], IP[2], BP[3] and USP.[4] It is white or pale-colored amorphous powder, freely
soluble in water and insoluble in benzene, acetone, chloroform and ether. The mechanism of
action of ES is anti-thrombin dependent. It acts mainly by accelerating the rate of the
neutralization of certain activated coagulation factors by anti-thrombin, but other mechanisms
may also be involved. Its antithrombotic effect is well correlated to the inhibition of factor
Xa. ES is an anticoagulant that helps prevent the formation of blood clots. It is used to treat or
prevent a type of blood clot called deep vein thrombosis (DVT), which can lead to blood
clots in the lungs (pulmonary embolism). It is also used to prevent blood vessel complications
in people with certain types of angina or heart attack. Extensive literature review revealed an
Volume 6, Issue 16, 1517-1523. Research Article ISSN 2277– 7105
Article Received on 17 October 2017,
Revised on 07 Nov. 2017, Accepted on 27 Nov. 2017
DOI: 10.20959/wjpr201716-10331
*Corresponding Author
Prasanthi Chengalva
Department of
Pharmaceutical Analysis,
Krishna Teja Pharmacy
College, Tirupati-517506,
RP-HPLC method developed for the estimation of ES.[5] But there was no UV spectrometric
method reported. Hence the aim of the present study was to develop and validate a fast,
simple, selective, sensitive and inexpensive UV spectrophotometric method for the
[image:2.595.156.443.172.243.2]quantitative estimation of ES in injectable dosage form.
Figure 1: Enoxaparin sodium.
MATERIALS AND METHODS
Apparatus
A single beam Agilent Cary 8454 and Analytical Technologies LTD Spectro 2060 plus
UV-visible spectrophotometers were used.
Reagents and solutions
ES was obtained as gift sample from authentic source. Analytical reagent grade water was
used. All chemicals were of analytical reagent grade and solutions were prepared with 0.1N
sodium hydroxide of I.P grade.
Sodium hydroxide (0.1 N)
Sodium hydroxide solution was prepared by dissolving 4 mg of sodium hydroxide in purified
water and making the volume to 1000ml with purified water.
Preparation of standard solution (10 µg/ml)
Standard solution of ES was prepared by taking 10 mg of ES into 100 ml volumetric flask
containing 0.1N sodium hydroxide sonicated for 15 minutes and volume was made up to the
mark with 0.1N sodium hydroxide (stock solution). From the above solution 1 ml was
pipetted out in to 10 ml volumetric flask and made up to the volume with 0.1N sodium
hydroxide to get 10 μg/ml of ES. For test solution volume of injection equivalent to 1 mg of
drug has been dissolved in 10 ml 0.1N sodium hydroxide. From the above sample solution 1
ml was pipetted out in 10 ml volumetric flask and the volume was made up to the mark with
0.1N sodium hydroxide. All the measurements were carried out at 219 nm which corresponds
Figure2: UV spectrum of standard solution (10 µg/ml).
Optimization of parameters
All the optimization parameters are estimated at room temperature. ES was found to yield
clear colorless solution with 0.1N sodium hydroxide, showing absorbance maxima at 219 nm.
The influence of the concentration as well as volume of solvent on the reaction has been
studied. Different concentrations and different volumes were tried for all the solvents. The
optimum concentration and volume were selected on the basis of their ability to give
maximum absorbance. Also the stability of newly formed complex was measured and was
found to be stable for 3 days.
Procedure for calibration curve
Standard stock solution of ES was further diluted to get concentration in the range of 5-15
μg/ml The resultant absorbances of the solutions were measured at 219 nm against 0.1N
sodium hydroxide as blank.
RESULTS AND DISCUSSION
The developed method was validated according to ICH guidelines.[6] The proposed method
was validated in terms of accuracy, precision, linearity, LOD, LOQ, robustness and the
results are recorded.
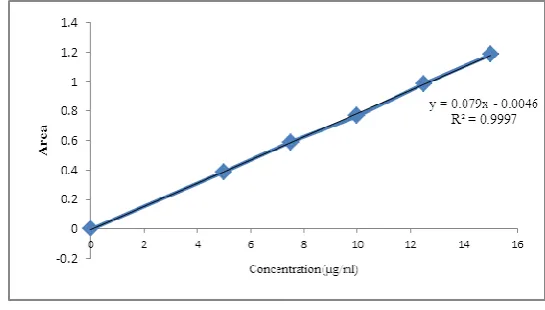
Linearity
The proposed spectroscopic method was found to be linear in the range of 5 to 15 μg/ml with
correlation coefficient (R2) was 0.9997 (figure 3), slope 0.079 and intercept (C) 0.0046 as
Figure3: Calibration curve of ES.
Table 1: Results of quantitative determination of ES.
S. No. Parameters Results
1. 2. 3. 4. 5. 6. 7.
Absorbance maximum (nm) Linearity and Range (µg/ml) Slope Correlation coefficient Y-intercept LOD (µg/ml) LOQ(µg/ml) 219 5–15 0.079 0.9997 0.0046 0.179 5.455 Accuracy
The accuracy of the method was determined by performing recovery studies by standard
addition method in which pre-analyzed samples were taken and standard drug was added at
three different levels. Values of recovery±SD greater than 99-102% indicate that the
proposed method was accurate for the analysis of drug and the results were reported in table
2.
Table 2: Results of accuracy studies of proposed method.
Level Amount of standard added
(µg/ml)
Pre-analysed sample
(µg/ml) % Recovery*
50 % 100 % 150 % 5 10 15 10 10 10 99.73±0.02 101.09±0.03 101.52±0.01 *n = 3 (triplicate measurements).
Precision
The precision of the proposed method was estimated in terms of inter-day precision and
intraday precision wherein the method was repeated on three different days and repeated for
[image:4.595.159.432.72.227.2]indicating % RSD of less than 2% at each level clearly indicate that the proposed method was
precise enough for the analysis of drug. The reproducibility of the method was confirmed by
performing the proposed method by three different analysts. The values of % RSD less than
2% indicate that the proposed method was reproducible for the analysis of ES. This reveals
the potential utility of this developed method for the routine analysis of ES in pharmaceutical
preparations.
Table 3: Results of precision studies.
Conc (µg/ml) Intraday precision (% RSD)* Interday precision (%RSD)*
10 0.55±0.02 Day 1 Day 2
0.12±0.02 0.35±0.02
*n = 6measurements.
Table 4: Results of precision studies.
Conc (µg/ml) Inter analyst precision (%RSD)*
10 Analyst 1 Analyst 2
0.512±0.02 0.692±0.02
*n = 6 measurements.
LOD and LOQ
The LOD and LOQ of ES were determined from calibration curve. The LOD and LOQ of the
proposed method were found to be 0.179 µg/ml and 5.455 µg/ml respectively.
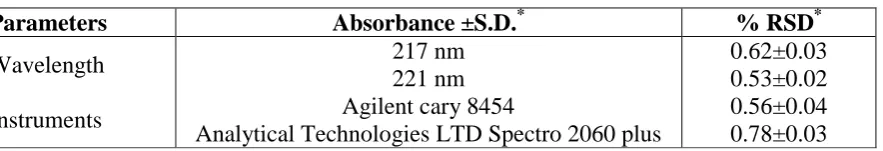
Robustness
The robustness of the proposed method was evaluated by varying method parameters such as
wavelengths (217 nm, 221 nm) and instruments (Agilent cary 8454 UV-visible
spectrophotometer, Analytical Technologies LTD Spectro 2060 plus). The robustness was
assessed by analyzing standard solution of 10 μg/ml. The % RSD was calculated. The low
values of % RSD obtained after small deliberate changes of conditions indicates that the
[image:5.595.84.526.665.740.2]method was robust and the results were presented in table 5.
Table 5: Results of robustness studies.
Parameters Absorbance ±S.D.* % RSD*
Wavelength
Instruments
217 nm 221 nm Agilent cary 8454
Analytical Technologies LTD Spectro 2060 plus
Formulation studies
The injectable containing 10 µg/ml of ES was prepared and analysed. The content of ES in
injectable was found to be 99.68% and the results were presented in table 6.
Table 6: Results of analysis of Injectable.
Conc (µg/ml) Absorbance* Label claim (mg) Amount obtained* % Assay*
10 0.77±0.01 10 9.84±0.2 99.68±0.13
*n = 6 measurements.
The proposed UV method was simple, sensitive, accurate, precise and robust. The proposed
method was inexpensive and do not require any sophisticated apparatus in contrast to
chromatographic methods. The method can be used for routine quality control analysis of the
formulation containing ES.
CONCLUSION
A new, simple and selective spectrophotometric method was developed for the analysis of ES
in bulk and in pharmaceutical formulation. The developed method was also validated and
from the statistical data, it was found that method was simple, rapid, accurate, precise and
reproducible that can be successfully applied to the pharmaceutical formulation without
interference of excipients.
CONFLICT OF INTERESTS
Declared none.
REFERENCES
1. European pharmacopeia. Council of Europe, 67075, Strasbourg cedex, France, 2014;
I(II): III.
2. Indian Pharmacopoeia. Controller of Publication, Delhi, 2014; I(II): III.
3. British Pharmacopoeia. Her Majesty’s Stationary Office, London, 2014; I(II): III.
4. United States Pharmacopoeia. US Pharmaceutical Convention Inc., Rockville, 2014; I(II):
III.
5. Babu, Bujji N, Srinivasulu R, Raju, Ramesh R. Simultaneous analysis of RPHPLC
Method development and validation of Enoxaparin sodium and Sitaglipitin drugs in
6. International conference on harmonization of technical requirements for registration of
pharmaceuticals for human use. Validation of analytical procedures; Text and