FORMULATION, OPTIMIZATION AND DEVELOPMENT OF
ALBENDAZOLE TABLET FOR THE IMPROVEMENT OF ORAL
BIOAVAILABILITY
*Hanmant B. Salunkhe1, Karmude K. T.2, Gurav Y. A.1 and Sandeep Walasangikar1
1
Gourishankar Institutes of Pharmaceutical Education and Research Centre, Limb, Satara.
2
Maharashtra College of Pharmacy Nilanga.
ABSTRACT
Albendazole is a benzimidazole carbamate with a broad anti-parasitic
spectrum. Albendazole was first approved for treatment of helminth
infections in sheep in 1977, and subsequently approved for human use
in 1983. In general, most ascariasis, trichuriasis, enterobiasis and
hookworm infections can be successfully treated with single dose
Albendazole and strongyloidiasis with multiple doses of Albendazole.
The increase in bioavailability is possible by in vitro drug dissolution
method. The physicochemical property of most drugs that has greatest
influence on their absorption characteristics from the GIT is
dissolution rate. The in vivo test is extremely costly, tedious, time
consuming besides exposing the healthy subject to hazards of drug. The in vitro method is
inexpensive. The best available tool today which can at least quantitatively assure about the
biological availability of a drug from its formulation is its in vitro dissolution test.
Enhancement of bioavailability of hydrophobic drugs is one of the major challenges in drug
development of the plethora of pharmaceutical technologies available to address this issue
viz. micronization, the use of surfactants.
KEYWORDS: Micronization, Surfactant, superdisintegrants.
INTRODUCTION
Oral route has been the commonly adopted and most convenient route for the drug delivery.
Oral route of administration has been received more attention in the pharmaceutical field
because of the more flexibility in the designing of dosage form than drug delivery design for
Volume 5, Issue 8, 1170-1181. Research Article ISSN 2277– 7105
*Corresponding Author Hanmant B. Salunkhe
Gourishankar Institutes of
Pharmaceutical Education
and Research Centre, Limb,
Satara.
Article Received on 14 June 2016,
Revised on 03 July 2016, Accepted on 24 July 2016
other routes. The oral drug delivery design depends on various factors such as type of
delivery system, the disease being treated, and patient, also the length of the therapy and the
properties of the drug.[1]
In addition to this, oral route is preferable route because of patient acceptance, convenient to
administration and cost-effective manufacturing process. Drug substances most frequently are
administered orally by means of solid dosage form such as tablets and capsules.[2]
The other routes used for drug administration are parenteral route, topical route, rectal,
vaginal, etc. They are commonly called as per-oral routes.[3] Generally the oral route is the
choice of route for administration of the most of drugs. At least 90% of all drugs used to
produce systemic effects are administered by oral route as it is safe and convenient and easy
to administer by this route. Other drugs follow topical route of administration is limited in its
ability to allow effective drug administration for systemic drug action. The parenteral route of
administration is important in treating medical emergencies in which subject cannot swallow
and in providing various types of maintenance therapy for hospitalized patients. Various
solids as well as liquid dosage forms such as tablets, capsules, powders, pills, syrups, elixirs,
solutions, suspensions, emulsions, etc. are administered by oral route. Amongst the various
oral dosage forms, tablets are mostly acceptable and preferred by the patient. The tablet
represents unit dosage form in which one usual dose of the drug has been accurately placed,
but when compared with liquid oral dosage forms such as syrups, suspensions, emulsions,
solutions and elixirs are contain one dose of medication in 5-30 ml. In liquid dosage form
patient ask to measure his or her own medication using a teaspoon, tablespoon or other
measuring device, such dosage measurements are typically in error, when drug is
self-administered by the patient. Liquid oral dosage form have other disadvantages and the
limitations when compared with tablets such as it is more expensive to ship, breakage and
leakage during shipment, taste masking of the drug is another problem in liquid dosage form.
Drugs are in general less stable in liquid form than in dry state and its expiration date tends to
be shorter. Tablets offer various advantages such as the greatest dose precision and less
content variability, lowest cost compare to all other dosage form, lightest and most compact
of all oral dosage form, easiest and cheapest to package and ship of all dosage forms, large
scale production is possible and economical, high physical & chemical stability, masks the
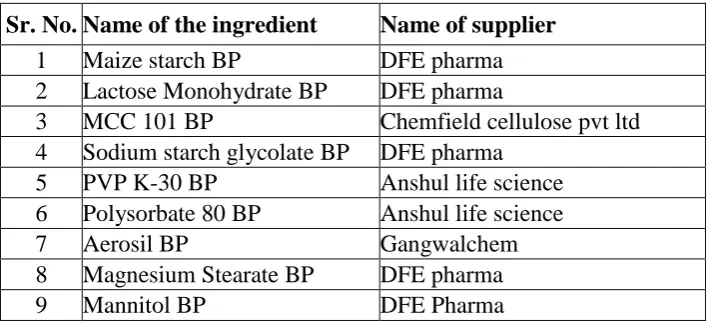
MATERIALS
Table 1: List of chemicals
Sr. No. Name of the ingredient Name of supplier
1 Maize starch BP DFE pharma
2 Lactose Monohydrate BP DFE pharma
3 MCC 101 BP Chemfield cellulose pvt ltd
4 Sodium starch glycolate BP DFE pharma
5 PVP K-30 BP Anshul life science
6 Polysorbate 80 BP Anshul life science
7 Aerosil BP Gangwalchem
8 Magnesium Stearate BP DFE pharma
9 Mannitol BP DFE Pharma
Equipments
Table 2: List of Equipments
Sr No. Name of equipment Model
1 Single pan electronic balance S. R. electronics
2 Modified physical balance ….
3 8 station tablet compression machine Ahan
4 Hardness tester Monsanto
5 Friability tester Roche Friabilator
6 USP II dissolution apparatus Electro lab
7 Double beam UV Visible spectrophotometer Lab India Mumbai
8 Vernier caliper Monsanto
Preparation of Albendazole tablets
Sr.No. Ingredients Quantity in mg/tablet
F1 F2 F3 F4 F5 F6
1 Albendazole USP 400 400 400 400 400 400
2 PVP K 30 BP -- -- -- -- -- 32
3 Maize starch BP 25 25 25 25 25 30
4 Lactose Monohydrate BP 250.9 98.5 224.9 -- 269.5 269.5
5 MCC 101 BP 98.5 250.9 124.5 87.5 80.9 26
6 Mannitol BP -- -- -- 261.9 -- --
6 Sodium starch Glycolate BP -- -- 29 -- -- 45
7 PVP K 30 BP 20 20 20 20 15 10
8 Polysorbate 80 BP -- -- -- -- 05 25
9 Water q.s q.s q.s q.s q.s q.s
10 Sodium Lauryl Sulfate BP 18 18 18 18 18 18
11 Aerosil BP 10 10 10 9 9 9
12 Sodium Starch Glycolate BP 69.6 69.6 40.6 69.6 69.6 27.5
13 Magnesium Stearate BP 8 8 8 8 8 8
[image:3.595.65.527.499.751.2] Weighing and Sifting: All the ingredient were separately weighed and sifted using mesh
no. 40 Albendazole. Maize starch, microcrystalline cellulose, PVP k-30, Lactose
monohydrate, Sodium Starch Glycolate, Sodium Lauryl Sulfate, sift through 30#, Aerosil
and magnesium stearate pass through 60#.
Dry Mixing: Mix the API with excipient for 15min in RMG.
Binder Preparation: Dissolve PVP K-30 in sufficient quantity of water.
Wet granulation: Add Binder solution in RMG with slow speed chopper and impeller and
mix for 10 min to form granule.
Drying: Dry the granule in tray drier till LOD reach below 2.0 %.
Blending and Lubrication: the dried granule transfer into blender and add SLS, SSG and
Aerosil in it and mix for 10 min. Finally add Magnesium stearate and mix for 3 minutes.
Compression: Compress the above blend in compression machine. Use punch 19.3 X 9.4
SC.
Preformulation study of powder blends a) Angle of repose
Angle of repose is defined as the maximum angle possible between the surface of pile of
powder and horizontal plane. Angle of repose has been used as indirect method of
quantifying powder flow ability. Angle of repose for blend of each formulation was
determined by fixed funnel method. The fixed funnel method employs a funnel that is
secured with its tip at given height, h, which was kept 2 cm, above graph paper that was
placed on a flat horizontal surface. With r, being the radius of base of conical pile, angle of
repose can be determined using following equation.
Tan θ = h/r ... 01
Where; θ = Angle of repose
r = Radius of the base
h =Height from tip of funnel to the surface of graph paper.
Table No.3 Grading of powder flow property according to angle of repose Angle of repose Flow Property
<25 Excellent
25 -30 Good
30 -40 Passable
b) Bulk density
It is the ratio of mass to bulk volume. It is required to decide the appropriate packing of
dosage forms. An accurately weighed 20 gm powder was allowed to flow in a fine stream
into a graduated cylinder and final volume was noted. The bulk density was obtained by
dividing the weight of the sample in grams by final volume in cm3and it was determined by
equation given below
Bulk density = Mass/ Bulk volume ... 02
c) Tapped density
An accurately weighed 20 gm powder was allowed to flow in a fine stream into a graduated
cylinder of a mechanical tapping device. The measuring cylinder was tapped for 100 times
and final tapped volume was noted. The tapped density was obtained by dividing the weight
of the sample in grams by final tapped volume in cm3and it was calculated by using equation
given below,
Tapped density = Mass/ Tapped volume ... 03
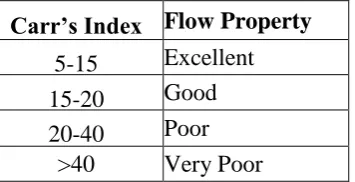
d) Compressibility index
It is also one of the simple methods to evaluate flow property of a powder by comparing the
bulk density and tapped density. The percentage compressibility of a powder is a direct
measure of the potential powder arch or bridge strength and stability. It is also known as
Carr’s index. It can be calculated by following equation.
[image:5.595.211.389.548.639.2]Carr’s index = (Tapped density- bulk density/ Tapped density) X 100 ……. 04
Table No.4 Grading of compressibility of powder according to Carr’s index Carr’s Index Flow Property
5-15 Excellent
15-20 Good
20-40 Poor
>40 Very Poor
From the bulk density and tapped density data, Carr’s index for powder blends of different
formulations was calculated.
e) Hausner’s ratio
Hausner found that the ratio of tapped density/bulk density was related to inter particle
powder with low inter particle friction had ratio of approximately 1.2, whereas more cohesive
less free flowing powders have Hausner’s ratio greater than 1.6. A Hausner’s ratio of less
than 1.25 indicates good flow properties of the powder blends or granules.
Hausner’s ratio = Tapped density/ bulk density ... 05
Hausner’s ratio for powder blends of different formulations were calculated from the
equation no. 05 given above.
Calibration curve
Calibration curve in 0.1N HCL
The stock solution was prepared by dissolving 100 mg of drug in and 100 ml 0.1N HCl to get
1000 µg/ml concentration solution. From the above solution, second stock solution prepared
diluting 1ml in 100 ml water to get 10 µg/ml. from this adequate aliquots were removed and
diluted suitably to acquire final concentration from 1 to 10 µg/ml. All the solutions were
scanned through double beam UV visible Spectrophotometer (Labindia, Mumbai) and
Drug-excipients compatibility study
Infrared spectroscopy is one of the most powerful analytical techniques which offer the
possibility of chemical identification. This technique when coupled with intensity
measurements may be used for quantitative analysis. One of the most important advantages
of IR over the other usual methods of structural analysis is that it provides useful information
about the structure of molecule quickly without tiresome evaluation methods. The technique
is based upon the simple fact that a chemical substance shows marked selective absorption in
the IR region. After absorption of IR radiation the molecules of chemical substance vibrates
at many rates of vibration, giving rise to close packed absorption bands, called IR absorption
spectrum which may extend over wide wavelength range. Various bands will be present in IR
spectrum which will correspond to the characteristic functional groups and bonds present in a
chemical substance. Thus, an IR spectrum of a chemical substance is a fingerprint for its
identification.
Evaluation Studies on Albendazole Tablet a) Hardness
Tablets should be sufficiently hard to resist breaking during normal handling and yet soft
Monsanto hardness tester. The hardness was measured in terms of kg/cm2.
b) Thickness
Three tablets from each batch of formulation were collected and the thicknesses of the tablets
were measured with the help of vernier caliper. The average thickness was calculated.
c) Friability
Tablet hardness is not an absolute indicator of strength, since some formulation compressed
into very hard tablet tend to cap on attrition losing their crown portion. Therefore
another measure of tablet strengths, its friability is often measured. The Roche friability test
apparatus was used to determine the friability of the tablets. Twenty pre- weighed tablets
were placed in the apparatus and operated for 100 revolutions and then the tablets were
reweighed. The percentage friability was calculated according to the following formula
Initial Weight- Final Weight
%Friability = --- ×100 Initial Weight
d) Weight Variation
The weight of tablet is measured to ensure that a tablet contain the proper amount of drug.
Weight variation test was performed as per IP 2007.Twenty tablet were selected randomly
and weighed. Average weight of the tablet was determined. Not more than the two of the
individual weights deviate from the average weight by more than 5% percentage deviation.
Table No.5 USP standards for uniformity of weight
Sr. No. Average weight of tablet Percentage deviation
1 130 mg or less ±10
2 130 mg to 324mg ±7.5
3 324 mg to more ±5
e) Drug content Uniformity
Determine the absorbance of the standard solution and the test solution at the wavelength of
maximum and minimum absorbance at about 308 nm and 350 nm, using 0.1N NaOH as the
blank.
In-Vitro Release Studies
release of drug from tablets. The dissolution medium consisted of 900 ml of 0.1N HCl. The
release was performed at 37 ±0.5°C, at a rotation speed of 50 rpm. Samples (5 ML, at each
time) were withdrawn at pre-determined time intervals and replaced with fresh medium. The
samples were filtered through whatman filter paper no. 41 with appropriate dilutions with
Sodium hydroxide and were assayed spectrophotometrically at 308-350 nm.
RESULT AND DISCUSSION Identification of Drug Description
Albendazole is an odourless, white to off white powder.
Melting point of Albendazole
The melting point of Albendazole found to be in the range 208ºC to 210oC which complies
with reported value.
Calibration curve of Albendazole in 0.1N HCl
Calibration curve of Albendazole in 0.1 N HCl was found to be linear in the range of 4 to 28
μgm/ml and coefficient of correlation was found to be 0.946.
Figure: Calibration curve of Albendazole in 0.1N HCl using UV method
Fourier transform infrared spectroscopy
IR spectrum of Albendazole, was recorded on ATR Fourier Transform Infrared
Spectrophotometer (MIRacle 10). From overlay IR spectra it was observed that all peaks of
proved that this albendazole was a pure compound.
Evaluation of blender blend
Evaluation parameter like angle of repose, compressibility index and Hausner’s ratio of all
batches.
Batch
Angle of repose (Ɵ)
±SD
BD TD Compressibility
index
Hausner’s ratio
F1 20.92±0.47 0.52 0.61 14.75 1.17
F2 26.28±1.63 0.51 0.60 15 1.17
F3 22.77±0.43 0.51 0.58 12.06 1.13
F4 23.48±0.66 0.50 0.56 10.71 1.12
F5 25.86±0.44 0.52 0.57 8.71 1.09
F6 23.21±0.24 0.52 0.60 13.33 1.15
From the above result, it can be inferred that all batches show excellent flow properties i.e.
angle of repose less than 25. Compressibility of all batches found to be less than 18 indicating
good compression properties. Hausner’s ratio < 1.25 for all batches indicated good flow
properties.
Evaluation of tablet
Tablet properties like weight variation, hardness, friability, disintegration time and drug
Table No.07 Evaluation parameter of Tablet
Batch
Weight (mg) ±5.0%
Hardness (kg/cm2)
±1.0
Friability (%)
Disintegration time (min)
Drug content (%)
Thickness (mm)
F1 900.00 6 0.573 4.0 -6.0 95.13 5.6±0.2
F2 900.00 6 0.587 3.0 -5.0 96.16 5.6±0.2
F3 900.00 6 0.562 4.0 -5.0 95.14 5.6±0.2
F4 900.00 6 0.456 5.0 -6.0 96.45 5.6±0.2
F5 900.00 6 0.389 5.0 -6.0 97.46 5.6±0.2
F6 900.00 6 0.326 6.0 – 8.0 97.78 5.6±0.2
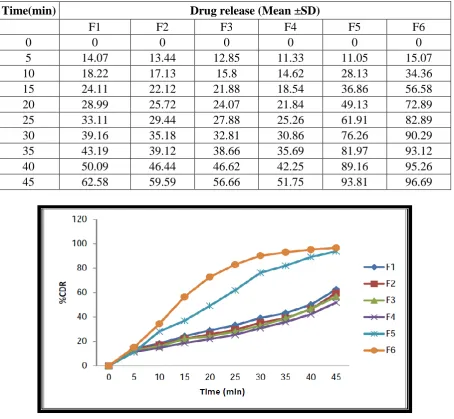
Dissolution test
The in-vitro dissolution studies were carried out using USP apparatus type II in 0.1 N HCl for
45 min (900ml) maintained at 370C±2.00C.
Time(min) Drug release (Mean ±SD)
F1 F2 F3 F4 F5 F6
0 0 0 0 0 0 0
5 14.07 13.44 12.85 11.33 11.05 15.07
10 18.22 17.13 15.8 14.62 28.13 34.36
15 24.11 22.12 21.88 18.54 36.86 56.58
20 28.99 25.72 24.07 21.84 49.13 72.89
25 33.11 29.44 27.88 25.26 61.91 82.89
30 39.16 35.18 32.81 30.86 76.26 90.29
35 43.19 39.12 38.66 35.69 81.97 93.12
40 50.09 46.44 46.62 42.25 89.16 95.26
[image:10.595.73.528.326.745.2]45 62.58 59.59 56.66 51.75 93.81 96.69
The tablet was prepared by using surfactant Sodium Lauryl Sulfate and Polysorbate 20
swelled by absorbing liquid medium and disintegrated within 10 min. 2% concentration SLS
and approximately 3% concentration of Polysorbate 20 of batch F6 was show 90.29% drug
release in 30 min.
CONCLUSION
The Present study was carried out to develop the Albendazole tablet by using surfactant
Sodium Lauryl Sulfate and Polysorbate 20. The formulation prepared with 2% Sodium
Lauryl Sulfate and approximately 3% Polysorbate 20 for improving dissolution than the
available marketed tablet. It was found that the release rate was found to be influenced by the
surfactant. It was concluded that the improving dissolution means improving bioavailability.
Tablet of poorly soluble drug Albendazole showed enhanced dissolution which may lead to
improved bioavailability and hence better patient compliance. Tablets of Albendazole can be
successfully prepared by wet granulation technique using Surfactant and superdisintegrants
for the better patient compliance and effective therapy. The relative efficiency of their
surfactant and superdisintegrants and dissolution rate of tablet was found in order.
REFERENCES
1. Vyas SP, Khar RK. Controlled drug delivery concepts and advances. Vallabh prakashan;
New Delhi. 2010; 155-195.
2. Lachman L, Herbert A, Lieberman HA, Kanig JL. The Theory and practice of industrial
pharmacy. Varghese publication house; Mumbai.3rd edi. 2005; 293-346,430-456.
3. Bramhankar DM, Jaiswal SB. Biopharmaceutics and pharmacokinetics a treatise. Vallabh
Prakashan, Delhi. 1995; 335-349, 397-408.
4. Aulton’s Pharmaceutics, The design and manufacture of medicines, 3rd edi. : 441-482.
5. Swarbrick J; Encyclopedia of pharmaceutical technology, Informa health care, New
York. Vol-I, 3rd edi. 1242-1264.
6. Jain NK.Pharmaceutical Product development. CBS publisher and distributors, New
Delhi: 61-112.
7. D.Rane, V. Patil, Formulation and evaluation of fast dissolving tablet of albendazole.
ICPJ 2012; 1(10): P 311-316.
8. S. anupama, Goyal N., Shrivastav Birendra, Formulation and optimization of solid
dispersion tablets of albendazole using response surface methodology. RJPBCS 2011;
9. C.P.Jain, C.S.Naruka, Formulation and evaluation of fast dissolving tablet of valsartan.
Int J Pharm Pharm Sci, 2009; 1(1): P 219-226.
10.S. Lal Khora, Bharat Paraskar,Rahul Purohit, Formulation development and evaluation of
chewable tablet of albendazole by different techniques. Int J Pharm Pharm Sci, 2012;
4(1): P 461-464.
11.M. Bansal,G. Garg ,Formulation and evaluation of immediate release tablet of
zaltoprofen. Sch. Acad. J. Pharm., 2013; 2(5): P398-405.
12.M.Gowtham, S.Vasant, Rohan RD, Formulation and evaluation of immediate release
folic acid tablet. Der Pharmacia Lettre, 2011; 3(6): P 157-162.
13.A.K.Tiwari, H.Shah,A. Rajpoot, Formulation and in vitro evaluation of immediate release
tablet of drotaverine hydrochloride. J. Chem. Pharm. Res., 2011; 3(4): P 333-341
14.Rowe RC, Sheskey PJ, Weller PJ. Handbook of pharmaceutical excipients. 6th edi.
London: Pharmaceutical press. 2012.