PREPARATION OF IN-VITRO EVALUATION OF PROLIPOSOME OF
NITROFURANTOIN
Hemant Kumar* and Mallikarjuna B. P.
IIMT College, Pharmacy Institute, Knowledge Park-II Greater Noida, Uttar Pradesh 201301.
ABSTRACT
The objective of any medication conveyance framework is to give
helpful measure of medication to the best possible site in the body and
furthermore to accomplish and keep up the ideal plasma centralization
of medication for a specific timeframe. In any case, inadequate arrival
of medication, shorter residence time of dosage form in the
gastrointestional tract and high hepatic first pass effect prompts lower
bioavailability. Such confinements of the regular doses structures have
cleared to a time of controlled and novel medication conveyance
frameworks. Nitrofurantoin is exceedingly steady to the improvement
of bacterial obstruction, a property thought to be because of its
assortment of instruments of activity. Nitrofurantoin is actuated by bacterial flavoproteins
(nitrofuran reductase) to dynamic decreased receptive intermediates that are thought to adjust
and harm ribosomal proteins or different macromolecules, particularly DNA, causing
hindrance of DNA, RNA, protein, and cell divider union. The general impact is restraint of
bacterial development or cell demise. Nitrofurantoin is suffering from some limitation such
as poor bioavailability, low solubility and very less half life. Before proliposomes
development, preformulation studies were carried out to describe the compound and physical
properties of medication substance. The FT-IR range of drug samples was found to be in
concordant with the reference chemical groups present in the structure of the Nitrofurantoin.
The standard curves of Nitrofurantoin were prepared DMF and the absorbance information
acquired exposed to direct relapse. The connection coefficients were observed for
Nitrofurantoin which is closed to one indicated for good linearity. The preformulation
consider (FT-IR range, UV range and liquefying point) results recommended that
Nitrofurantoin was unadulterated and great in quality and the estimation strategy was
observed to be very dependable, precise and appropriate for definition improvement.
Volume 8, Issue 10, 870-888. Research Article ISSN 2277– 7105
Article Received on 25 June 2019,
Revised on 15 July 2019, Accepted on 04 August 2019,
DOI: 10.20959/wjpr201910-15541
*Corresponding Author
Hemant Kumar
IIMT College, Pharmacy
Institute, Knowledge Park-II
Greater Noida, Uttar Pradesh
KEYWORDS: Nitofurantoin, preformulation, prelisosomes.
1. INTRODUCTION
The Liposome is gotten from Greek words: "Lipos" which means fat and "Soma" which
means body.[1] Out of all the novel medication conveyance frameworks, liposomes are
viewed as the best, explored and comprehensively.[2] A small scale circular vesicle
comprising of a watery center encased in phospholipid particles is known as liposome.
Medication atoms can be consolidated into the fluid stage or inside the lipid bilayer. They are
generally utilized as a vehicle for organization of supplements and pharmaceutical
medications to improve the security and viability of medication by diminishing the
reactions.[3] To enter the market, Liposomes should stay steady and flawless during the
capacity time frame and before achieving the focused on location to create restorative
activity. Notwithstanding, because of physical and compound flimsiness, liposomes are
generally flimsy colloidal frameworks.[4] Liposomal suspension may have constrained
timeframe of realistic usability and to defeat the soundness issue related with liposome,
another "star liposome" strategy is built up that can deliver liposomes immediately when
there is a need and without over the top control.[5] Professional liposomes (Proliposomes)
were found in 1986.[6] Expert liposomes are without dry streaming granular items that on
hydration or on contact with organic liquids in the body, structure liposomal scattering. They
are made out of water dissolvable permeable powder and phospholipid.[7] For delivering
business liposome items, Pro-liposome is a standout amongst the most broadly utilized and
financially savvy techniques. As they are accessible in dry powder structure, it's anything but
difficult to disperse, move, measure and store, making it an assorted framework. Liposomes
can either be framed in vivo by the impact of natural liquids in the body or in vitro utilizing
an appropriate hydrating liquid before the organization.[8] Dissolvability and bioavailability
issues of numerous medications can be overwhelmed by growing expert liposomal plans.
2. MATERIALS AND METHOD
Preformulation studies are the leading phase in the improvement of measurement shapes that
can be well-defined as “investigation of physical and chemical properties of a drug substance
alone and when it combines with excipients”.[10]
These physicochemical studies should
concentrate on properties of another compound that could influence the medication
comprehension of physicochemical properties of a drug is necessary that may at last give a
basis definition structure or bolster the requirement for atomic adjustment.[9]
The goals of preformulation are
To establish the necessary physiochemical parameters of new drug substances. To determine kinetic rate profile.
To establish physical characteristics.
To establish compatibility with common excipient.
Therefore, preformulation studies are compulsory to set up the identity and physicochemical
parameter[11] of selected drug combination Nitrofurantoin was subjected for following
investigations.
Organoleptic Properties UV- VIS spectroscopy FTIR spectroscopy Melting point Partition coefficient Solubility
3-PERFORMULATION STUDIES
The aim of preformulation studies is to investigate the physical and chemical properties of a
drug substance. The selected drug Nitrofurantoin was subjected for investigation of physical
characterization parameters such as.
Organoleptic properties UV-visible spectra FT-IR spectra Melting point Solubility
Partition coefficient
3.1. Organoleptic Properties
Organoleptic properties of drug Nitrofurantoin found to be as per I.P. monograph. The
Table 1: Organoleptic Properties of Nitrofurantoin.
Sr. no. Properties Inferences
1. Colour Yellowish
2. Odour Odourless
3. Form Crystalline
4. Taste Bitter
3.2. UV Spectroscopy
3.2.1. UV-visible spectroscopy
UV absorption maxima (λ max) of Nitrofurantoinin DMF was determined by using UV-visible
[image:4.595.126.456.281.441.2]spectrophotometer and shown in Figure 1 and Table 2. Drug exhibited maxima at 376 nm.
Figure 1: UV-visible spectrum of Nitrofurantoinin DMF.
Table 2: Absorption maxima (λ max) of Nitrofurantoin.
7.1. Preparation of standard curve of Nitrofurantoinin DMF
Table 2: Calibration curve of Nitrofurantoinin DMF (λmax = 376 nm).
S.No Concentration (μg/ml) Absorbance (mean ±SD)
1 1 0.097 ±0.001
2 2 0.162 ±0.003
3 3 0.247 ±0.001
4 4 0.323 ±0.002
5 5 0.399 ±0.003
6 6 0.479 ±0.004
7 7 0.561 ±0.006
8 8 0.628 ±0.001
9 9 0.714 ±0.003
10 10 0.812 ±0.0026
All values are expressed as mean ± SD; n = 3
Observed absorption maxima
Reported absorption maxima
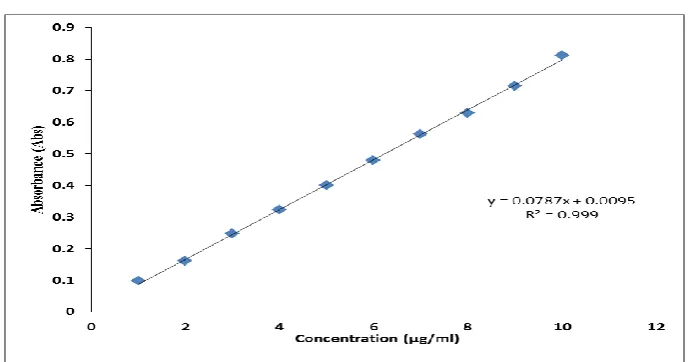
Figure 2: Graph of standard calibration curve of Nitrofurantoin in DMF.
Table 3: Result of regression analysis of UV method for estimation of Nitrofurantoin.
Statistical parameters Results
λ max 376 nm
Regression equation
** Y=mx+C Y=0.078x-0.009
Slope (b) 0.078
Intercept (C) 0.009
Correlation coefficient (r2) 0.999
The calibration curve for Nitrofurantoin was obtained by using the 1 to 10 µg/ml solution of
Nitrofurantoin in DMF. The absorbance was measured at 376 nm. The calibration curve of
Nitrofurantoin as shows in graph indicated the regression equation Y=0.078x-0.009 and R2
value 0.999, which shows good linearity.
7.1.3. Melting point determination
The liquefying purpose of a substance is the temperature at which the strong stage gets
converted to fluid stage under the one climate of weight.[12] The liquefying point
determination implies the purity of drug. Softening purpose of Nitrofurantoin was dictated by
narrow cylinder technique and was found to be quite similar to the reported melting point as
shown.
Table 4: Melting point of Nitrofurantoin.
Drug Reference M.P. Observed M.P.
Nitrofurantoin 261-263°C 265-269°C
Discussion: The melting point of Nitrofurantoin was found to be in range 265-269°C which
is of the pure drug. Hence drug sample was free from any type of impurities.
7.1.4. Partition coefficient determination
Segment coefficient of the Nitrofurantoin was resolvedusing n-octanol & water. Log P more
prominent than one demonstrates that the medication is lipophilic in nature, while those with
segment coefficients short of what one are characteristic of a hydrophilic medication.[13] This
showed the lipophilicity and immaculateness of medication.
Table 5: Partition coefficient determination of Nitrofurantoin.
Partition coefficient of drug Solvent system Log p Values
Nitrofurantoin n-octanol:water 1.39± 0.07
Value is communicated as mean± SD; n = 3
Discussion: The partition coefficient of Nitrofurantoin in n- Octanol: Water was found to be
1.39 this indicates that the drug is lipophillic in nature.
7.1.5. FT-IR spectral analysis
FT-IR investigation estimates the specific assimilation of light by the vibration methods of
explicit substance bonds in the sample. The FT-IR spectrum of Nitrofurantoin is shown in
[image:6.595.97.501.480.737.2]and interpretation of data is given.
Table 6: FT-IR interpretation data of Nitrofurantoin.
Observed peak (cm-1) Functional group
2367.98 HC=N bond
3276.75 N-H stretching
1725.79 C=O group
1516.12 N-O Asymmetric stretching
1107.84 C-O-C group
2855.57 C-H bond
The main infrared peaks of the Nitrofurantoin are as follows: The FTIR spectra of
Nitrofurantoinpure are given. The prominent peaks for various groups are N–H stretching at
3276.75 cm−1, HC=N bond at 2367.98 cm−1, C=O group at 1725.79 cm−1, N-O asymmetric stretching at 1516.12 cm−1, C-O-C group at 1107.84 cm−1 and C–H bond at 2855.57 cm−1.
The observed FT-IR spectrum confirmed and identified the presence of functional groups and
purity of the drug.
7.1.6. Drug-excipients compatibility study by FTIR
Figure 4: FTIR spectrum of physical mixture (Pure Nitrofurantoin + excipients).
The FTIR spectra of pure Nitrofurantoin showed characteristic peaks 2367.98 cm−1 at HC=N
bond, 3276.75 cm−1 at N-H stretching, 1725.79 cm−1 at C=O group, 1516.12 cm−1 at N-O
asymmetric stretching, 1107.84 cm−1 at C-O-C group, 2855.57 cm−1 C-H bond respectively.
From the physical blends of medication and excipients there were no significant moving just
as no loss of any useful crests between the spectra of medication and its physical blends
Hence, it was confirmed that there w78.17 as no connection between the medication and
[image:7.595.98.502.357.562.2]7.1.7. Solubility studies
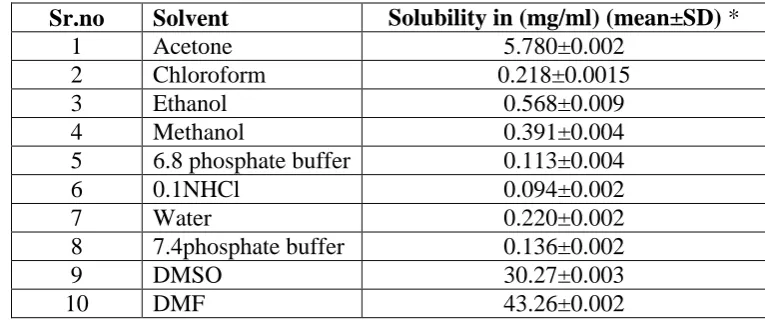
Dissolvability of medication in different solvents, were done so as to screen for the parts to
be utilized for detailing advancement. Examination of the medication was done on UV
[image:8.595.103.486.188.348.2]Spectrophotometer at376 nm.
Table 7: Solubility studies of Nitrofurantoin for different solvents.
Sr.no Solvent Solubility in (mg/ml) (mean±SD) *
1 Acetone 5.780±0.002
2 Chloroform 0.218±0.0015
3 Ethanol 0.568±0.009
4 Methanol 0.391±0.004
5 6.8 phosphate buffer 0.113±0.004
6 0.1NHCl 0.094±0.002
7 Water 0.220±0.002
8 7.4phosphate buffer 0.136±0.002
9 DMSO 30.27±0.003
10 DMF 43.26±0.002
* Each value is average of three independent determinations
Figure 5: Solubility study of drug in different solvents.
Discussion: Nitrofurantoin highly soluble in DMF (43.26 mg/ml) and DMSO (30.27 mg/ml)
[image:8.595.111.487.374.622.2]7.2. Characterization of Proliposomes
7.2.1. Microscopy of Proliposomes
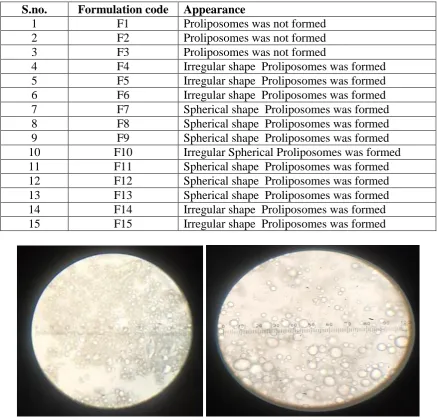
The prepared proliposomes delivery systems were made of lecithin, cholesterol, mannitol
which is biologically inert, non-irritating, nonmutagenic, non-allergenic, non-toxic and
biodegradable. As a result, the human body cannot convert them into other substances or
[image:9.595.79.517.229.649.2]break them down.
Table 8: Appearance of different Proliposomes formulation under light Microscope.
S.no. Formulation code Appearance
1 F1 Proliposomes was not formed
2 F2 Proliposomes was not formed
3 F3 Proliposomes was not formed
4 F4 Irregular shape Proliposomes was formed
5 F5 Irregular shape Proliposomes was formed
6 F6 Irregular shape Proliposomes was formed
7 F7 Spherical shape Proliposomes was formed
8 F8 Spherical shape Proliposomes was formed
9 F9 Spherical shape Proliposomes was formed
10 F10 Irregular Spherical Proliposomes was formed
11 F11 Spherical shape Proliposomes was formed
12 F12 Spherical shape Proliposomes was formed
13 F13 Spherical shape Proliposomes was formed
14 F14 Irregular shape Proliposomes was formed
15 F15 Irregular shape Proliposomes was formed
Figure 5: Microscopical of Nitrofurantoin loaded Proliposomes.
it was found that F7, F8, F9 and F11,F12, F13 formulations were spherical in shape but F4,
F5, F6, F10, F14, F15 found to be irregular shape due to aggregation of particles. For the
most part, little liposomal vesicles will in general total to frame enormous vesicles however
inhabitants in stable little liposome vesicles. Mannitol gives base to phospholipid to store.
Lessening in vesicle measure with increment in mannitol fixation could be credited to
increment in accessible surface territory for phospholipid to store.[13] As the centralization of
mannitol was diminished, a sticky item with poor flowability was acquired because of
expanded phospholipid load as for mannitol. On the basis shape formulation all formulation
was selected for further evaluation.
7.2.2 Percentage yield
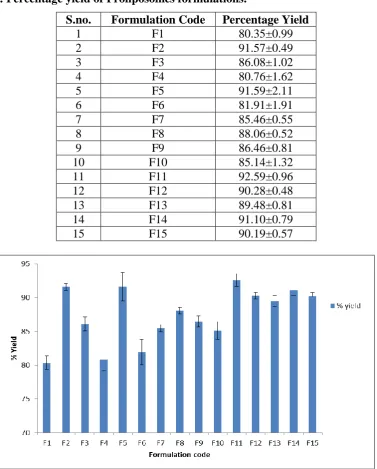
Percentage yield of proliposomes were given.
Table 9: Percentage yield of Proliposomes formulations.
S.no. Formulation Code Percentage Yield
1 F1 80.35±0.99
2 F2 91.57±0.49
3 F3 86.08±1.02
4 F4 80.76±1.62
5 F5 91.59±2.11
6 F6 81.91±1.91
7 F7 85.46±0.55
8 F8 88.06±0.52
9 F9 86.46±0.81
10 F10 85.14±1.32
11 F11 92.59±0.96
12 F12 90.28±0.48
13 F13 89.48±0.81
14 F14 91.10±0.79
[image:10.595.111.489.274.743.2]15 F15 90.19±0.57
Discussion: Maximum percentage yield of all formulation was found to be in a range of
found in range of 80.35±0.99 & 92.59±0.96.
7.2.3. Percentage drug entrapment
[image:11.595.118.479.196.665.2]Percentage yield and drug entrapment of Proliposomes were given.
Table 10: Percentage drug entrapment of Proliposomes formulations.
S.No. Formulation Code Percentage drug entrapment
1 F1 29.48±0.177
2 F2 41.7±0.65
3 F3 39.18±0.627
4 F4 59.49±0.243
5 F5 63.19±0.442
6 F6 63.01±0.539
7 F7 70.92±0.152
8 F8 77.48±0.537
9 F9 74.71±0.529
10 F10 74.71±0.204
11 F11 58.39±0.165
12 F12 62.28±022
13 F13 57.96±0.241
14 F14 52.36±0.565
15 F15 61.91±0.513
Figure 7: Percentage drug entrapment of different Proliposomes formulations.
Discussion: The entrapment efficiency of proliposomes formulations is shown. Entrapment
efficiency range varied from 29.48±0.177% to 77.48±0.537% for different combinations of
on EE% of shaped proliposomes. There was increment in EE% with increment in
phospholipid and abatement in EE% with increment in cholesterol fixation upto a limit
quantity. Medication which gets entangled in phospholipid bilayer. Therefore, increment in
phospholipid focus prompts increment in capture effectiveness of medication. Increment in
cholesterol fixation decline the EE%. At low centralization of cholesterol, sharp increment in
EE% was seen with increment in phospholipid while at high convergence of cholesterol, with
increment in phospholipid minor increment in EE% was watched. Formulation F8 was the
optimized formulation among all nitrofurantoin loaded proliposomes formulations. F8
showed good entrapment of drug and compatibility with lipid.
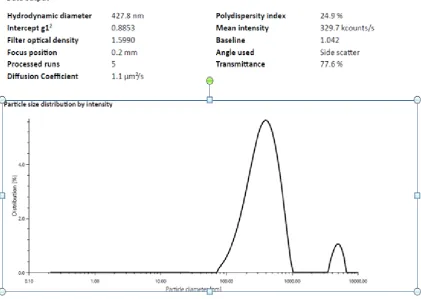
[image:12.595.99.521.313.612.2]5.2.4. Vesicle size analysis
Figure 8: Vesicle size analysis.
The result indicates obtained proliposome population have narrow size distribution vesicle
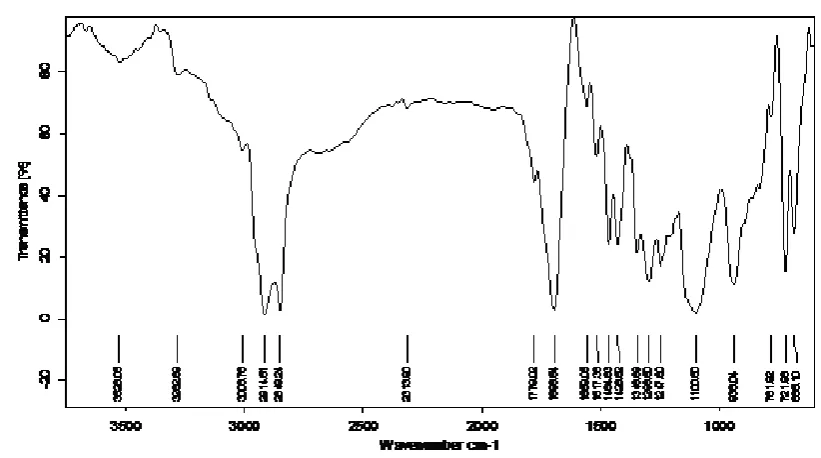
5.2.5. FTIR spectral analysis
Figure 9: FTIR of formulation (F8).
Infrared investigations were done to affirm the similarity between the lipid, sedate, and chose
proliposomes definition. From the spectra it was seen that there was no real moving, just as,
no loss of utilitarian crests between the spectra of the medication, lipid, and medication
stacked Proliposomes.
As seen from the broad absorption band C–O extending vibration in ester gathering appears
at 1173 cm-1. Theretention tops at 2924 cm-1 is attributed to the extending vibration of –CH3.
The bending vibration of –CH3 occurs at 1458 cm-1. The trademark ingestion top at 1173
cm-1 is gotten from the C–O–C extending vibration.
Discussion: The absence and low peak intensity of drug shows entrapment of drug in
developed Proliposomes.
5.2.6 Analysis of TEM
5.3. In vitro drug release study of Proliposomes
The discharge profiles of F8 were studied w.r.t. to pure nitrofurantoin as control. Plans
showed a biphasic supported discharge design and an underlying burst discharge viz. 11.3%
and 28% of nitrofurantoin was obtained from F8, respectively in the PBS[14] conceivable
reason that might be accounted is the quick arrival of medication adsorbed on the outside of
the Proliposomes or captured in the peripheral stratum. Further, the % medication discharge
(F8) followed continued and delayed discharge mien of medication particles watched was for
the most part because of dispersion of medication through the lipoidal lattice of the
Proliposomes. As obvious from the inset chart, fundamentally higher arrival of pure
nitrofurantoin as compared to that of F8was This may perhaps be because of auxiliary
[image:14.595.112.483.198.677.2]trustworthiness presented by lipid subsequently giving a lipid barrier to diffusion of drug.
Table 11: In vitro drug release profile of pure drug, formulation F8.
Time (h) % Drug release
Pure Drug F8
0.08 8.03±001 2.3±0.05
0.25 19.79±0.35 5.59±0.06
0.5 36.57±0.26 10.43±0.04
0.75 64.71±0.23 19.54±0.18
1 80.26±0.35 27.72±0.07
2 100.67±0.4 37.73±0.58
3 44.53±0.69
4 49.32±0.58
5 54.2±0.26
6 57.83±0.13
7 60.83±0.81
8 63.09±0.48
Figure 10: In vitro drug release profile of pure drug, formulation F8.
5.3.1. Drug release kinetics
Zero order
[image:15.595.116.480.109.313.2]Zero order graph % drug release vs. Time.
Figure 11: Zero order kinetics of F8 formulation.
First order
First order graph Log % drug remaining vs. time
Figure 22: First order kinetics of F8 formulation.
Higuchi kinetics
[image:15.595.107.491.388.598.2]Figure 12: Higuchi kinetics of F8 formulation.
Korsmeyer peppas
[image:16.595.106.488.368.603.2]Korsmeyer peppas release kinetics Log % drug release vs Log time
Figure 13: Korsmeyer peppas Model of F8 formulation.
Table 12: Kinetic equation parameter of F8 formulation.
Formulation
Name Zero order First order Higuchi
Korsymer-peppas
R2 K0 R2 K0 R2 K0 R2 K0
F8 0.880 7.427 0.946 -0.055 0.972 24.92 0.957 1.336
Numerical models are usually used to anticipate the discharge component and look at
(zero request), log percent medication remaining versus time (first request), log percent
medication discharge versus square base of time (Higuchi plot), and log of log % medication
discharge versus log time (Korsmeyer and Peppas Exponential Equation) were plotted.[15] For
each situation, R2 worth was determined from the chart and detailed in. Thinking about the
assurance coefficients, Higuchi model was found to fit the discharge information best. This
exhibits nitrofurantoin particles were scattered in the Proliosomes and there was no
connection between the medication and plan material. It could be concluded from the results
that the medication was discharged from Proliposomes by a dispersion controlled instrument.
RESULTS AND DISCUSSION
Lipid-based frameworks are known to improve the bioavailability of hydrophobic bioactives,
which make these lattices particularly fascinating as exemplification frameworks. Late
advances have appeared one of the ways to deal with improve the half life and bioavailability
substances, for example, Nitrofurantoin is to fuse these mixes in lipid-based exemplification
frameworks.
Before proliposomes development, preformulation studies were carried out to describe the
compound and physical properties of medication substance. The FT-IR range of drug samples
was found to be in concordant with the reference chemical groups present in the structure of
the Nitrofurantoin. The UV spectrum of Econazole nitrate in DMF exhibited a broad band at
376 nm. The liquefying point was dictated by fine strategy which complies with the melting
point given in pharmacopoeia. The solubility results showed that Nitrofurantoin is soluble in
DMF and dimethylsulfoxide, practically insoluble in water. The dissolvability profile of
medication in various solvents shows that drug is lipophilic in nature which is further
confirmed by the partition coefficient study.
The preformulation consider (FT-IR range, UV range and liquefying point) results
recommended that Nitrofurantoin was unadulterated and great in quality and the estimation
strategy was observed to be very dependable, precise and appropriate for definition
improvement.
Proliposomes formulation of Nitrofurantoin was prepared by using thin film technique.
For optimization of Proliposomes, different formulations (F1 to F15) were prepared using the
various quantities of lipid and cholesterol. Formulation (F8) with maximum entrapment
The shape and size of the optimized F8 formulation was confirmed through microscope and
TEM study and found that most of the particles were well identified, spherical and discreet
having large internal aqueous space.
Optimized formulations were incorporated in to capsules and in vitro drug release was
studied in aqueous media using USP 1 dissolution apparatus. To know precisely, the rate and
mechanism of drug release, the in vitro data was fitted to zero order, first order, Higuchi and
Korsmeyer-Peppas model. The results showed that the drug release from all formulations
followed Higuchi order which describes that the Nitrofurantoinfollows a diffusion
mechanism for release from Proliposomes.
REFERENCES
1. Dua JS, Rana AC, Bhandari AK. Liposome: methods of preparation and applications. Int
J Pharm Stud Res, 2012; 3: 14-20.
2. Hiremath PS, Soppimath KS, Betageri GV. Proliposomes of exemestane for improved
oral delivery: formulation and in vitro evaluation using PAMPA, Caco-2 and rat intestine.
Int J pharm, 2009; 380: 96-104.
3. Sun C, Wang J, Liu J, Qiu L, Zhang W, et al. Liquid proliposomes of nimodipine drug
delivery system: preparation, characterization, and pharmacokinetics. Aaps Phar, 2013;
14: 332-338.
4. Yadav A, Murthy MS, Shete AS, Sakhare S. Stability aspects of liposomes. Ind J Pha
Edu, 2011; 45: 402-413.
5. Uchegbu LF. Publisher: CRC Press, 2000; 93-96.
6. Payne NI, Timmins P, Ambrose CV, Ward MD, Ridgway F. Proliposomes: a novel
solution to an old problem. J pha sc, 1986; 75: 325-329.
7. Manjula D, Shabaraya AR, Shyale S. Topical Delivery of Fenoprofen Proliposomes:
Preparation, Evaluation and In Vitro Release. Int J Pha Sc In, 2014; 3: 06-12.
8. Janga KY, Jukanti R, Velpula A, Sunkavalli S, Bandari S, et al. Bioavailability
enhancement of zaleplon via proliposomes: Role of surface charge. Eur J Phar Bio, 2012;
80: 347-357.
9. S Bansal; CP Kashyap; G Aggarwal; SL Harikumar. A comparative review on vesicular
drug delivery system and stability issues. IJRPC, 2012; 2(3): 04-713.
10. Lasic DD, Papahadjopoulos D, Liposomes and biopolymer in drug and gene deliver,
11. Sanjay K Jain and Jain N K. Liposomes as Drug Carriers. Controlled and novel drug
delivery, CBS publishers and distributors, Delhi, 2008; 304-342.
12. Gupta V, Barupal A K, Ramteke S. Formulation development and in vitro
characterization of proliposomes for topical delivery of Aceclofenac, Indian J Pharm Sci,
2008; 70: 768-75.
13. Janga K Y, Jukanti R, Velpula A. Bioavailability enhancement of Zaleplonvia
proliposomes: Role of surface charge, Euro J Pharm and Biopharm, 2012; 80(2):
347-357.
14. Song KH, Chung SJ, Shim CK. Preparation and evaluation of proliposomes containing
salmon calcitonin. J Con Rel, 2002; 84: 27-37.
15. Janga KY, Jukanti R, Velpula A, Sunkavalli S, Bandari S, et al. Bioavailability
enhancement of zaleplon via proliposomes: Role of surface charge. Euro J Phar Biop,