www.wjpr.net Vol 4, Issue 4, 2015. 1149
STABILITY INDICATING RP – HPLC METHOD FOR
DETERMINATION OF LABETALOL HCL IN PHARMACEUTICAL
FORMULATION
Vaishali C. Kulkarni*, Bhavika R. Chavhan, S. R. Bavaskar, S. D. Barhate
Department of Quality Assurance, Shree Sureshdada Jain Institute of Pharmaceutical Education and Research, Jamner – 424206.
ABSTRACT
A simple, rapid and accurate and stability indicating RP-HPLC method was developed for the determination of Labetalol HCL in pure and tablet form.. The method showed a linear response for concentrations in the range of 10-50μg/ml using Methanol: Water solution in the ratio (70:30) as the mobile phase with detection at 246 nm and a flow rate of 1 ml/min and retention time 6.3min. The value of correlation coefficient, slope and intercept were, 0.999, 15.30and7.019, respectively. The method was validated for precision, recovery, ruggedness and robustness. The drug undergoes degradation under acidic, basic, peroxide and thermal degradation conditions. All the peaks of degraded product were resolved from the active pharmaceutical ingredient with significantly different retention time. As the method could effectively separate the drug from its degradation product, it can be employed as a stability indicating one.
KEYWORDS: labetalol HCL, RP-HPLC, Degradation studies.
INTRODUCTION
Fig.1 Chemical structure of labetalol HCL
Volume 4, Issue 4, 1149-1161. Research Article ISSN 2277– 7105
Article Received on 28 Jan 2015,
Revised on 23 Feb 2015, Accepted on 19 March 2015
*Correspondence for
Author
Vaishali C. Kulkarni
Department of Quality
Assurance, Shree
Sureshdada Jain Institute
of Pharmaceutical
Education and Research,
www.wjpr.net Vol 4, Issue 4, 2015. 1150 Vaishali et al. World Journal of Pharmaceutical Research
www.wjpr.net Vol 4, Issue 4, 2015. 1151 EXPERIMENTAL
MATERIALS AND METHODS
Gift sample of Labetalol (LBT) was received from flemingo. Commercial formulations LOPIHTM containing100mg of Labetalol were purchased from the local market.
INSTRUMENTATION
The analysis of the drug was carried out on a Younglin ( S.K) Gradient System UV Detector. Equipped with a Reverse phase (Thermo) C18 Column (4.6mm x 250 mm; 5μm), a SP930D pump, a 20μl injection loop and a UV730D Absorbance detector and running on Autochro-3000 software.
Chromatographic conditions
Mobile phase consist mixture of methanol-water in the ratio of 70:30%v/v (PH was adjusted with 0.05% OPA). The mobile phase was pumped from the solvent reservoir to the column at flow rate 1ml/min. column temperature was maintained at Ambient. UV Detection performed at 246nm.the mobile phase was degassed by an ultrasonic water bath for 5min.filter through 0.45µ filter under vacuum filtration. The column was equilibrated for at least 30min with mobile phase flowing through the system. Mobile phase used as diluents during the standard and test sample preparation.
Selection of detection wavelength
UV detector was selected, as it is reliable and easy to set at constant wavelength. A fix concentration of analyte were analysed at different wavelengths. As per the response of analyte, 246 nm Wavelength was selected.
Preparation of Standard Solutions
www.wjpr.net Vol 4, Issue 4, 2015. 1152 Vaishali et al. World Journal of Pharmaceutical Research
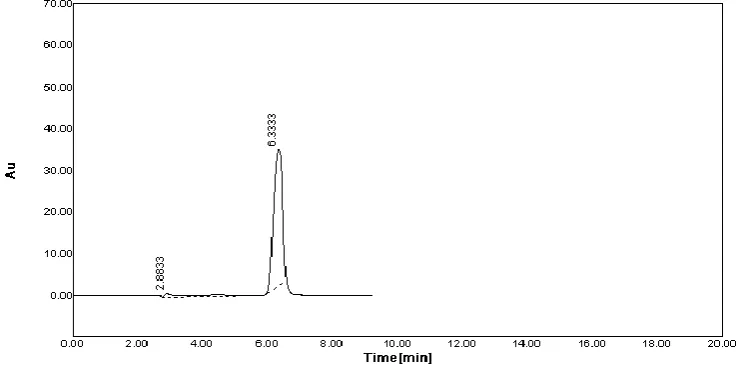
Fig No.2 The Simple Chromatogram of Standard Labetalol HCL.
Preparation of calibration graph
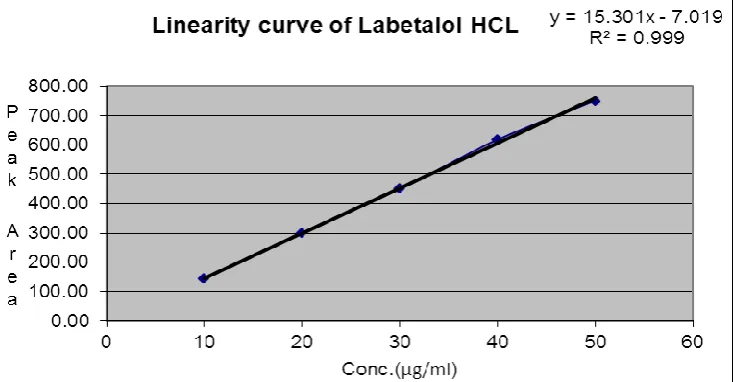
The linearity of response for labetalol HCL assay method was determined by preparing and injecting solutions with concentrations of about 10,20, 30,40,50μg/ml of labetalol HCL. Linearity curve of labetalol HCL shown if fig. no.3.
Fig.No.3 Linearity curve of labetalol HCL
Sample Solution Preparation
[image:4.595.115.483.421.612.2]www.wjpr.net Vol 4, Issue 4, 2015. 1153
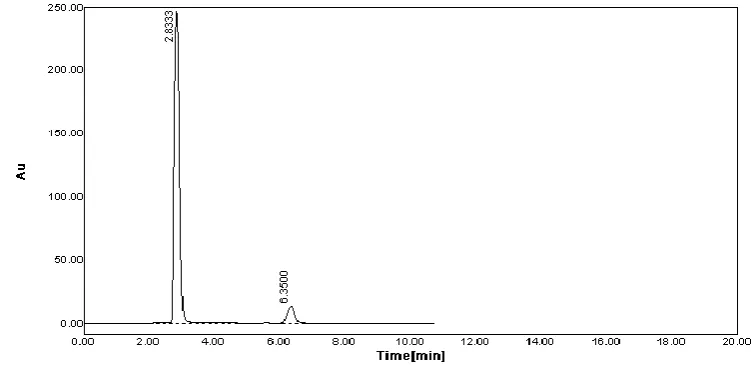
[image:5.595.116.485.138.323.2]above stock solution into a 10ml volumetric flask and dilute up to the mark with diluent.(40µg/ml).The simple chromatogram of test labetalol HCL shown in fig. no.4.
Fig. no.4 Simple Chromatogram of test Labetalol HCL
Forced degradation studies
In order to determine whether the analytical method and assay were stability-indicating, LBT tablets and LBT active pharmaceutical ingredient (API) powder were stressed under various conditions to conduct forced degradation studies. Intentional degradation was attempted to stress conditions of photolytic degradation, acid hydrolysis (using 1N HCl), base hydrolysis (using 0.1N NAOH), oxidative degradation (using 3.0% H2O2) and thermal treatment (heated at 80°C for two days) to evaluate the ability of the proposed method to separate LBT from its degradation products. LBT at a concentration of 20µg/ml was used in all the degradation studies. After completion of the degradation processes, the solutions were neutralized and diluted with mobile phase.
Acid Degradation
www.wjpr.net Vol 4, Issue 4, 2015. 1154 Vaishali et al. World Journal of Pharmaceutical Research
Fig no.5 Chromatogram of Acid Degraded Sample
Base Degradation
Forced degradation in alkaline media was performed using 0.1N NaOH. The representative Chromatograms for alkaline degradation studies were shown in fig-6 respectively.
Fig no.6 Chromatogram of Base Degraded sample
Neutral Degradation
[image:6.595.114.489.404.598.2]www.wjpr.net Vol 4, Issue 4, 2015. 1155 Fig no. 7 Chromatogram of Neutral Degraded sample
Oxidative degradation
Oxidative degradation was performed by taking an aliquot of stock solution in 10ml volumetric flask and diluted up to the mark with 3%w/v of hydrogen peroxide to obtain a final concentration of 100mcg/ml. The flask was kept aside at room temperature for 1hr. Appropriate aliquot was taken from the above solution and diluted with mobile phase to obtain a final concentration of 20µg/ml. The representative Chromatogram was shown in fig-8.
Fig. no. 8 Chromatogram of Oxidative degraded sample
Thermal stress studies
[image:7.595.110.486.465.649.2]www.wjpr.net Vol 4, Issue 4, 2015. 1156 Vaishali et al. World Journal of Pharmaceutical Research
Figno. 9 Chromatogram of thermal stress
Table No. 1 : Stress Study of Labetalol HCL.
Stress Condition Time in hr Mean
peak area
% recovery of analyte
Retention time of analyte
Acid hydrolysis (0.1N HCL) 1hr 263.014 79.42 6.3500
Base hydrolysis (0.5N
NAOH) 1hr 738.82 243.74 6.3167
Oxidation (3%H2o2) 1hr 211.2263 14.26 6.3500
Neutral 1hr 191.2933 12.96 6.3667
Thermal (800c) 3hr 267.5669 89.73 6.500
Validation of the Method
The analytical method was validated with respect to parameters such as linearity, limit of quantitation (LOQ), limit of detection (LOD), precision, accuracy, selectivity, recovery and robustness/ruggedness.
Linearity
[image:8.595.91.508.83.284.2]www.wjpr.net Vol 4, Issue 4, 2015. 1157 Repeatability
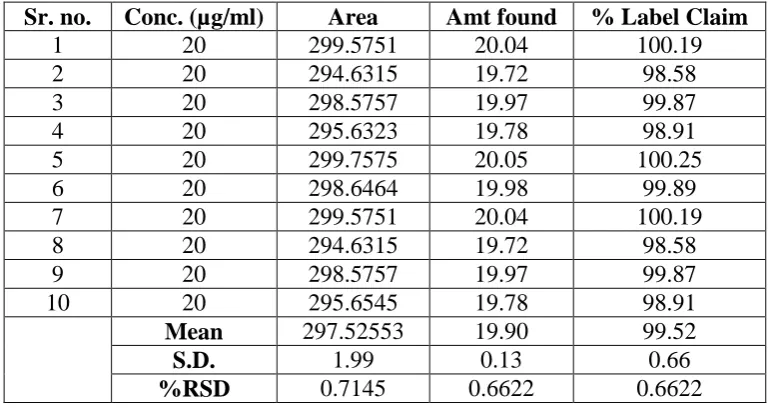
[image:9.595.104.492.152.358.2]Repeatability was ascertained by getting the sample analyzed by different analyst and carrying out analysis for no. of times. The results are shown in table no.2.
Table No.2 Repeatability
Sr. no. Conc. (µg/ml) Area Amt found % Label Claim
1 20 299.5751 20.04 100.19
2 20 294.6315 19.72 98.58
3 20 298.5757 19.97 99.87
4 20 295.6323 19.78 98.91
5 20 299.7575 20.05 100.25
6 20 298.6464 19.98 99.89
7 20 299.5751 20.04 100.19
8 20 294.6315 19.72 98.58
9 20 298.5757 19.97 99.87
10 20 295.6545 19.78 98.91
Mean 297.52553 19.90 99.52
S.D. 1.99 0.13 0.66
%RSD 0.7145 0.6622 0.6622
Limit of Detection and Limit of Quantitation
The limits of detection and quantification were calculated by the method based on standard deviation (σ) and slope (S) of the calibration plot using the formula LOD = 3.3 σ/S and LOQ =10 σ/S. The limit of quantitation (LOQ) of the present method was found to be 0.72 µg/ml with a resultant %RSD of 0.29% (n = 5). The limit of detection (LOD) was found to be 0.24µg/ml.
Precision
Precision was evaluated in terms of Intraday and Interday precisions. Intraday precision was determined by analyzing sample solutions of LBT from formulations at three levels covering low, medium, and higher concentrations of calibration curve for five times on the same day. Inter day precision was determined by analyzing sample solutions of LBT at three levels covering low, medium, and higher concentrations over a period of seven days (n=5). The peak areas obtained were used to calculate mean and %RSD (relative SD) values.
Table No.3 Precision
Conc.(µg/ml) Inter day Intra Day
Mean± S.D. Amt. Found % Amt. Found Mean± S.D. Amt. Found %Amt. Found
20 299.57±0.00 20.04 100.19 299.65±0.00 20.04 100.22
30 447.84±0.55 29.73 99.10 448.72±0.57 29.79 99.29
40 618.91±0.08 40.91 102.28 616.27±0.41 40.74 101.85
[image:9.595.105.490.154.359.2]www.wjpr.net Vol 4, Issue 4, 2015. 1158 Vaishali et al. World Journal of Pharmaceutical Research
Accuracy
Accuracy data for the assay following the determination of the compound of interest is summarized in Table-4.Accuracy was determined by interpolation of replicate (n=5) peak areas of three accuracy standards of different concentration, from a calibration curve that had been prepared as previously described. In each case, the percent relevant error and accuracy was calculated in Table no.4. Accuracy data (n=5)
Table No.4 Accuracy
Specificity
The results of stress testing studies in addition to that of monitoring standard solutions of the drug in the presence of their impurities indicated a high degree of specificity of this method. The degradation product(s) of the parent compound was found to be similar for both the tablets and API powder. All the degradation products formed during forced decomposition studies were well separated from the analyte peak demonstrates that the developed method was specific and stability-indicating.
Ruggedness/Robustness
As recommended in the ICH Guidelines, a robustness assessment was performed during the development of the analytical procedure. The ruggedness of the method is assessed by comparison of the intra- and inter-day assay results that has been performed by two analysts. The %RSD values for intra- and inter-day assays of LBT tablets performed in the same laboratory by two analysts did not exceed 1.8%, indicating the ruggedness of the method. In addition, the robustness of the method was investigated under a variety of conditions including changes of flow rate, wavelength, mobile phase composition and column temperature,. The degree of reproducibility of the results obtained as a result of small deliberate a variations in the method parameters has proven that the method is robust and the data was summarized in Table no. 5.
Sr. no. Level (%) Amt. taken (µg/ml) Amt. Added (µg/ml) Area Mean* ± S.D.
Amt. recovered Mean *±S.D.
%Recovery Mean *± S.D.
1 80 10 8 239.617 ± 0.698 8.12 ± 0.05 101.50± 0.57
2 100 10 10 299.4775± 0.21 10.03± 0.01 100.32 ± 0.14
www.wjpr.net Vol 4, Issue 4, 2015. 1159 Table No. 5 Ruggedness/Robustness
Table no.6 System suitability parameter
Assay
[image:11.595.108.489.674.735.2]The validated method was applied to the determination of Labetalol HCL in commercially available LOPIHTM tablets. Figure 2 and Figure 4 illustrates two typical HPLC chromatograms obtained from Labetalol HCL standard solution and from the assay of LOPIHTM tablets respectively. The results of the assay (n = 9) undertaken yielded 100.98% (%RSD = 0.13%) of label claim for LBT HCL. The observed concentration of LBT HCL was found to be 40.38±0.52µg/ml (mean±SD). The mean retention time of Labetalol was 6.33 min. The results of the assay indicate that the method is selective for the analysis of Labetalol HCL without interference from the excipients used to formulate and produce these tablets.
Table no.7 Label Claim
Sample Label Claimed % Label Claim* ±
SD % RSD
LOPIHTM Labetalol HCL 100mg 100.98 ± 0.13 0.13
Parameters Conc. Amount of labetalol
detected(mean ±SD) %RSD
Mobile phase composition-(69:31) 30 370.1235 ± 0.80 0.21
Mobile phase composition-( 71:29) 30 447.37 ± 1.01 0.22
Wavelength change247nm 30 419.6 ± 0.39 0.09
Wavelength Change 245nm 30 419.73 ± 0.34 0.08
Flow rate change(1.1ml) 30 466.00 ± 1.31 0.28
Flow rate change(0.9ml) 30 538.99 ± 0.84 0.16
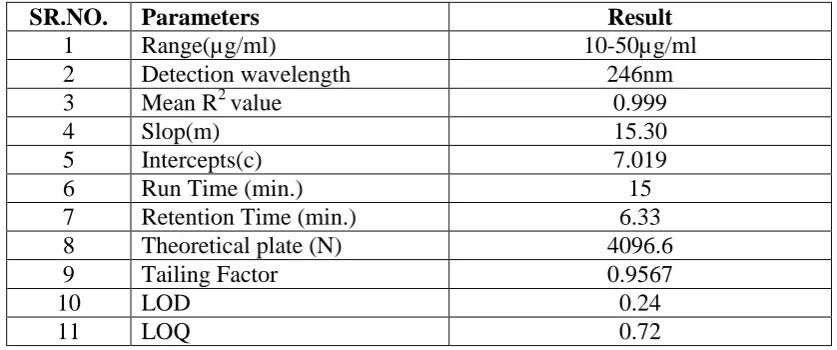
SR.NO. Parameters Result
1 Range(µg/ml) 10-50µg/ml
2 Detection wavelength 246nm
3 Mean R2 value 0.999
4 Slop(m) 15.30
5 Intercepts(c) 7.019
6 Run Time (min.) 15
7 Retention Time (min.) 6.33
8 Theoretical plate (N) 4096.6
9 Tailing Factor 0.9567
10 LOD 0.24
www.wjpr.net Vol 4, Issue 4, 2015. 1160 Vaishali et al. World Journal of Pharmaceutical Research
RESULTS AND DISCUSSION
The nature of the sample, its molecular weight and solubility decides the proper selection of the stationary phase. The drug Labetalol HCL preferably analyzed by reverse phase columns and accordingly C18 column was selected. So the elution of the compound from the column was influenced by polar mobile phase. The concentration of the Methanol and water were optimized to give symmetric peak with short run time based on asymmetric factor and peak area obtained. Different mobile phases were tried but satisfactory separation, well resolved and good symmetrical peaks were obtained with the mobile phase Methanol : Water 70:30(v/v). The retention time of Labetalol HCL was found to be 6.333 min, respectively. The RSD values for accuracy and precision studies obtained were less than 2%which revealed that developed method was accurate and precise. The system suitability parameters are given in Table 6. The average recovery was found to be 100.49% for Labetalol HCL indicating that the proposed method is highly accurate. The LOD and LOQ were found to be 0.72µg/ml and 0.24µg/ml respectively. The degree of reproducibility of the results obtained as a result of small deliberate variations in the method parameters has proven that the method is robust. LBT HCL were found to be relatively stable following photolysis and Thermal degradation. Considerable degradation was observed for both in oxidation, acid and base hydrolysis. The validated method was applied to the determination of LBT HCL in commercially available LOPIHTM tablets. The results of the assay indicate that the method is selective for the analysis of Labetalol HCL without interference from the excipients used to formulate and produce these tablets.
CONCLUSIONS
A simple, rapid, accurate and precise stability indicating HPLC analytical method has been developed and validated for the routine analysis of Labetalol HCL in API and tablet dosage forms. The results of stress testing reveal that the method is selective and stability indicating. The proposed method has the ability to separate the analyte from their degradation products, related substances; excipients found in tablet dosage forms and can be applied to the analysis of samples obtained during accelerated stability experiments.
ACKNOWLEDGEMENTS
www.wjpr.net Vol 4, Issue 4, 2015. 1161 REFERENCES
1. M. Ganesan, S. Nanjundan, K. S. Rauthan, K. Eswaran and P. Tripathi, “Rapid Analysis of Labetalol in Human Plasma Using Liquid Chromatography-Tandem Mass Spectrometry”, International journal of pharmaceutical sciences and research, 2010; 1(12): 209-218.
2. Nafisur Rahman, Sk Manirul Haque and S. M. Zakir Hossain, “Rapid and Simple Spectrophotometric Analysis of Labetalol Hydrochloride in Pharmaceutical, Urine and Blood Samples”, Canadian Chemical Transaction, 2013; 1(1): 66-77.
3. L.J.Dusci and L.P.Hackett, “Determination of Labetalol in human plasma by high-performance liquid chromatography”, Journal of Chromatography, 1979; (175): 208-210. 4. David R. luke, Gary R.matzke,jay T.Clarkson, and walld M.Awnl, “Improved Liquid-Chromatograhic Assay of Labetalol in Plasma”, Clinical chemistry, 1987; 33(8): 1450-1452.