DESIGN AND DEVELOPMENT OF MODIFIED RELEASE TABLETS
OF GLIPIZIDE CONSIDERING THE CURRENT REGULATORY
REQUIREMENT OF TESTING IN HYDRO-ALCOHOLIC MEDIA
Sangani Hardik*, Dholakia Mansi, Rana Hardik, Thakkar Vaishali T., Gandhi Tejal R.
Department of Pharmaceutics, Anand Pharmacy College, Opp. Town Hall, Anand, 388001, Gujarat, India.
ABSTRACT
Objective: The objective of the present study was to assess the interaction between alcohol and prepared matrix tablet of glipizide
containing gelucire 43/01 and polyethylene oxide incorporating QbD
approach. Experimental Work: Matrix sustained release tablet was
prepared using gelucire 43/01 and poly ethylene oxide as release retardant polymers and glipizide was selected as a model drug. Matrix tablet was prepared by hot melt granulation technique. Central composite design was applied to obtain optimized batch using concentration of gelucire and concentration of polyethylene oxide as independent variables and drug release at 2h, 6h and 10h were selected as dependent variables. All the batches were evaluated for post and pre-compressional parameters. Optimized batch was evaluated for influence of hydro
alcoholic media on drug release. Result and Discussions: The resulting formulation
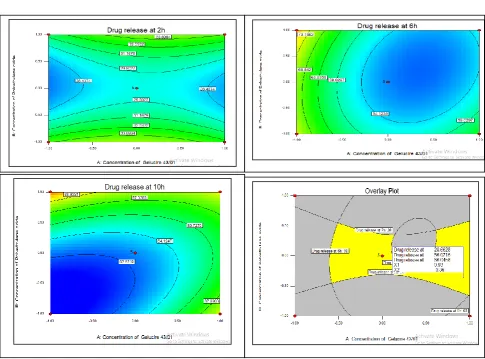
produced robust tablets with optimum pre and post compressional parameter. Optimized batch was selected from the central composite design which contains 19.2% concentration of gelucire and 4.5 % concentration of polyethylene oxide. The optimized batch gives similar drug release to marketed formulation. As the concentration of alcohol increases from 5 to 40%, the drug release also increases but did not shown dose dumping effect. It is just due to higher solubility of glipizide in alcohol. Conclusion: The robust matrix formulation was
formulated using gelucire and polyethylene oxide which shows similar drug release to marketed formulation. Also, significant change in dissolution was not observed when exposed to hydro alcoholic media for 12 hr. The present study demonstrated the effect of alcohol employing the concept of design of experiments.
Volume 7, Issue 18, 1430-1444. Research Article ISSN 2277– 7105
Article Received on 17 Sept. 2018,
Revised on 08 Oct. 2018, Accepted on 29 Oct. 2018
DOI: 10.20959/wjpr201818-13669
*Corresponding Author
Sangani Hardik
KEYWORDS: Glipizide, gelucire 43/01, PEO 301, hydro alcoholic media, sustained release.
INTRODUCTION
The oral route of administration has been found more conventional consideration, because of more flexibility in dosage form design, more patient acceptance and reasonably a safest route of administration than parental route. Main hindrance of oral dosage form is patient non-compliance due to more frequency of administration. Sustained release (SR) dosage forms sustain the duration of action, reduce side-effects, and increase safety and patient compliance by reducing the frequency of dose. Multiple daily administration of an immediate release dosage form fallouts to patient non-compliance.[1]
SR dosage forms are effective and more advantageous in achieving optimum therapy of those drugs which possess narrow therapeutic window. SR products are designed to bring the blood level of a drug immediately to therapeutic concentrations by means of a loading dose portion and then sustain this level for a certain predetermined time with the maintenance portion. SR tablets are not affected by the absorption process. It is very necessary to develop
discriminating dissolution method which mimics the behavior of the dosage forms.[2]
Glipizide, a second-generation sulfonylurea, is used with diet to lower blood glucose in patients with diabetes mellitus type II. The primary mode of action of glipizide appears to be the stimulation of insulin secretion from the beta cells of pancreatic islet tissue and is thus dependent on functioning beta cells in the pancreatic islets. The protein binding is found to be 98-99 % and the absorption is uniform, rapid, and essentially complete. It undergoes hepatic metabolism and half-life is 2-5 hours.[3]
The opiate drug, hydromorphones, formulated for controlled delivery over 24 h (palladone hydromorphones capsule) has been withdrawn from the US market by its manufacturer due to a potentially fatal interaction with alcohol (FDA, 2005). Based on this major interaction, the FDA has decided to develop a regulatory decision framework to assess the risk of alcohol-induced dose dumping for oral sustained release formulations.
Development and evaluation of sustained release tablet of Glipizide using QBD approach.
To assess the influence of hydro alcoholic dissolution media on release profile of optimum batch.
MATERIAL AND METHOD
Glipizide was a gift sample from Baroque Pharmaceuticals, Khambhat. Gelucire 43/01, Precirol ATO 5, Compritol 888 were received as gift sample from Gattefosse India Pvt Ltd, Mumbai. Polyethylene Oxide 301 was gift sample from Dow chemicals, USA. All other ingredients used were of analytical grade.
Differential scanning Calorimetry
The differential scanning calorimeter (DSC) was performed (Perkin Elmer, DSC-7, Norway, USA) to study the thermal behavior of glipizide and polymers Gelucire (43/01) and mixture of drug with polymers. The instrument comprised of calorimeter (DSC-60), flow controller (FCL-60), thermal analyzer (TA-60) and operating software (TA-60). The samples (2-4 mg) were heated in hermetically sealed flat-bottomed aluminum pans under nitrogen flow (20ml/min) at a scanning rate of 10oC/min from 25oC to 200oC. The empty aluminum pan was used as the reference standard.[5]
Furious transforms infrared spectroscopy
The drug-polymer containing oral SR tablet and the pure drug (Glipizide) was subjected to the Fourier-transform infrared spectroscopy in order to detect the existence of interaction
between drugs and polymers. The procedure consisted of dispersing a sample (drug alone, polymers alone and physical mixture of drug and polymer) in KBr to prepare 10% of mixture and ground generally in mortar-pestle with KBr before being compress into pellets. This pellet was placed in light path and spectrum was recorded at a resolution of 2 cm-1 over a
frequency range of 4000 to 400 cm-1. The background spectrum of KBr was used as blank for
determination.[6]
Phase Solubility
Preparation of kneading method
Glipizide and PEG 4000 or PEG 6000 were triturated using a small volume of methanol-water (1:1) solution to give obtain a thick paste, which was kneaded for 30 minutes and then dried at 40ºC in an oven. The dried mass was then pulverized, passed through 30 mesh no.
sieve stored in a vacuum desiccator (48h) and passed through 60 mesh no.[8]
Preparation of sustained release tablet by Melt granulation technique
The waxy material Gelucire 43/01 was taken in china dish and heated to 42–45 °C. When the polymer started to melt Glipizide was added and was thoroughly kneaded. The mixture was allowed to cool and solidify. Then the mixture was passed through 30# mesh. All other excipients were then added to this mixture and the tablet were punched using Rotary tablet compression machine.[9]
Experimental design
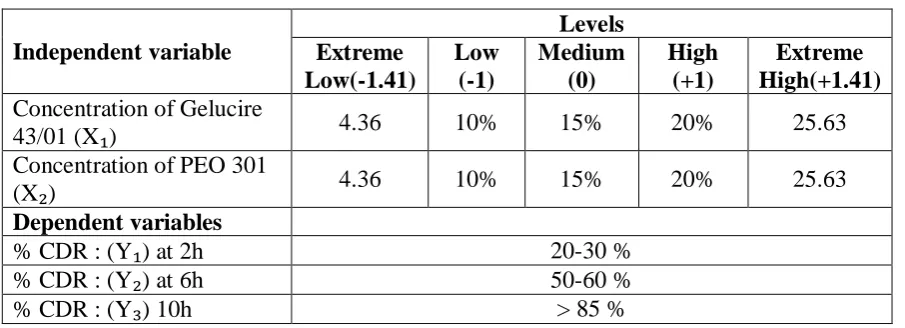
Response Surface Methodology (RSM) based on a two-factor, five-level central composite design. The Concentration of Gelucire 43/01 (X₁) and Concentration of polyethylene oxide
301 (X₂) was selected as formulation (independent) variables. The design consisted of thirteen experimental points that included fractional 22 factorial points, four star points and five replicates at the centre point. All other formulation and process variables were kept invariant through the study. Table 4 summarizes the 13 experimental run was studied and
their factor combinations and translation of the coded levels to the experimental units will be employed during the study. The drug release at 2 hrs (Y₁), drug release at 6 hrs (Y₂), and
drug release at 10 hrs (Y₃) time will be studied as response variables (dependent variables).
[image:4.595.74.527.587.751.2]Design expert software was used for the generation of the mathematical models.
Table 1: Central composite design was adopted to optimize matrix tablet.
Independent variable Levels Extreme Low(-1.41) Low (-1) Medium (0) High (+1) Extreme High(+1.41)
Concentration of Gelucire
43/01 (X₁) 4.36 10% 15% 20% 25.63
Concentration of PEO 301
(X₂) 4.36 10% 15% 20% 25.63
Dependent variables
% CDR : (Y₁) at 2h 20-30 %
% CDR : (Y₂) at 6h 50-60 %
Evaluation of tablet
Micromeritics properties of powder
The powder mixtures were evaluated for bulk density, tapped density, compressibility, angle of repose and Hausner’s ratio.
Angle of repose
It is defined as the maximum angle possible between the surface of a pile of powder and the horizontal plane.
Angle of Repose= tan -1 (h/r)
Where, h = height of pile (cm), r = radius of pile (cm).
Bulk Density
It is the ratio of total mass of powder to the bulk volume of powder. It was measured by pouring the weighed powder (passed through standard sieve # 20) into a measuring cylinder and the initial volume was noted. This initial volume is called the bulk volume. From this, the bulk density is calculated according to the formula mentioned below. It expressed in g / cc and is given by.
ρb = M/Vb
ρb = (weight of powder )/(volume of packing).[10]
Tapped Density
It is the ratio of total mass of powder to the tapped volume of powder. The volume was measured by tapping the powder for 500 times and the tapped volume was noted. It is expressed in g/cc and is given by.
ρt = M/Vt
Where, M = mass of powder, Vt= tapped volume of powder.
Carr’s Index
The percentage compressibility (Carr’s index) was calculated as 100 times the ratio of the difference between tapped density and bulk density to the tapped density.
Carr’s index = 100 x Tapped density -Bulk density/Tapped density.
Hausner’s Ratio
Hausner’s ratio is an indirect index of ease of measuring the powder flow. It was calculated
Hausner’s ratio's= (ρt)/ρb
Where, ρt= tapped density, ρb= bulk density.[11]
Post compressional characteristics for tablet
Weight variation
Twenty tablets were selected at random and average weight was determined. Then individual tablets were weighed and the individual weight was compared with an average weight. The percentage deviation can be determined by using the following formula.
% Deviation = 100 * Average weight-Individual weight/average weight
The tablet passes the test if not more than 2 tablets are outside the percentage limit and if no tablet differs by more than 2 times the percentage limit.
Hardness
Hardness or tablet crushing strength is defined as force required to break the tablet when the force generated by a coil spring is applied diametrally to the tablet. It was measured using Monsanto tablet hardness tester.[12]
Friability
Friability of the tablets was checked by using Friabilator. Percent friability was calculated using the formula given below.
Percent friability = Final weight –Initial weight/Initial weight * 100
Conventional compressed tablets that loose less than 0.5% to 1% of weight are considered acceptable.
Drug content
Ten tablets were weighed and average weight is calculated. All tablets were crushed and powdered. Equivalent to 10 mg drug was dissolved in 10 ml of methanol and the volume was make up to 100 ml with pH 7.4 phosphate buffer. The solution was shaken for 1h and kept for 24h. From the stock solution, 1ml solution was taken in 10 ml volumetric flask and the volume was make with pH 7.4 phosphate buffers. Solution was filtered and absorbance was measured spectrophotometrically at 276 nm against pH 7.4 phosphate buffer as a blank using
Swelling index
The extent of swelling was measured in terms of percentage weight gain by the tablet. The Swelling behavior of all formulation was studied. One tablet from each formulation was kept in a Petridis containing pH 7.4 phosphate buffers. The tablet was removed every three hour interval up to 12 hour and excess water blotted carefully using filter paper. The swollen tablets were re-weighed (W2).The swelling index (SI) of each tablet was calculated according to the following equation.[14]
S.I. = {(Wt-W0) / W0} ×100
Where-W0= initial weight, Wt= final weight
Drug dissolution study
The in-vitro release tests was performed using USP apparatus-ІІ (Paddle method).The Dissolution medium was 900ml of 7.4 phosphate buffer at 37±0.5°C. The Paddle rotation speed was kept at 50rpm. In all experiments, an aliquot of 5 ml dissolution samples was withdrawn at predetermined time intervals, and replace with an equal volume of the fresh medium to maintain total volume constant. A sample was filtered through filter (4.5 µm) and the absorbance was measured using spectrophotometer at 276 nm for the estimation of
Glipizide. Graph was plotted as percentage cumulative drug release (% CDR) versus time.[15]
Influence of hydro alcoholic media
The in-vitro release tests was performed using USP apparatus-ІІ (Paddle method).The
Dissolution medium was 900ml of 7.4 phosphate buffer with 5% and 40% alcohol at 37±0.5°C for 12 hours. In second test, The Dissolution medium was 900ml of 7.4 phosphate buffer with 5% and 40% alcohol for 1 hours after that kept in 900ml of 7.4 phosphate buffer for 11 hours. The Paddle rotation speed was kept at 50rpm. In all experiments, an aliquot of 5
ml dissolution samples was withdrawn at predetermined time intervals, and replace with an equal volume of the fresh medium to maintain total volume constant. A sample was filtered through filter (4.5 µm) and the absorbance was measured using spectrophotometer at 276 nm for the estimation of Glipizide. Dissolution data was plotted as percentage cumulative drug release (% CDR) versus time.[16]
RESULT AND DISCUSSION
Drug content
Figure 1: DSC thermogram of pure Glipizide.
Figure 2: Overlay of pure drug and drug + excipients.
[image:8.595.113.490.572.747.2]Figure 4: FTIR Overlay of pure drug and drug + excipients.
Table 2: Solubility of solid dispersion technique.
Different ratio of PEG 6000 and PEG 4000 was used for the solid dispersion method. 1:2 ratio of Glipizide and PEG 6000 was give good solubility compare to other batches. So, this ratio was used for further studies.
[image:9.595.110.491.543.734.2]In vitro drug release study
Figure 5: In vitro dissolution study of design batches.
Ratio Drug(mg) PEG 6000 (mg) PEG 4000 (mg) Solubility (mg/ml)
1 : 1 100 100 - 0.256 ± 0.87
1 : 2 100 200 - 0.350 ± 0.43
1 : 3 100 300 - 0.294 ± 0.36
1 : 1 100 - 100 0.225 ± 0.45
1 : 2 100 - 200 0.187 ± 0.68
The results of dissolution studies as shown in figure 5. Indicate that, between 25.12-40.98% drug release at 2h, 51.23-86.99% drug release at 6h and 81.56-92.20% drug release at 10h. Optimize batch give drug release 29.88% at 2h, 59.12% at 6h and 85.54% at 10h. Marketed preparation give drug release 29.67% at 2h, 58.88% at 6h and 86.99% at 10h.
Table 3: ANOVA study to Y1, Y2 and Y3 responses.
Source F
value
P
value R
2 F value
P
value R
2 F value
P
value R
2
Drug release at 2h Drug release at 6h Drug release at 10h
Model 23.13 0.0003
0.9429
24.33 0.0003
0.9456
22.68 0.0003
0.9419
A 0.45 0.5227 36.65 0.0005 15.03 0.0061
B 0.31 0.5949 0.56 0.4763 35.13 0.0006
AB 0.96 0.3576 3.84 0.0906 15.52 0.0056
A2 10.66 0.0138 74.41 0.0001 10.53 0.0141
B2 93.11 0.0001 12.91 0.0088 41.84 0.0003
[image:10.595.72.558.348.707.2]ANOVA study to Y1 Y2 and Y3 response
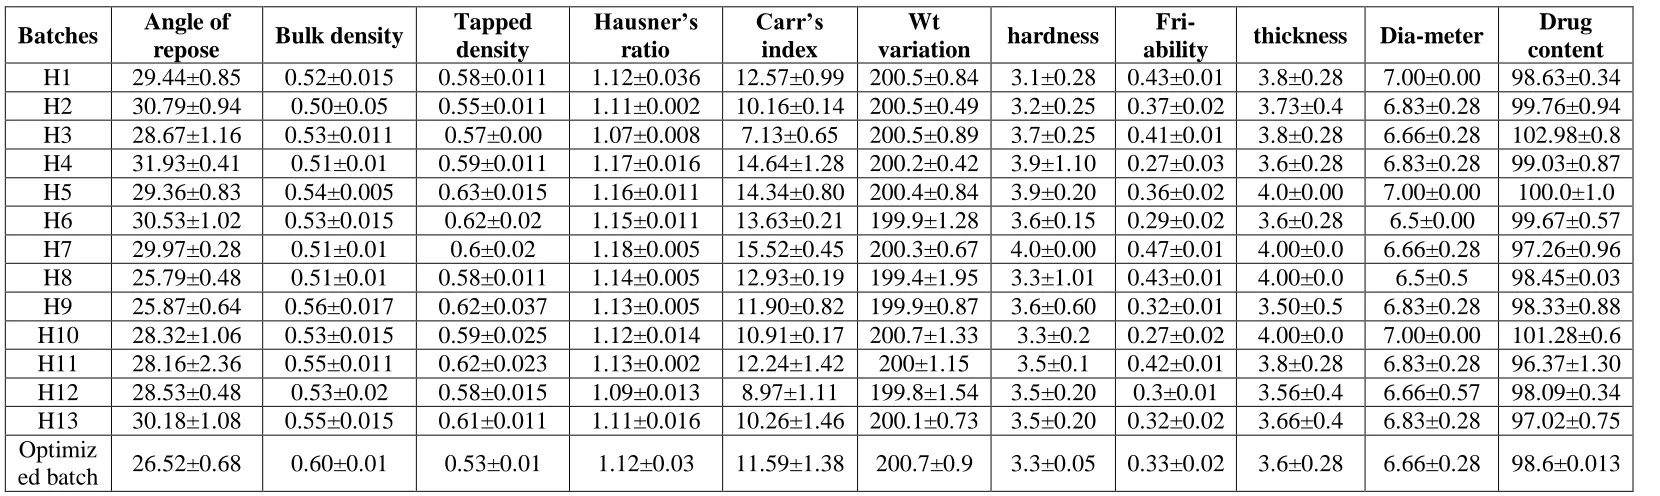
Table 4: Pre and post compressional parameter of design batches and optimize batch.
Batches Angle of
repose Bulk density
Tapped density
Hausner’s ratio
Carr’s index
Wt
variation hardness
Fri-ability thickness Dia-meter
Drug content
H1 29.44±0.85 0.52±0.015 0.58±0.011 1.12±0.036 12.57±0.99 200.5±0.84 3.1±0.28 0.43±0.01 3.8±0.28 7.00±0.00 98.63±0.34
H2 30.79±0.94 0.50±0.05 0.55±0.011 1.11±0.002 10.16±0.14 200.5±0.49 3.2±0.25 0.37±0.02 3.73±0.4 6.83±0.28 99.76±0.94
H3 28.67±1.16 0.53±0.011 0.57±0.00 1.07±0.008 7.13±0.65 200.5±0.89 3.7±0.25 0.41±0.01 3.8±0.28 6.66±0.28 102.98±0.8
H4 31.93±0.41 0.51±0.01 0.59±0.011 1.17±0.016 14.64±1.28 200.2±0.42 3.9±1.10 0.27±0.03 3.6±0.28 6.83±0.28 99.03±0.87
H5 29.36±0.83 0.54±0.005 0.63±0.015 1.16±0.011 14.34±0.80 200.4±0.84 3.9±0.20 0.36±0.02 4.0±0.00 7.00±0.00 100.0±1.0
H6 30.53±1.02 0.53±0.015 0.62±0.02 1.15±0.011 13.63±0.21 199.9±1.28 3.6±0.15 0.29±0.02 3.6±0.28 6.5±0.00 99.67±0.57
H7 29.97±0.28 0.51±0.01 0.6±0.02 1.18±0.005 15.52±0.45 200.3±0.67 4.0±0.00 0.47±0.01 4.00±0.0 6.66±0.28 97.26±0.96
H8 25.79±0.48 0.51±0.01 0.58±0.011 1.14±0.005 12.93±0.19 199.4±1.95 3.3±1.01 0.43±0.01 4.00±0.0 6.5±0.5 98.45±0.03
H9 25.87±0.64 0.56±0.017 0.62±0.037 1.13±0.005 11.90±0.82 199.9±0.87 3.6±0.60 0.32±0.01 3.50±0.5 6.83±0.28 98.33±0.88
H10 28.32±1.06 0.53±0.015 0.59±0.025 1.12±0.014 10.91±0.17 200.7±1.33 3.3±0.2 0.27±0.02 4.00±0.0 7.00±0.00 101.28±0.6
H11 28.16±2.36 0.55±0.011 0.62±0.023 1.13±0.002 12.24±1.42 200±1.15 3.5±0.1 0.42±0.01 3.8±0.28 6.83±0.28 96.37±1.30
H12 28.53±0.48 0.53±0.02 0.58±0.015 1.09±0.013 8.97±1.11 199.8±1.54 3.5±0.20 0.3±0.01 3.56±0.4 6.66±0.57 98.09±0.34
H13 30.18±1.08 0.55±0.015 0.61±0.011 1.11±0.016 10.26±1.46 200.1±0.73 3.5±0.20 0.32±0.02 3.66±0.4 6.83±0.28 97.02±0.75
Optimiz
ed batch 26.52±0.68 0.60±0.01 0.53±0.01 1.12±0.03 11.59±1.38 200.7±0.9 3.3±0.05 0.33±0.02 3.6±0.28 6.66±0.28 98.6±0.013
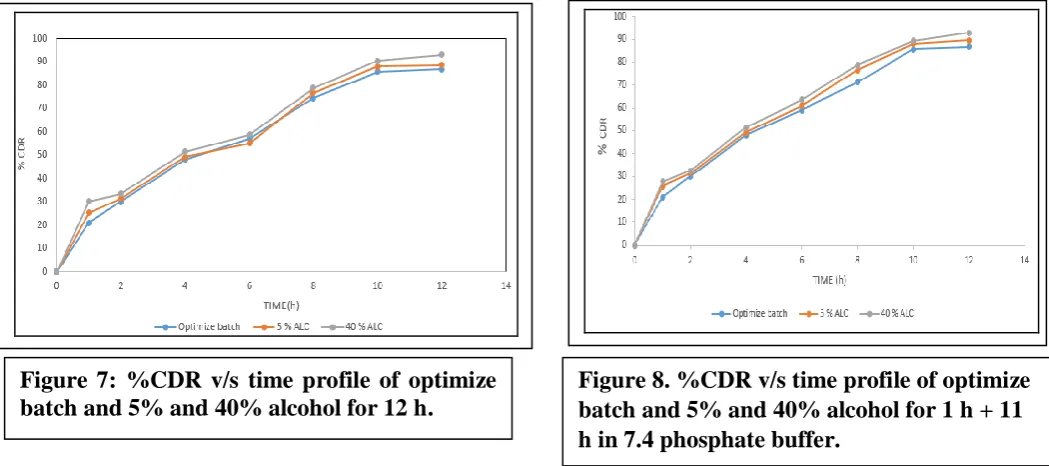
Dissolution profile of formulation in the presence of 5 and 40% alcohol v/v of ethanol are shown figure 7 and 8. For optimized formulation, even extreme exposure to the hydro-alcoholic media for up to 12 h did not result in a failure of the polymer matrices. The differences observed in drug release profiles in different media may be due to changes in drug solubility in the respective media.
Table 5: % swelling index and f1 and f2 value of optimized batch.
Concentration of ethanol
% swelling index f1 and f2 value
0% 5% 40% 5 % 40 %
f1 f2 f1 f2
Exposure to 1 h ethanol 115.09 114.34 112.21 5.02 74.76 8.69 64.91
Exposure to 12 h ethanol 113.74 115.36 111.67 3.90 73.33 8.29 63.79
[image:12.595.46.571.76.309.2]Swelling index of the compact in various media is shown Table 5. It was found that the extent of swelling increased with increase in time. However, no significant difference in swelling index was observed for compact in normal media. This was happened because there was no interaction between ethanol and matrix polymer so there was no change in swelling index of optimized batch in hydro-alcoholic media.
Table 6.0: Stability study parameter.
Parameter 0 day 10 day 20 day 30 day
Hardness (kg/cm2) 3.8 ±0.01 3.8 ± 0.02 4.0 ± 0.04 4.0 ± 0.01
Drug content (%) 98.51 ±1.09 99.67 ± 2.67 97.07 ± 3.02 98.45 ± 0.98
Value: Mean ±SD, n=3
Figure 7: %CDR v/s time profile of optimize batch and 5% and 40% alcohol for 12 h.
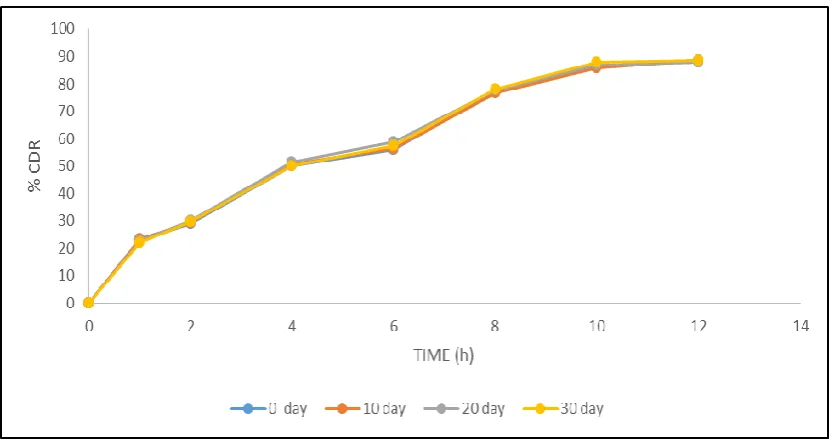
[image:12.595.58.542.464.538.2]Figure 9: In-vitro drug release profile of stability batch.
At the end of study period, sample were analyzed for the drug content, in vitro dissolution, and other physicochemical parameters. After 30 days, there was insignificant change in hardness, drug content and also drug release pattern from the optimized batch. This indicates the stability of the product.
CONCLUSION
In present study, successful formulation of Glipizide SR tablet was formulated using hydrophobic polymer like Gelucire 43/01 and hydrophilic polymer PEO 301. The release profile of optimize batch tablet matches the release profile of marketed preparation as well as matches the USP dissolution criteria for glipizide SR table. Also, no any significant change observed in drug release profile of optimized batch tablet when exposed to hydro alcoholic media for 1h or 12h.
REFERENCES
1. Sampath KP, Bhowmik D, Srivastava S, Paswan S, Dutta AS. “Sustained Release Drug
Delivery System Potential.” Pharma Innov, 2012; 1: 48–60.
2. Bhargava Ankit, Rathore RPS, Tanwar YS, Gupta S BG. “Oral sustained release dosage
form: Opportunity to prolong the release of drugs.” Int J Adv Res Pharm Biosci, 2013; 3:
7–14.
3. Canadian institutes of health research. “Drug bank Glipizide” June 2005
http://www.drugbank.ca/drugs/DB01067.
resistant to alcohol-induced dose dumping - A review.” Eur J Pharm Biopharm, 2014;
87: 217–26.
5. Adel. M. Aly, Ahmed S. Ali. “Preparation and evaluation of glipizide tablets containing
both enhanced and sustained release solid dispersion.” International journal of
pharmaceutical sciences and nanotechnology, 2010; 2: 714-721.
6. Mehmood Y, Basir I, Yousaf H. “Formulation development of glipizide matrix tablet
using different proportion of natural and semi synthetic polymer.” Journal of pharm
analysis and pharmaceutics, 2017; 8: 183-191.
7. Verma S, Rawat A, Saini S. “formulation, evaluation and optimization of solid dispersion
of glipizide using face centered composite design.” International journal of pharmacy
and pharmaceutical science, 2011; 3: 475-482.
8. 58. Choudhari D, Kumar S, Gupta G D. “enhancement of solubility and dissolution of
glipizide by solid dispersion (Kneading method) technique.” Asian journal of
pharmaceutics, 2009; 245-251.
9. Ganesh D, Shah K.H, Sonawane M.B. “formulation development and evaluation of
sustained release matrix tablets of guaiphenesin.” International journal of
pharmaceytical science and nanotechnology, 2016; 9: 3312-3317.
10.Sharma V, Rathi V, Rathi J, Bhowmick M. “pre-formulation, pre compression and post
compression evaluation of bilayer tablet of aspirin as immediate release and nicotinic acid as sustained release.” International journal of pharmaceutical, chemical and biological science, 2017; 7: 55-70.
11.Rao R, Panchal H, Hadi M. A. “formulation and evaluation of biaphasic drug delivery
system of terbutelin sulphate for chronotherapy.” International journal of pharma and bio
science, 2012; 3: 626-637.
12.Ghandhi CK, Mehta TJ, Patel MR, Patel KR. “box-behnken design for optimization of
formulation variables Tramadol HCL sustained release matrix tablet.” International
journal for pharmaceutical research scholar, 2012; 1: 99-114.
13.Wendy L.G, Elizabeth O. B, Felton L.A. “in vitro evaluation of sustained released matrix
tablets containing ibuprofen: a model poorly water-soluble drug.” Brazilian journal of pharmaceuticals sciences, 2016; 52: 751-759.
14.Giri S, Velmurugan S, Chowdari S. “formulation and evaluation of glipizide sustained release matrix tablet.” International journal of pharmacy and pharmaceutical science,
2013; 5: 354-360.
release solid dispersions of nimodipine.” International journal of pharmaceutical
sciences, 2010; 3: 77-82.
16.D. Palmer et al., “The Influence of Hydro-Alcoholic Media on Drug Release From
Polyethylene Oxide Extended-Release Matrix Tablets,” Pharmaceutical Technology,