205
Word Embeddings (Also) Encode Human Personality Stereotypes
Oshin Agarwal
University of Pennsylvania
oagarwal@seas.upenn.edu
Funda Durupinar
Bilkent University
fundad@cs.bilkent.edu.tr
Norman I. Badler
University of Pennsylvania
badler@seas.upenn.edu
Ani Nenkova
University of Pennsylvania
nenkova@seas.upenn.edu
Abstract
Word representations trained on text reproduce human implicit bias related to gender, race and age. Methods have been developed to re-move such bias. Here, we present results that show that human stereotypes exist even for much more nuanced judgments such as per-sonality, for a variety of person identities be-yond the typically legally protected attributes and that these are similarly captured in word representations. Specifically, we collected hu-man judgments about a person’s Big Five per-sonality traits formed solely from information about the occupation, nationality or a com-mon noun description of a hypothetical person. Analysis of the data reveals a large number of statistically significant stereotypes in people. We then demonstrate the bias captured in lexi-cal representations is statistilexi-cally significantly correlated with the documented human bias. Our results, showing bias for a large set of per-son descriptors for such nuanced traits put in doubt the feasibility of broadly and fairly ap-plying debiasing methods and call for the de-velopment of new methods for auditing lan-guage technology systems and resources.
1 Introduction
Implicit association tests probe biases individu-als may harbor, by measuring the reaction times of people when asked to sort word stimuli with clearly positive/negative valance and words asso-ciated with racial groups or less morally relevant categories such as insects/flowers and musical in-struments/weapons (Greenwald et al.,1998). Re-cent work has revealed that word representations trained on large text corpora reproduce human bias in preference to flowers and musical instru-ments, but also disturbingly on gender, race and age-related bias (Caliskan et al.,2017).
These findings pose a dilemma. Having sys-tems learn that flowers/musical instruments are
pleasant and insects/weapons unpleasant appears to be useful common sense knowledge that sys-tems can leverage to better interact with peo-ple1. Having racist, sexist and ageist systems how-ever is highly undesirable, as these are integrated in broader technologies like machine translation, which can reinforce the stereotype2. Stereotypes are highly problematic because even simply evok-ing them can trigger change in behavior (Duguid and Thomas-Hunt,2015;Spencer et al.,2016).
Guided by these compelling arguments, many researchers have started looking for ways to de-bias word representations and language technolo-gies. In response to the examples in the supple-mentary materials in (Caliskan et al.,2017), that Google Translate translates ‘doctor’ as male and ‘nurse’ as female, Google has indeed rolled out a new version of their systems for certain language pairs, in which both translation versions are dis-played3. Similarly, earlier work has zeroed in on the gender bias in word representation and has pro-posed methods for debiasing, which take in a set of words to be debiased as an argument to the al-gorithm (Bolukbasi et al.,2016). Work further de-veloping this line of analysis and debiasing has ap-peared in recent computational linguistics venues (Zhao et al., 2017, 2018; Rudinger et al., 2018). This line of work is in stark contrast with ear-lier work in the field, which treated human stereo-types encoded in text as common sense knowledge that could be helpful in automating tasks such as named entity tagging and coreference resolution (Bergsma and Lin,2006;Ji and Lin,2009).
In this complex context, we set out to study how broad stereotypes are, both in terms of groups
1
Such knowledge will for example make it possible to ac-curately interpret the pragmatic meaning of a person exclaim-ing ”You have a spider on your shoulder!”
2
https://bit.ly/2HXkipB
they may affect and the subtlety of distinction in-volved in the stereotype. For this purpose, we turn to personality stereotypes evoked by a single de-scriptor of a person, such as nationality, profession and arbitrary words describing people. We verify that people hold stereotypes about personality and that the human stereotypes can be recovered fairly accurately from word representations. Given the wide variety of descriptors to which stereotypes apply, we argue that an approach different from classic debiasing approaches for dealing with the problem ought to be established. We discuss some of these thoughts and considerations in the con-cluding section of this paper.
2 Big Five Personality Traits
The Big 5 personality traits, OCEAN, are the most common framework for studying personality in psychology studies (John and Srivastava, 1999). In this framework, personality is described in five dimensions: openness to experience, conscien-tiousness, extroversion, agreeableness and neu-roticism. One of the most compact instruments to assess personality in this scale is the Ten Item Personality Inventory (TIPI) (Gosling et al.,2003). TIPI defines the extreme ends of each personality dimension by two simple descriptions:
Oconventional/uncreative↔open to new experi-ences/complex
C disorganized/careless ↔ dependable/self-disciplined
Ereserved/quiet↔extroverted/enthusiastic Acritical/quarrelsome↔sympathetic/warm Ncalm/emotionally stable↔anxious/easily upset
OCEAN personality traits have been used in a number of computational linguistics studies such as developing dialog systems whose generation components can be tuned to project specific per-sonality (Mairesse and Walker, 2007), predict-ing perceived personality from social media posts (Celli et al., 2013; Kosinski et al., 2013), au-tomatic personality detection from essays ( Ma-jumder et al.,2017) and predicting specific traits, such as neuroticism, strongly linked with risk for depression and anxiety (Resnik et al.,2013).
3 Human Stereotype Collection
We collected human personality stereotypes for 98 professions and 135 nationalities, recruiting
par-ticipants on Amazon Mechanical Turk4. The pro-fessions were drawn from the list of nouns that are children of the node ‘person’ in the WordNet Is-A hierarchy. The list is large, with over 2,300 en-tries overall. From this list, two of the authors se-lected 98 professions. Similarly, nationalities were drawn for the CIA fact book and narrowed down to 135 by two of the authors. We used the Ten Item Personality Inventory (TIPI) (Gosling et al.,2003) to elicit the participant expectations about the per-sonality of people with given nationalities or pro-fessions. Participants were given tasks consist-ing of ten nationalities/professions, to be judged for a single personality trait. The top of the page displayed the TIPI ends for the personality di-mensions presented above. The participants were asked to rate where a person with the given pro-fession/nationality will fall on a 7-point scale. The middle of the scale is interpreted as‘have no ex-pectation/could be either’, -3 corresponds to the negative end of the dimension defined by the de-scription on the left above and 3 corresponds with the positive end of the dimension defined by the description on the right. The order of the nation-alities/professions was randomly assigned in each task. One of the ten professions/ nationalities in the task was a repeat. This was used for quality control. Participants who gave different rating for the repeated nationality/profession were excluded from the study, as were participants who gave the same answer for all ten nationalities/ professions.
Only participants residing in the United States were given access to the task.
4 Analysis of Human Bias
After excluding inconsistent participants, we had 30 judgments for the vast majority of nationalities and 25 judgments for the professions.
We use the Wilcoxon signed-rank test to deter-mine if the mean of the human judgments for each of the five personality traits is different from zero at 95% confidence. We found that 92.5% of the na-tionalities had at least one statistically significant personality trait; about 40% had numerical values greater than 1 or less than -1 on the seven point scale, indicating a high bias. Similarly, 98% of the professions had at least one statistically significant with personality trait5; about 94% had numerical
4
Data available at https://github.com/ oagarwal/personality-bias
com-Professions Nationalities
mean>0 mean<0 mean>1 mean<-1 mean>0 mean<0 mean>1 mean<-1
O 33.6 31.6 27.5 18.3 23.7 17.03 18.5 11.8
C 77.5 1 67.3 1 32.5 5.9 16.2 0
E 37.7 18.3 28.5 9.1 19.2 40.7 14.8 5.9
A 41.8 16.3 27.5 9.1 37 9.6 9.6 1.4
[image:3.595.94.507.61.135.2]N 6.1 31.6 3 12.2 23.7 20 8.1 12.5
Table 1: Percentage of professions and nationalities with statistically significant human bias towards specific per-sonality traits i.e mean different from zero at 95% confidence using Wilcoxon signed rank test.
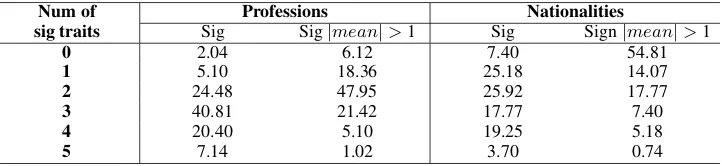
Num of Professions Nationalities
sig traits Sig Sig|mean|>1 Sig Sign|mean|>1
0 2.04 6.12 7.40 54.81
1 5.10 18.36 25.18 14.07
2 24.48 47.95 25.92 17.77
3 40.81 21.42 17.77 7.40
4 20.40 5.10 19.25 5.18
5 7.14 1.02 3.70 0.74
Table 2: Column 1 is percentage of professions or nationalities with n out of 5 statistically significant personality traits i.e mean different from zero at 95% confidence using Wilcoxon signed rank test. Column 2 is percentage of professions or nationalities with n out of 5 statistically significant personality traits and absolute value of mean greater than equal to 1 indicating high bias.
values greater than 1 or less than -1. Often people, including the authors, expect bias to be negative but most of the bias we observe is positive: certain groups were perceived to be agreeable, open to ex-periences, conscientious and not neurotic. These results can be seen in Table1.
The existence of national stereotypes (from members of the same nation) has been docu-mented, and also shown not to correlate at all with actual self-reported or perceived personalities of the members of the culture (Terracciano et al., 2005). In our study, the nationality stereotypes are from Americans towards other cultures and are likely similarly unfounded. Many of the stereo-types we observe in our study are predictable: Australians and Swedish are ranked at the top positive end for openness; Japanese and Chinese are most conscientious; Americans are extroverts; Canadians and New Zealanders are rated as most agreeable. In professions, priests and accountants are perceived as least open; drug dealers as least conscientious; chemists and mathematicians as in-troverts; drug dealers and prosecutors as disagree-able; tour guides and pianists as least neurotic.
There were few professions/nationalities for which all five dimensions of personality were sta-tistically significant. Australians, Finnish, New Zealanders, tour guides, designers, house
decora-parisons. A number of these findings may be spurious but the number of significant finding far exceeds the 5% expected significant results due to statistical chance.
tors, art dealers have highly positive bias towards them. Judges and senators have also significant bias in all traits, but direction varies across traits for them. Overall statistics are shown in Table2.
5 Personality Bias Prediction
In this section, we test the extent to which the stereotypes in the human data can be explained by co-occurrence statistics between the nationality/ profession and descriptors related to the person-ality dimensions. Prior work (Bhatia, 2016) has shown that co-occurrence statistics can be used to predict human bias towards probability of occur-rence of real-life events such as terrorist attacks.
In the prominent work on word representations and bias (Caliskan et al.,2017), human stereotypes were reconstructed by substituting human reaction times in sorting words with the cosine similarity between sets of words. In the original psychol-ogy studies, the word stimuli are drawn from prior studies which established that people consider cer-tain words to be highly positive or negative. For example, some words with positive connotations used in the study include ‘freedom, rainbow, mir-acle, laughter’ and words with negative connota-tions include ‘abuse, sickness, tragedy, ugly’.
[image:3.595.120.481.178.261.2]Trait Positive-end words Negative-end words
O
intelligent, perceptive, analytical, reflective, curious, imaginative, creative, cultured, refined, sophisticated
unintelligent, imperceptive, unanalytical, unreflective, uninquisitive, unimaginative, uncreative, uncultured,
unrefined, unsophisticated
C
organized, responsible, reliable, conscientious, practical, thorough, hardworking, thrifty, cautious, serious
disorganized, irresponsible, undependable, negligent, impractical, careless, lazy, extravagant, rash, frivolous
E
extroverted, energetic, talkative, enthusiastic, bold, active, spontaneous, assertive, adventurous, sociable
introverted, unenergetic, silent, unenthusiastic, timid, inactive, inhibited, unassertive, unadventurous,
unsociable
A
warm, kind, cooperative, unselfish, polite, agreeable, trustful, generous, flexible, fair
cold, unkind, uncooperative, selfish, rude, disagreeable, distrustful, stingy, inflexible, unfair
N
angry, tense, nervous, envious, unstable, discontented, insecure, emotional, guilt-ridden, moody
[image:4.595.74.525.58.196.2]calm, relaxed, at ease, not envious, stable, contended, secure, unemotional, guilt-free, steady
Table 3: Goldberg markers for personality traits
category of person descriptors, demonstrating that a long list of arbitrary person categories may trig-ger stereotypes in people and that these stereo-types are recoverable from text embeddings.
We use off-the-shelf word representations to measure the (cosine) similarity between a list of personality descriptors and a target nationality or profession. We experimented with GloVe rep-resentations (Pennington et al., 2014) trained on Common crawl (6B tokens, 400K vocab, 300d) and symmetric pattern (SP) based representations (Schwartz et al., 2015). We used TIPI to collect human judgments but these descriptors of person-ality are likely too short for the noisy automatic creation of personality stereotypes. For this rea-son, we use a larger inventory of personality trait descriptors, Goldbergs Big Five markers ( Gold-berg,1992). It has about ten descriptors associated with each of the positive and negative dimensions of a personality trait, all shown in Tables3.
Different words and phrases are present in the two vector representations in our study. While multi-word expressions such as ‘drug dealer’ and ‘movie star’ are present in the SP embeddings, they are missing from the GloVe embeddings. Some other words such as ‘guilt-ridden’ and ‘guilt-free’ are present in GloVe embeddings but missing from the SP embeddings. Results for each representation are reported using all markers and person descriptors available in the representation.
Lettdenote a target description of a person (eg. doctor),pdbe the set ofpositiveGoldberg person-ality markers (eg. energetic, extrovert) for a trait andndbe the set ofnegativeGoldberg personality markers (eg. reserved, introvert)) for a trait. We first develop a baseline where the predicted bias score is the difference between the mean of the co-sine similarity of target description t with each of the positive markers for the trait, and the mean
co-sine similarity of t with each of the negative mark-ers for the trait. We build separate models for each of the five personality traits. Each of the models has descriptions of both nationalities and profes-sions and we do not differentiate between the two.
score=
P
p∈pdsim(t, p)
|pd| −
P
n∈ndsim(t, n) |nd|
Next, we use linear regression to predict the per-sonality scores using as features the cosine simi-larity of target description of the person with each of the Goldberg personality markers (eg. ener-getic, introvert) for the trait.
score= X
p∈pd
wpsim(t, p) +
X
n∈nd
wnsim(t, n)
where wn,p are weights learned by regression
for each of the Golderberg personality markers. We do leave-one-out cross validation because we have human judgements for just 233 descrip-tions of people. Finally, we calculate the Spear-man correlation of the scores on thentest points, one from each model in cross validation with the average human scores.
Further, we test the model on new descrip-tions from WordNet6. We randomly selected 140 descriptions and crowdsourced judgments about them in the same manner as the training data. The resulting correlations can shown in Table4.
On the leave-one-out results on the training data consisting of nationalities and professions, the re-gression model is clearly superior to the unsuper-vised baseline. On the test data, the best corre-lation for Conscientiousness and Agreeableness is achieved by the baseline with SP representations.
6Specifically 2,638 descriptions, not in the training data,
Train Test
Baseline Linear Regr Baseline Linear Regr
Glove SP Glove SP Glove SP Glove SP
O 0.230 0.160 0.519 0.615 0.359 0.380 0.524 0.365
C 0.439 0.618 0.683 0.686 0.459 0.695 0.503 0.611
E 0.364 0.274 0.481 0.298 0.180 0.174 0.272 0.246
A 0.131* 0.295 0.407 0.396 0.414 0.538 0.421 0.451
N 0.092* 0.201 0.299 0.438 0.244 0.396 0.449 0.343
*
[image:5.595.115.483.61.148.2]Not significant
Table 4: Spearman correlation between human bias and predicted personality on the leave-one-out predictions for the training set, and on generic noun descriptions for the test set.
Description Trait Human bias
Glove SP
Cook O 1.59 1.97 0.59
Assistant C 1.30 2.12 1.55
Herbalist E -0.91 -0.46 -0.8
Fugitive A -1.14 -0.36 -2.24
Ex-husband N 1.25 1.11
-Table 5: Predicted scores on new descriptions.
We also computed the class of bias for each of the predictions—positive bias, negative bias and no bias.7 The accuracy was 55-60% for each of the cases except neuroticism (42%). Both representa-tions assigned the same bias class for 65%, 80%, 73%, 79% and 93% descriptions for OCEAN traits respectively. There is no clear word representation that works consistently better.
All correlations are statistically significant and hold up well between the training and test data, even though the test data has much more varied de-scriptions of people. Notably, Openness and Con-scientiousness are predicted most accurately and for a number of personality dimensions the results on the heterogeneous test set are higher than for the training set of nationality and professions.
Some examples which stood out, of test descrip-tions and bias scores are shown in Table5.8 People have a significant bias which is being predicted by the classifier based on embeddings as well. The classifier (Glove) predicted high bias i.e score≥1
or ≤ −1 for 21%, 23%, 14.5%, 11% and 2.5% of the 2,638 WordNet person descriptors for the OCEAN traits respectively.
6 Discussion and conclusion
We introduced a corpus of human stereotypes of personality. We showed that the off the shelf
vec-7We consider predicted scores between 1 and -1 to mean
that there is no bias.
8Predictions on all the 2,638 WordNet descriptions are
also available at https://github.com/oagarwal/ personality-bias
tor space representations can be leveraged to de-rive personality stereotypes from corpora. We used the model to make predictions on thousands of person descriptors, with larger samples. This list allows us to inspect a much larger scope of possible bias than smaller targeted categories. For example, in much more controversial direction of work, our approach can be used to train a model that predicts sentiment valence, possibly starting with words from prior studies. Then we can, as we did in the work here, predict which other words may have similar bias, potentially recover-ing many more nuanced groups.
Our findings indicate that debiasing methods that need explicit set of words to be debiasedare unlikely to be effective in removing all stereotype-like data. Moreover, as has been now revealed, debiasing methods only mask the bias rather than fully remove it from influence on downstream tasks like clustering and gendered prediction ( Go-nen and Goldberg,2019).
[image:5.595.73.290.209.282.2]References
Shane Bergsma and Dekang Lin. 2006. Bootstrapping path-based pronoun resolution. In Proceedings of the 21st International Conference on Computational Linguistics and the 44th Annual Meeting of the As-sociation for Computational Linguistics, ACL-44, pages 33–40, Stroudsburg, PA, USA. Association for Computational Linguistics.
Sudeep Bhatia. 2016. Vector space semantic mod-els predict subjective probability judgments for real-world events. In Proceedings of the 38th annual conference of the cognitive science society, pages 1937–1942.
Tolga Bolukbasi, Kai-Wei Chang, James Y Zou, Venkatesh Saligrama, and Adam T Kalai. 2016. Man is to computer programmer as woman is to homemaker? debiasing word embeddings. In Ad-vances in neural information processing systems, pages 4349–4357.
Aylin Caliskan, Joanna J Bryson, and Arvind Narayanan. 2017. Semantics derived automatically from language corpora contain human-like biases. Science, 356(6334):183–186.
Fabio Celli, Fabio Pianesi, David Stillwell, and Michal Kosinski. 2013. Workshop on computational per-sonality recognition (shared task). InProceedings of the Workshop on Computational Personality Recog-nition.
Michelle M Duguid and Melissa C Thomas-Hunt. 2015. Condoning stereotyping? how aware-ness of stereotyping prevalence impacts expression of stereotypes. Journal of Applied Psychology, 100(2):343.
Lewis R Goldberg. 1992. The development of mark-ers for the big-five factor structure. Psychological assessment, 4(1):26.
Hila Gonen and Yoav Goldberg. 2019. Lipstick on a pig: Debiasing methods cover up systematic gender biases in word embeddings but do not remove them. NAACL’19.
Samuel D Gosling, Peter J Rentfrow, and William B Swann Jr. 2003. A very brief measure of the big-five personality domains. Journal of Research in person-ality, 37(6):504–528.
Anthony G Greenwald, Debbie E McGhee, and Jor-dan LK Schwartz. 1998. Measuring individual dif-ferences in implicit cognition: the implicit associa-tion test. Journal of personality and social psychol-ogy, 74(6):1464.
Heng Ji and Dekang Lin. 2009. Gender and animacy knowledge discovery from web-scale n-grams for unsupervised person mention detection. In Pro-ceedings of the 23rd Pacific Asia Conference on Language, Information and Computation, PACLIC 23, Hong Kong, China, December 3-5, 2009, pages 220–229.
Oliver P John and Sanjay Srivastava. 1999. The big five trait taxonomy: History, measurement, and theoret-ical perspectives. Handbook of personality: Theory and research, 2(1999):102–138.
Daniel Kahneman. 2011. Thinking, fast and slow, vol-ume 1. Farrar, Straus and Giroux New York.
Michal Kosinski, David Stillwell, and Thore Graepel. 2013. Private traits and attributes are predictable from digital records of human behavior. Proceed-ings of the National Academy of Sciences, page 201218772.
Dermot Lynott, Louise Connell, Kerry S O’Brien, and Himanshu Kansal. Modelling the iat: Implicit as-sociation test reflects shallow linguistic environment and not deep personal attitudes.
Franc¸ois Mairesse and Marilyn Walker. 2007. Person-age: Personality generation for dialogue. In Pro-ceedings of the 45th Annual Meeting of the Associa-tion of ComputaAssocia-tional Linguistics, pages 496–503.
N. Majumder, S. Poria, A. Gelbukh, and E. Cambria. 2017. Deep learning-based document modeling for personality detection from text. IEEE Intelligent Systems, 32(2):74–79.
Jeffrey Pennington, Richard Socher, and Christopher Manning. 2014. Glove: Global vectors for word representation. InProceedings of the 2014 confer-ence on empirical methods in natural language pro-cessing (EMNLP), pages 1532–1543.
Philip Resnik, Anderson Garron, and Rebecca Resnik. 2013. Using topic modeling to improve prediction of neuroticism and depression in college students. In Proceedings of the 2013 conference on empiri-cal methods in natural language processing, pages 1348–1353.
Rachel Rudinger, Jason Naradowsky, Brian Leonard, and Benjamin Van Durme. 2018. Gender bias in coreference resolution. InProceedings of the 2018 Conference of the North American Chapter of the Association for Computational Linguistics: Human Language Technologies, Volume 2 (Short Papers), pages 8–14. Association for Computational Linguis-tics.
Roy Schwartz, Roi Reichart, and Ari Rappoport. 2015. Symmetric pattern based word embeddings for im-proved word similarity prediction. In Proceed-ings of the Nineteenth Conference on Computational Natural Language Learning, pages 258–267.
Steven J Spencer, Christine Logel, and Paul G Davies. 2016. Stereotype threat. Annual review of psychol-ogy, 67:415–437.
Jieyu Zhao, Tianlu Wang, Mark Yatskar, Vicente Or-donez, and Kai-Wei Chang. 2017. Men also like shopping: Reducing gender bias amplification us-ing corpus-level constraints. In Proceedings of the 2017 Conference on Empirical Methods in Natural Language Processing, EMNLP 2017, Copenhagen, Denmark, September 9-11, 2017, pages 2979–2989.