A deep-learning based native-language classification
by using a latent semantic analysis
for the NLI Shared Task 2017
Yoo Rhee Oh, Hyung-Bae Jeon∗, Hwa Jeon Song, Yun-Kyung Lee,Jeon-Gue Park, andYun-Keun Lee
Speech Intelligence Research Group,
Electronics and Telecommunications Research Institute, South Korea
{yroh,hbjeon,songhj,yunklee,jgp,yklee}@etri.re.kr
Abstract
This paper proposes a deep-learning based native-language identification (NLI) using a latent semantic analysis (LSA) as a par-ticipant (ETRI-SLP) of the NLI Shared Task 2017 (Malmasi et al., 2017) where the NLI Shared Task 2017 aims to de-tect the native language of an essay or speech response of a standardized assess-ment of English proficiency for academic purposes. To this end, we use the six unit forms of a text data such as char-acter 4/5/6-grams and word 1/2/3-grams. For each unit form of text data, we con-vert it into a count-based vector, extract a 2000-rank LSA feature, and perform a lin-ear discriminant analysis (LDA) based di-mension reduction. From the count-based vector or the LSA-LDA feature, we also obtain the output prediction values of a support vector machine (SVM) based clas-sifier, the output prediction values of a deep neural network (DNN) based classi-fier, and the bottleneck values of a DNN based classifier. In order to incorporate the various kinds of text-based features and a speech-based i-vector feature, we design two DNN based ensemble classi-fiers for late fusion and early fusion, re-spectively. From the NLI experiments, the F1 (macro) scores are obtained as 0.8601, 0.8664, and 0.9220 for the essay track, the speech track, and the fusion track, respec-tively. The proposed method has compa-rable performance to the top-ranked teams for the speech and fusion tracks, although it has slightly lower performance for the essay track.
∗Corresponding author
1 Introduction
Native-language identification (NLI) can be used to improve the performance of automatic speech recognition (ASR) for non-native speakers us-ing native-language (L1) specific ASR systems. NLI can also be used in a computer-assisted language learning system using the L1-specific target-language errors. A considerable body of re-search on NLI has been reported (Malmasi,2016; Malmasi and Dras, 2015) and the developed ap-proaches can be classified into text-based NLI (Tetreault et al., 2013), speech-based NLI (Mal-masi et al.,2016), and text and speech based NLI (Zampieri et al.,2017). Among them, this paper focuses on the NLI of text and speech data for the NLI Shared Task 2017 (Malmasi et al.,2017).
The first NLI Shared Task aims to identify the L1 of the text data of an essay response (Tetreault et al., 2013). Notably, a part of the 2016 Com-putational Paralinguistics Challenge focuses on speech-based NLI (Schuller et al., 2016). This year, the goal of the NLI Shared Task 2017 is to detect the L1 of the essay and speech responses of a standardized assessment of English profi-ciency for academic purposes among eleven L1s, Arabic, Chinese, French, German, Hindi, Italian, Japanese, Korean, Spanish, Telugu, and Turkish. To this end, there are 11,000 training data set, 1,100 development data set, and 1,100 test data set. In addition, each data set contains the text of an essay response, the transcription text and 800-dimensional i-vector feature of a speech response, and the L1 annotation of the participant of essay and speech responses.
In this paper, we propose a deep-learning based NLI method using a latent semantic analysis (LSA) as a participant (ETRI-SLP) of the NLI Shared Task 2017. First, the higher-rank of an LSA feature is used to detect L1 information; the
lower-rank of an LSA feature is used to detect doc-ument topic information (Jeon and Lee, 2016b; Bellegarda, 2000). Second, we adopt a state-of-the-art machine learning methods, a deep-learning method (Jeon and Lee,2016a;Chung and Park,in review), for L1 classification using various kinds of text-based features and a speech-based feature. 2 Feature extraction of the proposed
method
2.1 Data preparation
For the text data of the NLI Shared Task 2017 such as the text of an essay response and the transcription text of a speech response, we use six unit forms for each text: (a) word 1-gram, (b) word 2-gram, (c) word 3-gram, (d) ter 4-gram, (e) character 5-gram, and (f) charac-ter 6-gram. It is assumed that a word n-gram could reveal L1-specific words (e.g. ‘kimchi’ is a Korean food name) and L1-specific word se-quences while a character n-gram could capture L1-specific typing errors, L1-specific character se-quence patterns, etc.
First, each unit of a text is converted into a count-based vector and then entropy normaliza-tion (Jeon and Lee, 2016b; Bellegarda, 2000) is applied to the count-based vector. Next, the nor-malized count-based vector (Rawcount) is used to extract the 2000-rank features of a latent seman-tic analysis (LSA) (Jeon and Lee, 2016b; Belle-garda, 2000). The LSA feature is subsequently compressed into 10-dimensional features using a linear discriminant analysis (LDA), which is re-ferred to asRawLSA2000/LDA10hereafter. It is
as-sumed that the high-rank LSA features could cap-ture the L1 characteristics.
For a speech data set of the NLI Shared Task 2017, we only use the 800-dimensional i-vector feature of each speech response, which is sup-ported by the organizers (Malmasi et al., 2017). In addition, we apply LDA normalization to the i-vector features.
2.2 Feature extraction
We extract five kinds of features from the
Rawcount or RawLSA2000/LDA10 of each unit
form of a text for an L1 classification: (a) the out-put prediction values (SV Mcount
output) of a SVM clas-sifier using the Rawcount, (b) the output predic-tion values (SV MoutputLSA2000/LDA10) of a SVM clas-sifier using the RawLSA2000/LDA10, (c) the
out-FC, 256 tanh DO
FC, 256 tanh
FC, 256 tanh
Lossout, 11 softmax
Input Output, 11
LSA-LDA, 10 Mean/Var.. Norm.
(a) DNNoutputLSA2000/LDA10
Lossout, 11 softmax Output, 11 FC, 256
tanh DO FC, 256
tanh FC, 256
tanh Input
LSA-LDA, 10 Mean/Var. Norm.
FC, 32 tanh
[image:2.595.310.528.65.166.2](b)DNNbottleneckLSA2000/LDA10
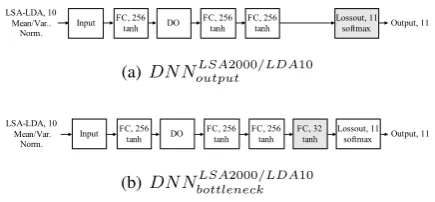
Figure 1: Configuration of the two DNNs for the
DNNLSA2000/LDA10
output and the DNNbottleneckLSA2000/LDA10,
re-spectively.
put prediction values (DNNoutputLSA2000/LDA10) of a DNN classifier using the RawLSA2000/LDA10,
(d) the bottleneck (Gr´ezl et al., 2007) values (DNNbottleneckLSA2000/LDA10) of the last hidden layer of a DNN classifier using the RawLSA2000/LDA10, and (e) theRawLSA2000/LDA10itself.
For theSV Mcount
output andSV MoutputLSA2000/LDA10, a linear kernel SVM is trained using SVM-Light tool (Joachims, 1999). In addition, two kinds of DNNs are trained for the DNNoutputLSA2000/LDA10
andDNNbottleneckLSA2000/LDA10, respectively, as shown in Fig. 1. In other words, the input features are normalized to a zero mean and unit variance and the output layer of each DNN is a softmax layer with eleven nodes that correspond to the eleven L1s. In order to prevent overfitting, dropout (DO) hidden layers are inserted. Moreover, each fully-connected (FC) hidden layer uses a hyperbolic tangent (tanh) activation function. As shown in Fig. 1(a), DNNoutputLSA2000/LDA10 consists of one input layer, four hidden layers, and one output layer. The first, third, and fourth hidden lay-ers are FC laylay-ers where each layer contains 256 nodes, while the second hidden layer is a DO layer. On the other hand, the difference between
DNNbottleneckLSA2000/LDA10fromDNNoutputLSA2000/LDA10
is that one additional hidden layer with 32 nodes is inserted before the output layer for bottleneck feature extraction, as shown in Fig.1(b).
3 DNN based classifier for the NLI Shared Task 2017
Text conversion to unit forms
Raw feature extraction
Classifier based feature extraction
Vanilla DNN based ensemble classifier for a late fusion
Feature concatenation & normalization
DNN classifier
DNN bottleneck
SVM classifier LSA/LDA
SVM classifier Counter vector character
4-gram character 5-gram character 6-gram 1-gramword 2-gramword 3-gramword
Essay response text
i-vector
Speech response signal Speech response
transcription text
𝑆𝑉𝑀$%&'%&($%)& 𝑆𝑉𝑀$%&'%&*+,-.../*0,1.𝐷𝑁𝑁$%&'%&*+,-.../*0,1.
𝑅𝑎𝑤*+,-.../*0,1.𝐷𝑁𝑁7$&&89)9(:*+,-.../*0,1.𝑖 − 𝑣𝑒𝑐𝑡𝑜𝑟
⋯
(a) A vanilla DNN based ensemble classifier for late fusion
Text conversion to unit forms
Raw feature extraction
Multi-column deep-stacking DNN based ensemble classifier for an early fusion DNN bottleneck LSA/LDA
Counter vector character
4-gram character 5-gram character 6-gram 1-gramword 2-gramword 3-gramword Essay response text
i-vector Speech response
signal Speech response
transcription text
LSA/LDA feature layers
Fusion layers
DNN bottleneck feature layers i-vector layers
⋯ ⋯ ⋯
⋯
[image:3.595.77.289.61.291.2](b) A multi-column deep-stacking DNN based ensemble clas-sifier for early fusion
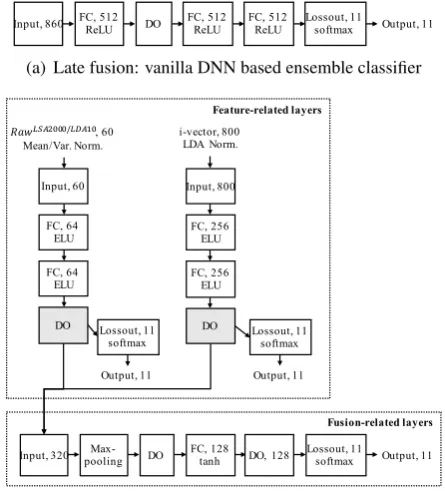
Figure 2: The two kinds of DNN based ensemble classifiers for early fusion and late fusion, respectively.
the NLI Shared Task 2017, we design two DNN based classifiers: (a) a vanilla DNN based ensem-ble classifier for late fusion and (b) a multi-column deep-stacking DNN based ensemble classifier for early fusion, as shown in Fig. 2. Basically, each output layer of the proposed DNN based ensem-ble classifiers is a softmax layer with eleven nodes that correspond to the eleven native languages.
• A vanilla DNN based ensemble classifier for late fusion:
A late fusion method (Snoek et al., 2005) is a feature combination method that gener-ates a feature-based classifier corresponding to each feature and then performs classifica-tion using the output values of the feature-based classifiers. As shown in Fig. 2(a), the vanilla DNN based ensemble classifier is designed for late fusion using the output prediction values of the feature-based classi-fiers,SV Mcount
output,SV MoutputLSA2000/LDA10, and
DNNoutputLSA2000/LDA10. In other words, we concatenate the text-based and speech-based features including the output values of the feature-based classifiers and then apply the concatenated feature input data of the vanilla DNN based ensemble classifier for the fu-sion. Moreover, the vanilla DNN based en-semble classifier consists of one input layer, several hidden layers, and one output layer.
• A multi-column deep-stacking DNN based ensemble classifier for early fusion: An early fusion method (Snoek et al.,2005) is a feature combination method that fuses several kinds of features. As shown in Fig. 2(b), the multi-column (Ciresan et al.,2012) deep-stacking DNN based ensemble classi-fier is designed for early fusion. In other words, each feature is fed into the multi-column deep-stacking DNN and then linked to the corresponding feature layer. The node values of the last hidden layer of each feature-related layers are then connected to the in-put layer of the fusion-related layers. More-over, the feature-related layers and fusion-related layers all have different configura-tions since the proposed multi-column deep-stacking DNN based ensemble classifier aims to efficiently combine heterogeneous fea-tures.
In particular, the overall network of the multi-column deep-stacking DNN based ensemble clas-sifier is trained with a single objective function while the vanilla DNN based ensemble classifier is trained with multiple object functions such as (a) the objective functions for the feature-based clas-sifiers and (b) the objective function for fusion. In this paper, SV Mcount
feature-DO FC, 256 tanh DO
FC, 256 tanh
Input, 450 Lossout, 11
softmax Output, 11
Figure 3: Configuration of the vanilla DNN based ensem-ble classifier for the essay track, where each block indicates a layer of the DNN and the number in a block indicates the number of nodes in the corresponding layer.
based classifiers for the vanilla DNN based ensem-ble classifier.
4 Results
This section presents the submitted experimental setups and the performances for the three tracks of the NLI Shared Task 2017: (a) the essay track us-ing the texts of the essay responses, (b) the speech track using the transcription texts and i-vector fea-tures of the speech responses, and (c) the fusion track using both the texts of the essay responses and the transcription texts and i-vector features of the speech responses. In the experiments of the essay track, we also examine the performance of each unit form of a text while the feature com-binations are examined in the experiments of the speech track. In addition, the performance is com-pared with the classification accuracy metric when evaluating the 1,100 development data set.
4.1 The experimental setup and its performances for the essay track
For the L1 detection of the essay track, we only used the vanilla DNN based ensemble classifier with the assumption that the text-related features were not extremely heterogeneous for each other. The submitted ETRI-SPL NLI system for the es-say track was performed as follows.
We first transformed each text data into the six unit forms such as word 1/2/3-grams and character 4/5/6-grams. Then, we extracted the five features (SV Mcount
output, SV MoutputLSA2000/LDA10,
DNNoutputLSA2000/LDA10, DNNbottleneckLSA2000/LDA10, and RawLSA2000/LDA10) for each
unit-transformed text. As a result, we obtained the thirty features for each text and then con-catenated them into one 450-dimensional feature. The concatenated feature was then normalized to a zero mean and unit variance. After that, the normalized feature was fed into the input layer of a vanilla DNN based ensemble classifier. As shown in Fig.3, the vanilla DNN based ensemble classifier for the essay track consisted of an input
Unit Feature Norm. Accuracy
dimension method
Official baseline 0.7236
word 1-gramRawLSA2000/LDA10 10 Mean/Var.. 0.7764
word 2-gramRawLSA2000/LDA10 10 Mean/Var. 0.7909
word 3-gramRawLSA2000/LDA10 10 Mean/Var. 0.7045
character 4-gramRawLSA2000/LDA10 10 Mean/Var. 0.7736
character 5-gramRawLSA2000/LDA10 10 Mean/Var. 0.8064
character 6-gramRawLSA2000/LDA10 10 Mean/Var. 0.8164
Table 1: Performance comparison of each unit form of
the DNNLSA2000/LDA10output of the proposed method for the
essay track when evaluating the development data, where ‘Mean/Var.’ indicates the normalization to the zero mean and unit variance.
layer, first and third DO hidden layers, second and fourth FC hidden layers, and an output layer. Each FC layer contained 256 nodes with a tanh activation function.
Prior to the performance comparison of the pro-posed ETRI-SPL NLI for the essay track, we evaluated the performance corresponding to each unit form. To this end, we extracted the six
RawLSA2000/LDA10 features for the word
1/2/3-grams and character 4/5/6-1/2/3-grams, respectively. Then, we generated the vanilla DNN based ensem-ble classifier using each of the six features. After that, the six classifiers were evaluated for the de-velopment data. It was shown from the second, third, and fourth rows of Table1 that the perfor-mances corresponding to the wordn-grams were improved except for the word 3-gram when com-pared to the performance of the official baseline. It was noted that the performance degradation cor-responding to the word 3-gram was occurred due to a data sparseness. Moreover, it was shown from the fifth, sixth, and seventh rows of the table that the performances corresponding to the char-actern-grams were improved according to the in-crease of the n-gram order. Especially, the per-formance corresponding to the character 6-gram outperformed among the others.
Next, we evaluated the performance corre-sponding to each feature type. In other words, we extracted each of the five feature types using the six unit forms of a text. After that, we generated the five vanilla DNN based ensemble classifiers corresponding to the feature types and then we measured the accuracy-based performance for the development data. As shown in the second, third, fourth, fifth, and sixth rows of Table 2, the accuracies were ranged from 0.8273 to 0.8364 for each classifier using the SV Mcount
Feature Feature Norm. Accuracy dimension method
Official baseline 0.7236
Late fusion: vanilla DNN based ensemble classifier (a)SV Mcount
output 66 Mean/Var. 0.8345 (b)SV MLSA2000/LDA10
output 66 Mean/Var. 0.8364 (c)DNNLSA2000/LDA10
output 66 Mean/Var. 0.8345 (d)DNNLSA2000/LDA10
[image:5.595.307.530.62.309.2]bottleneck 192 Mean/Var. 0.8273 (e)RawLSA2000/LDA10 60 Mean/Var. 0.8318 (a)+(b)+(c)+(d)+(e) (ETRI-SLP) 450 Mean/Var. 0.8445
Table 2: Performance comparison of the proposed method for the essay track when evaluating the development set, where ‘Mean/Var.’ indicates the normalization to the zero mean and unit variance.
SV MoutputLSA2000/LDA10, DNNoutputLSA2000/LDA10,
DNNbottleneckLSA2000/LDA10, and RawLSA2000/LDA10,
respectively. Thus, it could be noted that each feature type successes to combine the six unit forms.
Finally, the accuracy of the proposed ETRI-SPL NLI for the essay track was 0.8445 using the thirty features by combining the six unit forms and the five feature types, as shown in the last row of the figure. When compared to the above rows of the figure, we concluded that the thirty features were well combined for the NLI.
4.2 The experimental setup and its performances for the speech track
For the L1 detection of the speech track using the transcription text and i-vector feature of a speech response, we used the multi-column deep-stacking DNN based ensemble classifier with the assump-tion that the text-related features were clearly het-erogeneous to the speech-related i-vector feature. Moreover, we empirically selected the feature,
RawLSA2000/LDA10, for the efficient combination
with the text-related features and the i-vector fea-ture. The submitted ETRI-SPL NLI for the speech track was performed as follows.
We first transformed each transcription text into the six unit forms and then extracted the
RawLSA2000/LDA10 for each unit-transformed
text. In addition, we used the 800-dimensional i-vector feature for each speech response signal. The text-related feature was then normalized to a zero mean and unit variance and the i-vector fea-ture was normalized using a LDA normalization. As shown in Fig. 4(b), the RawLSA2000/LDA10
and i-vector features were fed into the LSA/LDA feature layers and the i-vector layers, respectively. The node values of the last hidden layer of each
FC, 512
ReLU DO FC, 512ReLU FC, 512ReLU Lossout, 11softmax
Input, 860 Output, 11
(a) Late fusion: vanilla DNN based ensemble classifier
Feature-related layers
Fusion-related layers
FC, 64 ELU
FC, 64 ELU
DO Input, 60
Output, 11 𝑅𝑎𝑤$%&'(((/$*&+(, 60
Mean/Var. Norm.
FC, 256 ELU
FC, 256 ELU
DO Input, 800 i-vector, 800
LDA Norm.
Lossout, 11
softmax Lossout, 11softmax
Output, 11
Max-pooling DO
FC, 128 tanh DO, 128
Lossout, 11 softmax
Input, 320 Output, 11
[image:5.595.72.287.64.171.2](b) Early fusion: multi-column deep-stacking DNN based en-semble classifier
Figure 4: Configuration of the two DNN based ensemble classifiers for the speech track, where each block indicates a layer of the DNN and the number in a block indicates the number of nodes in the corresponding layer.
feature layers were then connected to the input layer of the fusion layers. Each feature layers con-sisted of an input layer, the first and second FC hidden layers, the third DO hidden layer, and an output layer, where the FC layers contained 64 and 256 nodes for RawLSA2000/LDA10 and i-vector,
respectively, with an exponential linear unit (ELU) activation function. And, the fusion layers con-sisted of an input layer, the first max-pooling hid-den layer, the second and fourth DO hidhid-den lay-ers, the third FC hidden layer, and an output layer, where the FC layer contained 256 nodes with a tanh activation function.
Feature Feature Norm. Accuracy
dim. method
Official baseline with transcription 0.5200
Official baseline with i-vector 0.7400
Official baseline with transcription & i-vector 0.7573 Early or Late fusion: vanilla DNN based ensemble classifier
(a)SV Mcount
output 66 LDA 0.4545
(b)SV MoutputLSA2000/LDA10 66 LDA 0.5827 (c)DNNLSA2000/LDA10
output 66 LDA 0.5782
(d)DNNbottleneckLSA2000/LDA10 192 LDA 0.5764
(e)RawLSA2000/LDA10 60 LDA 0.5836
(f) i-vector 800 LDA 0.8082
(a)+(f) late fusion 866 LDA 0.5118
(b)+(f) late fusion 866 LDA 0.8245
(c)+(f) late fusion 866 LDA 0.6682
(d)+(f) early fusion 992 LDA 0.7345
(e)+(f) early fusion 860 LDA 0.8309
(b)+(c)+(f) late fusion 932 LDA 0.6627
(b)+(d)+(f) late fusion 1058 LDA 0.7127
(b)+(e)+(f) late fusion 926 LDA 0.8145
(c)+(d)+(f) late fusion 1058 LDA 0.6655
(c)+(e)+(f) late fusion 926 LDA 0.6609
(d)+(e)+(f) early fusion 1052 LDA 0.7155
(b)+(c)+(d)+(f) late fusion 1124 LDA 0.6673
(b)+(c)+(e)+(f) late fusion 992 LDA 0.6627
(b)+(d)+(e)+(f) late fusion 1118 LDA 0.7155
(c)+(d)+(e)+(f) late fusion 1118 LDA 0.6609
(b)+(c)+(d)+(e)+(f) late fusion 1184 LDA 0.6582 Early fusion: multi-column deep-stacking DNN based ensemble classifier
(a)+(f) 866 Mean/Var./LDA 0.8109
(b)+(f) 866 Mean/Var./LDA 0.8527
(c)+(f) 866 Mean/Var./LDA 0.8473
(d)+(f) 992 Mean/Var./LDA 0.8491
(e)+(f) 860 Mean/Var./LDA 0.8591
(d)+(e)+(f) 1052 Mean/Var./LDA 0.8455
[image:6.595.72.289.67.454.2](d)’+(e)+(f) (ETRI-SLP) 1052 Mean/Var./LDA 0.8545
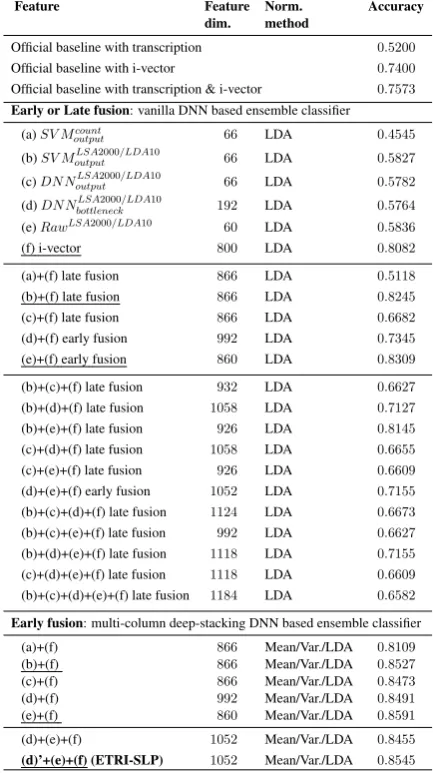
Table 3: Performance comparison of the proposed method for the speech track when evaluating the development data, where the underlined and the bolded represent the remark-able system and the submitted system, respectively. The ‘early fusion’ of the vanilla DNN based ensemble fier indicates a classifier that uses no feature-based classi-fier. And, ‘Mean/Var.’ indicates a normalization to a zero mean and unit variance. The (d)’ means the noisy data of the
DNNbottleneckLSA2000/LDA10, which was an unexpected data.
DNN based ensemble classifier. The vanilla DNN based ensemble classifier consisted of an input layer, the first, third, and fourth FC hidden layers, the second DO hidden layer, and an output layer, where each FC hidden layer contained 512 nodes with a rectified linear unit (RELU) activation func-tion. Also, it was noted that the number of nodes of the FC hidden layer was increased according to the increase of the dimension of the input feature data.
From the fourth row to the ninth row of Table 3, it was noted that the i-vector feature outper-formed the related features. Among the
text-related features, the LSA-LDA based features had better performances when compared to the count-based feature. From the tenth row to the fourteenth row of the table, the SV MoutputLSA2000/LDA10 and
RawLSA2000/LDA10 improved the only i-vector
feature when combining one text-related feature and the i-vector feature. However, it was shown from the fifteenth row to the twenty-fifth row of the table that the combination with two or more text-related features and the i-vector feature did not improve the combination with one text-related feature and the i-vector feature. It was summa-rized that there was no improvement on the combi-nation with two or more text-related features since the text-related features had similar information using the same unit forms.
From the twenty-sixth row to the thirtieth row of the table, all the combinations of one text-related feature and the i-vector feature were improved us-ing the multi-column deep-stackus-ing DNN based ensemble classifier when compared to the use of one feature; only two features were improved using the vanilla DNN based ensemble classi-fier. Moreover, the thirty-first row of the ta-ble showed that the performance of the combnation with the two text-related features and i-vector feature was slightly degraded; however, the degree of the performance degradation was marginal. Finally, the last row of the table pre-sented the performance of the submitted system. In fact, the original intention was to combine the two text-related features and i-vector feature. Un-fortunately, we found that the noisy data was in-serted as the DNNbottleneckLSA2000/LDA10after the sub-mission. However, from the performance eval-uation, we could examine that the multi-column deep-stacking DNN based ensemble classifier had the robust performance to a noisy data.
4.3 The experimental setup and its performances for the fusion track
For the L1 detection of the fusion track using the text of an essay response and the transcrip-tion text and i-vector feature of a speech re-sponse, we used the multi-column deep-stacking DNN based ensemble classifier. For the effi-cient combination with the text-related features and the speech i-vector feature, we empirically selected the RawLSA2000/LDA10 among
DO FC, 512tanh DO
FC, 512
tanh Lossout, 11softmax
Input, 860
Output, 11 FC, 512
tanh DO
FC, 512
tanh DO
(a) Late fusion: vanilla DNN based ensemble classifier
Feature-related layers
Fusion-related layers FC, 64
ELU Input, 60
Output, 11 𝑅𝑎𝑤$%&'(((/$*&+(, 60
Mean/Var. Norm.
Lossout, 11 softmax
DO P-norm, 96 Var-norm,96 FC, 196,tanh
Lossout, 11 softmax Input, 192
Output, 11 FC, 128
ELU Input, 800
Output, 11 i-vector, 800
LDA Norm.
Lossout, 11 softmax
FC, 196,
tanh DO FC, 196,tanh
[image:7.595.79.287.61.125.2](b) Early fusion: multi-column deep-stacking DNN based en-semble classifier
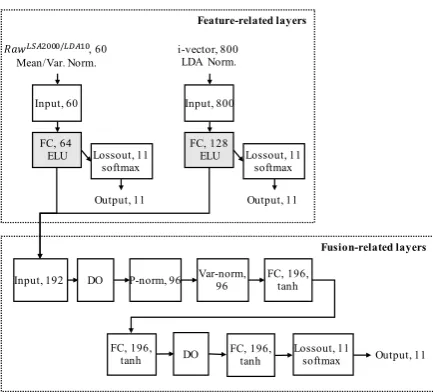
Figure 5: Configuration of the two DNN based ensemble classifiers for the fusion track, where each block indicates a layer of a DNN and the number in a block indicates the number of nodes in the layer corresponding to a block.
follows.
We first transformed each text of the essay and speech transcription into the six unit forms and then extracted the RawLSA2000/LDA10 for each unit-transformed text. To fuse an essay re-sponse and a speech rere-sponse, the count-based vector of the speech transcription text was ap-pended to the count-based vector of the essay text for each pair of an essay text and speech transcription text during the feature extraction of the RawLSA2000/LDA10. We also used the
800-dimensional i-vector feature of each speech re-sponse signal. The text-related features were then normalized to a zero mean and unit variance and the i-vector feature were normalized using a LDA normalization. As shown in Fig. 5(b), the
RawLSA2000/LDA10 and i-vector features were
fed into the LSA/LDA feature layers and the i-vector layers, respectively. The node values of the last hidden layer of each feature layers were then connected to the input layer of the fusion layers. Each feature layers consisted of an input layer, the FC hidden layer, and an output layer,
Feature Feature Normalization Accuracy
type dim. method
Official baseline 0.7836
Late fusion: vanilla DNN based ensemble classifier (a)SV Mcount
output 66 LDA 0.6309
(b)SV MoutputLSA2000/LDA10 66 LDA 0.8309 (c)DNNoutputLSA2000/LDA10 66 LDA 0.8518 (d)DNNbottleneckLSA2000/LDA10 192 LDA 0.8418
(e)RawLSA2000/LDA10 60 LDA 0.8291
(f) i-vectors 800 LDA 0.7900
(g)SV Mcount
output 66 Mean/Var. 0.8582
(h)SV MLSA2000/LDA10
output 66 Mean/Var. 0.8482
(i)DNNoutputLSA2000/LDA10 66 Mean/Var. 0.8400 (j)DNNbottleneckLSA2000/LDA10 192 Mean/Var. 0.8400
(k)RawLSA2000/LDA10 60 Mean/Var. 0.8473
(l) i-vectors 800 Mean/Var. 0.5864
(e)+(f) late fusion 860 LDA 0.9155
Early fusion: multi-column deep-stacking DNN based ensemble classifier
[image:7.595.75.292.146.342.2](e)+(f) (ETRI-SLP) 860 Mean/Var./LDA 0.9164
Table 4: Performance comparison of the proposed method for the fusion track when evaluating the development data, where the bolded represent the submitted system. ‘Mean/Var.’ indicates a normalization to a zero mean and unit variance.
where the FC layers contained 64 and 128 nodes forRawLSA2000/LDA10and i-vector, respectively,
with an ELU activation function. And, the fu-sion layers consisted of an input layer, the first and sixth DO hidden layers, the fourth, fifth, and sev-enth FC hidden layers, the second p-norm pool-ing hidden layer, the third variance normalization hidden layer, and an output layer, where each FC layer contained 196 nodes with a tanh activation function and the p-norm and variance normaliza-tion layers contained 96 nodes.
Prior to the performance evaluation of the pro-posed ETRI-SPL NLI for the fusion track, we evaluated the performance corresponding to the
RawLSA2000/LDA10, the i-vector feature, and the
It was shown from the second row to the seventh row of Table4that the LSA-LDA features had bet-ter performances than the count-based feature and i-vector feature when applying an LDA normaliza-tion. It was shown from the eighth row to the thir-teenth row of the table that the count-based feature and i-vector feature were well matched with a nor-malization to a zero mean and unit variance and with an LDA normalization, respectively. From the fourteenth and fifteenth rows of the table, the two DNN based ensemble classifiers obtained the similar accuracies when using the same feature combination. It was noted from the experiments that the multi-column deep-stacking DNN based ensemble classifier worked better than the vanilla DNN based ensemble classifier when the features were heterogeneous and the performance differ-ences were significant.
5 Performance of the test data set and discussions
This section first reports the official performance comparison based on the F1 (macro) score for the 1,100 test data set. Moreover, we present the of-ficial ranks that are grouped by a McNemar’s test. Thus, we regard that the a same group has a com-parable performance. After that, we conclude with our findings and discussions.
Table 5 and Fig. 6 present the performance comparisons and the confusion matrices of the submitted ETRI-SPL NLI systems for the essay track, the speech track, and the fusion track, re-spectively. For the essay track, the F1 (macro) scores are 0.7104, 0.8601, and 0.8818, for the baseline system, the ETRI-SPL system, and the ItaliaNLP (top-scored) system. In other words, the proposed system has the improved performance when compared to the baseline system; however, the proposed system has a slightly lower perfor-mance when compared to the top-scored system. For the speech track, the F1 (macro) scores are 0.7980, 0.8664, and 0.8755, for the baseline sys-tem, the ETRI-SPL syssys-tem, and the UnibucKernel (top-scored) system. That is, the proposed system has the comparable performance to the top-scored system. For the fusion track, the F1 (macro) scores are 0.7901, 0.9220, and 0.9319, for the baseline system, the ETRI-SPL system, and the UnibucK-ernel (top-scored) system. That is, the proposed system also has the comparable performance to the top-scored system.
Track Team Rank F1 (macro) Accuracy
group
Essay BaselineETRI-SLP 2- 00..71048601 00..71098600
ItaliaNLP (Top-scored) 1 0.8818 0.8818
Speech BaselineETRI-SLP 1- 00..79808664 00..79828664
UnibucKernel (Top-scored) 1 0.8755 0.8755
Fusion BaselineETRI-SLP 1- 00..79019220 00..79099218
[image:8.595.307.527.64.172.2]UnibucKernel (Top-scored) 1 0.9319 0.9318
Table 5: Performance comparison based on the F1 and ac-curacy metrics of the proposed method for the essay, speech, and fusion tracks when evaluating the test data set. The first, second, third rows of each track indicate the official baseline system, the proposed system, and the top-scored system, re-spectively.
CHI JPN KOR HIN TEL FRE ITA SPA GER ARA TUR Predicted label CHI JPN KOR HIN TEL FRE ITA SPA GER ARA TUR True label
93 2 1 2 1 1
4 92 2 1 1
3 10 83 2 1 1
1 81 17 1
1 16 81 1 1
1 1 1 87 4 2 1 2 1 5 86 5 2 1 1 2 1 1 3 5 83 3 2 1 1 2 1 92 1 2 2 2 1 4 3 1 85 2 1 2 2 2 3 3 3 1 83
Confusion Matrix 0.0 0.1 0.2 0.3 0.4 0.5 0.6 0.7 0.8 0.9
(a) Essay track
CHI JPN KOR HIN TEL FRE ITA SPA GER ARA TUR Predicted label CHI JPN KOR HIN TEL FRE ITA SPA GER ARA TUR True label
93 2 3 1 1
2 91 6 1
2 4 90 3 1
1 79 20
24 73 2 1
2 1 87 3 2 3 2
6 89 2 1 1 1
2 2 4 89 2 1
1 2 4 4 88 1
1 1 1 1 3 2 1 2 83 5 1 2 1 5 91
Confusion Matrix 0.0 0.1 0.2 0.3 0.4 0.5 0.6 0.7 0.8 0.9
(b) Speech track
CHI JPN KOR HIN TEL FRE ITA SPA GER ARA TUR Predicted label CHI JPN KOR HIN TEL FRE ITA SPA GER ARA TUR True label
98 1 1
1 98 1
1 7 90 1 1
82 18 17 82 1
94 3 1 1 1 3 94 2 1
2 1 3 94
3 97
1 3 2 2 90 2
1 1 1 2 95
Confusion Matrix 0.0 0.1 0.2 0.3 0.4 0.5 0.6 0.7 0.8 0.9
[image:8.595.344.486.254.694.2](c) Fusion track
In conclusion, we proposed the deep-learning based NLI using an LSA for the NLI Shared Task 2017. To this end, we extracted the LSA features using the six unit forms of character 4/5/6-grams and word 1/2/3-grams. Especially, we used 2,000-rank LSA features in order to capture the lan-guage information whereas the lower-rank LSA feature was used to the document topic-related applications. Next, the 2000-rank LSA feature was reduced into a 10-dimensional feature using LDA. It was noted from the NLI experiments that the LSA/LDA features performed well in the NLI Shared Task 2017 when compared to the count-based features, especially for the speech track.
For a fusion of the heterogeneous features such as the combination of a text-related feature and an i-vector feature, we designed two DNN based semble classifiers: (a) the vanilla DNN based en-semble classifier for late fusion and (b) the multi-column deep-stacking DNN based ensemble clas-sifier for early fusion. The vanilla DNN based ensemble classifier was a late fusion classifier that combined the independently trained feature-related classifiers whereas the multi-column deep-stacking DNN based ensemble classifier was an early fusion classifier that combined the features in one fusion network. It was shown from the NLI experiments that the two DNN based ensemble classifiers had the comparable performances when the feature type and the performance were similar to each other. On the other hand, the multi-column deep-stacking DNN based ensemble classifier had a better performance when the the feature type and the performance were significantly different.
It was shown from the experiments on the NLI Shared Task 2017 that the F1 (macro) scores were obtained as 0.8601, 0.8664, and 0.9220, for the essay track, the speech track, and the fusion track, respectively. The performances for the speech and fusion tracks were comparable to the top-ranked systems whereas the performance for the essay track had a second-ranked performance.
Our findings from the NLI Shared Task 2017 were summarized as follows:
1. Unit form for a text
We used the six unit forms of character 4/5/6-grams and word 1/2/3-4/5/6-grams. From the tenth row to the fourteenth row of Table3, it was noted that the combination of the multiple text-related features had no improvement be-cause the proposed text-related features were
originated from the same unit forms. There-fore, we expected that the performance for the essay track would be improved if the ad-ditional unit forms were adopted.
2. Feature type for a text: LSA-LDA feature
From the NLI experiments, it was no-ticed that the 2,000-rank LSA-LDA feature worked well for the NLI Shared Task 2017. Especially, LSA-LDA feature had a better performance than the count-based feature for the speech track. Moreover, the LSA-LDA feature worked well on both a normalization to a zero mean and unit variance and an LDA normalization whereas the count-based fea-ture worked on the only normalization to a zero mean and unit variance.
3. Normalization of an i-vector feature
It was observed from the experiments that the i-vector feature of a speech response signal worked well on an LDA normalization than a normalization to a zero mean and unit vari-ance.
4. DNN-based ensemble classifier
We attempted to use of a state-of-the-art deep learning method for the L1 classification by designing two DNN based ensemble classi-fiers: (a) the vanilla DNN based ensemble classifier for late fusion and (b) the multi-column deep-stacking DNN based ensemble classifier for early fusion. From the perfor-mance comparison of the other systems, it was seen that the proposed classifiers worked properly. Moreover, the multi-column deep-stacking DNN based ensemble classifier was better when the heterogeneous features had significant performance differences. In ad-dition, we expected that the more detailed experiments of the DNN configurations and the feature combinations would improve the performance, especially using a more large amount data (Cheng et al.,2015).
Acknowledgements
References
Jerome R Bellegarda. 2000. Exploiting latent semantic information in statistical language modeling. Proc. IEEE 88(8):1279–1296.
https://doi.org/10.1109/5.880084.
Jian Cheng, Xin Chen, and Angeliki Metalli-nou. 2015. Deep neural network acous-tic models for spoken assessment applica-tions. Speech Communication 73:14 – 27.
https://doi.org/10.1016/j.specom.2015.07.006. Euisok Chung and Jeon Gue Park. in review.
Sentence-chain based seq2seq model for corpus expansion. ETRI Journal.
Dan C. Ciresan, Ueli Meier, and J¨urgen Schmidhu-ber. 2012. Multi-column deep neural networks for image classification. CoRR abs/1202.2745.
http://arxiv.org/abs/1202.2745.
Frantiˇsek Gr´ezl, Martin Karafi´at, Stanislav Kont´ar, and Jan ˇCernock´y. 2007. Probabilistic and bottle-neck features for lvcsr of meetings. In Proc. IEEE International Conference on Acous-tics, Speech and Signal Processing (ICASSP 2007). IEEE Signal Processing Society, pages 757–760.
https://doi.org/10.1109/ICASSP.2007.367023.
HyungBae Jeon and Soo-Young Lee. 2016a. Initial-izing deep learning based on latent dirichlet alloca-tion for document classificaalloca-tion.Neural Information Processing. ICONIP 2016. Lecture Notes in Com-puter Science 9949. https://doi.org/10.1007/978-3-319-46675-0 70.
HyungBae Jeon and Soo-Young Lee. 2016b.Language model adaptation based on topic probability of latent dirichlet allocation. ETRI Journal 38(3):487–493.
https://doi.org/10.4218/etrij.16.0115.0499.
T. Joachims. 1999. Making large-scale SVM learning practical. In B. Sch¨olkopf, C. Burges, and A. Smola, editors,Advances in Kernel Methods - Support Vec-tor Learning, MIT Press, Cambridge, MA, chap-ter 11, pages 169–184.
Shervin Malmasi. 2016. Native Language Identifica-tion: Explorations and Applications. Ph.D. thesis.
http://hdl.handle.net/1959.14/1110919.
Shervin Malmasi and Mark Dras. 2015.
Multilingual Native Language Identifica-tion. In Natural Language Engineering.
https://doi.org/10.1017/S1351324915000406. Shervin Malmasi, Keelan Evanini, Aoife Cahill, Joel
Tetreault, Robert Pugh, Christopher Hamill, Diane Napolitano, and Yao Qian. 2017. A Report on the 2017 Native Language Identification Shared Task. In Proceedings of the 12th Workshop on Building Educational Applications Using NLP. Association for Computational Linguistics, Copenhagen, Den-mark.
Shervin Malmasi, Marcos Zampieri, Nikola Ljubeˇsi´c, Preslav Nakov, Ahmed Ali, and J¨org Tiedemann. 2016. Discriminating between Similar Languages and Arabic Dialect Identification: A Report on the Third DSL Shared Task. InProceedings of the Var-Dial Workshop. Osaka, Japan.
Bj¨orn Schuller, Stefan Steidl, Anton Batliner, Ju-lia Hirschberg, Judee K. Burgoon, Alice Baird, Aaron Elkins, Yue Zhang, Eduardo Coutinho, and Keelan Evanini. 2016. The INTER-SPEECH 2016 Computational Paralinguistics Challenge: Deception, Sincerity & Native Lan-guage. In Interspeech 2016. pages 2001–2005.
https://doi.org/10.21437/Interspeech.2016-129. C. G. M. Snoek, M. Worring, and A. W. M.
Smeulders. 2005. Early versus late fusion in semantic video analysis. In ACM Interna-tional Conference on Multimedia. pages 399?–402.
https://doi.org/10.1145/1101149.1101236.
Joel Tetreault, Daniel Blanchard, and Aoife Cahill. 2013. A Report on the First Native Language Iden-tification Shared Task. InProceedings of the Eighth Workshop on Building Educational Applications Us-ing NLP. Association for Computational Linguis-tics, Atlanta, GA, USA.