Predictive power of word surprisal for reading times is a linear function of
language model quality
Adam Goodkind and Klinton Bicknell
Department of Linguistics Northwestern University
Evanston, IL 60208
[email protected] [email protected]
Abstract
Within human sentence processing, it is known that there are large effects of a word’s probability in context on how long it takes to read it. This relationship has been quantified using information-theoretic surprisal, or the amount of new information conveyed by a word. Here, we compare surprisals derived from a col-lection of language models derived from n-grams, neural networks, and a combi-nation of both. We show that the mod-els’ psychological predictive power im-proves as a tight linear function of lan-guage model linguistic quality. We also show that the size of the effect of surprisal is estimated consistently across all types of language models. These findings point toward surprising robustness of surprisal estimates and suggest that surprisal esti-mated by low-quality language models are not biased.
1 Introduction
Decades of work studying human sentence pro-cessing have demonstrated that a word’s proba-bility in context is strongly related to the amount of time it takes to read it. This relationship has been quantified by surprisal theory (Hale, 2001;
Levy, 2008), which states that processing diffi-culty of a word w in context c is proportional to its information-theoretic surprisal, defined as
−logp(w|c). As a word is more likely to occur in its context, and thus communicates less infor-mation (Shannon,1948), it is read more quickly.
One difficulty in testing such effects of a word’s probability in context is the need to construct esti-mates of a word’s probability in context. One way of estimating such probabilities is to give human subjects a context, have them guess the next word,
and estimate p(w|c) as the proportion of partici-pants who guess wordwin contextc. This method, called a Cloze task (Taylor,1953), may yield reli-able estimates for words that have relatively high probabilities in their context, and it has been used in a number of studies of the effects of probabili-ties in context on reading. However, it is an open question whether these human guess-derived pro-portions may be biased from objective probabili-ties in some way (Smith & Levy,2011). Problem-atically for studying surprisal specifically, how-ever, the Cloze task cannot in principle yield reli-able estimates of word probabilities in context that are relatively low, say less than 1 in 100, as many word probabilities are, without requiring an ex-tremely large number of participants (Levy,2008). Additionally, it is not practical to use the Cloze task to estimate probabilities for large datasets on which surprisal is often studied, for which there can easily be tens of thousands of contexts that would require estimation.
The alternative is to estimate the probabilities of words in context using computationallanguage models, which are trained on large language cor-pora to estimate the probabilities of words in con-text. Many studies of surprisal have used such lan-guage models (e.g.Hale,2001;Levy,2008; Dem-berg & Keller,2008;Mitchell et al.,2010; Mon-salve et al.,2012).
Unfortunately, however, computational lan-guage models are still substantially worse than humans at predicting upcoming words, meaning there is some mismatch between the probabilities p(w|c) being estimated computationally and the implicit probabilities in the brains of readers that humans are using. This situation raises the ques-tion of to what extent we can trust results about the effects of surprisal as estimated by such language models. To try to get some information about pos-sible biases that might exist in our results based on language models being worse than humans at
predicting upcoming words, poor linguistic qual-ity, we can compare a range of computational lan-guage models of varying linguistic quality and see how the estimated effects of surprisal change. If there is a trend in results as the linguistic quality of the language models improves, that would pro-vide epro-vidence that such a trend may be even more present in language models with human-level lin-guistic quality.
Additionally, recent years have seen rapid progress in computational language modeling, en-abled by recent advances in neural networks. As a result, the linguistic quality of contemporary lan-guage models is far beyond what has been used in previous work studying surprisal. In this paper, we address both these concerns by analyzing how the predictive power of these surprisal estimates, theirpsychological quality, varies as a function of language model linguistic quality and type.
There has also been substantial interest in the
shapeof the effects of surprisal on reading times, because of theories that predict it to be linear (Levy, 2008; Smith & Levy, 2013; Bicknell & Levy, 2010). A secondary goal of this work is to investigate whether the shape of this effect de-pends on language model quality or type.
In particular, we compare surprisal estimates using a range of language models of varying linguistic qualities and types, from the n-gram models that have been used in most previous work on surprisal to state-of-the-art LSTM and interpolated-LSTM models. We assess the predic-tive ability and the size and shape of surprisals de-rived from each language model using generalized additive mixed-effects models (Wood,2017) fit to a corpus of eye movements in reading.
The plan for the remainder of this paper is as follows. Section 2introduces the set of language models we compare and establishes the linguis-tic quality of each. Then, in Section 3 we quan-tify the ability of surprisals derived from each lan-guage model to predict reading times and see the extent to which this changes with language model type and quality, assuming that effects of surprisal on reading times are linear. In Section4we do the same but allow surprisal to have non-linear effects, and we additionally use the non-linear models to assess whether there is evidence that the shape of the surprisal effect changes with language model type or quality. Finally, Section5concludes.
2 Language Models
2.1 Corpus
The corpus used for language model estimation was the Google One Billion Word Benchmark (Chelba et al., 2013), hereafter referred to as the “1b corpus”. The text data was obtained from news periodicals (similar to the Dundee corpus used for eye-tracking data below). The final corpus con-tained approximately 0.8 billion words with a vo-cabulary size of about 800,000.
Although the Dundee Corpus (Kennedy et al.,
2003) tokenized entire words with punctuation, our models were trained using separate punctua-tion as well separated possessives (e.g. Bill’s →
[Bill,’s]). Contractions were tokenized into their constituent full-form words, although contractions were counted as a single word when utilizing word count in e.g. perplexity calculations. These calcu-lations can be seen in Table1.
2.2 Model types
We compare seven language models of three types: four n-gram models, one LSTM, and two interpolations.
2.2.1 n-gram
The n-gram, count-based models were calculated usingkenlm(Heafield et al.,2013).kenlmuses Modified Kneser-Ney Smoothing, and is similar in functionality but significantly faster than SRILM (Stolcke et al., 2011). We calculated 5-grams, 4-grams, trigram, bigrams and unigrams. Unigram results were not included in the study, but rather used as a count of word frequency for controlling other models.
2.2.2 LSTM
Neural network-based language models were gen-erated from a Recurrent Neural Network (RNN) with Long-Short Term Memory (LSTM). Each word was encoded as a 50-dimensional one-hot vector, This vector was then fed into a sequence model with an LSTM of 50 hidden units. The model did not evaluate character-level sequences, but rather only word-level sequences. The prob-ability of the next word in the sequence was selected from the output layer of the sequence model.
2.2.3 Interpolation
models with the lowest perplexity on the Dundee Corpus used in this study (see Table 1). This was similar to the interpolation method utilized in Jozefowicz et al. (2016). Similar to Jozefow-icz et al.(2016), the present study also found op-timal weightings for combining an LSTM model with a smoothedn-gram model. Optimal weight-ing was operationalized as the blend weights that resulted in the lowest perplexity. Perplexity of the interpolated LSTM+5=gram model was opti-mal (lowest) when an interpolated model weighted the LSTM probabilities by0.71, with the 5-gram model weighted by 0.29. In addition to this op-timal model, a balanced interpolated model was also constructed using equal weighting of the LSTM and 5-gram probabilities.
2.3 Dundee corpus surprisals
The Dundee Corpus (see Section3for corpus de-tails) was tokenized at the word (rather than to-ken) level with leading, trailing and internal punc-tuation included, e.g.Bill’s,couldn’torexist!. Be-cause the 1b Corpus was tokenized, we were re-quired to break words made up of multiple to-kens into their constituent parts. The surprisal (log probability) for each token was matched to the 1b Corpus surprisals. In order to realign the tokens with the Dundee Corpus’s words, the log probabil-ities of each constituent token were added together to form a sum total log probability of the word.
Of the approximately 61,000 tokens in the Dundee Corpus, 175 were OOV in the 1b Corpus. These OOV words were removed from the final analysis. In adition, although the 1b Corpus used the sentence-final delimiter </s>, the Dundee Corpus did not. Therefore, while sentence-final delimiters were used in constructing the probabil-ities of the respective language models, they were also removed from the final analysis.
2.4 Perplexity
For each language model, the words’ surprisals (log probabilities) were summed and normalized by the word count. The exponent of the inverse of this sum was then calculated. A lower per-plexity is indicative of a more accurate language model. For example, a perplexity of 50 means that the model can guess 1 of 50 different op-tions for the model with equal probability. There-fore a lower perplexity means that there are fewer equally likely model options. The perplexity of the seven language models is laid out in Table1. The
Language Model (All Tokens)Perplexity (Excluding OOV)Perplexity
Interpolated-Optimal 73.39 73.41 Interpolated-Balanced 76.39 76.36
LSTM 113.27 113.59
5-gram 168.98 161.43
4-gram 172.24 164.56
3-gram 191.13 182.65
2-gram 290.88 278.36
Table 1: Perplexity of language models generated either as a LSTM, n-grams, or an interpolation of both the LSTM model as well as the 5-gram model. Perplexities were calculated for the entire Dundee corpus (60,916tokens) as well as for only the tokens in the 1b corpus (60,741tokens).
optimal interpolated model achieved the lowest perplexity, while the bigram model had the worst (highest) perplexity.
It should be noted that the perplexities of both the optimal interpolated model (73) and the LSTM model (113) are worse than the respective models reported in Jozefowicz et al. (2016) and Chelba et al. (2013). Whereas our best 5-gram model achieves a perplexity of 169 on the Dundee cor-pus,Jozefowicz et al. (2016) achieves a perplex-ity of 67 on thelm 1bbenchmark using a similar model. However, an important distinction is that the perplexities in Table1were calculated after all unknown words were excluded. On the other hand,
Chelba et al. (2013) used an <UNK> token for words that were OOV on the test portion of the 1b Corpus. This suggests a substantial mismatch be-tween the test benchmark corpus and the Dundee corpus, even though both corpora are sourced from news media. Nonetheless, both perplexity figures could be considered strong, low perplexities.
3 Linear effects of surprisal
In this section we investigate the ability of sur-prisals derived from each of these seven language models described above to predict reading times in a large corpus of eye movements in reading.
3.1 Methods
3.1.1 Eye movement in reading data
read-ing newspaper editorials inThe Independent. For this paper specifically, we predict gaze durations for each word, defined to be the sum of all fixa-tions made on a word between the time the word is initially fixed and when the eyes first move off of the word. This measure is only calculated if the word is fixated by that reader prior to any fixation on a later word (i.e., during ‘first pass’ reading). If the word was not fixated during first pass read-ing, this is missing data. We used a total of about 436,000 valid gaze durations in the English por-tion of the Dundee corpus. After performing the exclusions listed below, we were left with a total of 289,726 gaze durations and a vocabulary size of 37,420 word types.
In line with previous studies of gaze durations in the Dundee corpus (e.g.Smith & Levy,2013), we excluded:
• Words preceding punctuation
• Words with non-alphabetical characters
• Words that were presented to participants at
the beginning or end of a line of text
• Words that were outside the vocabulary of the
1b corpus (and thus the language models) Because our statistical model of the gaze duration of each word also included effects of the surprisal of the preceding word, we also excluded:
• Words following punctuation
• Words that followed words with
non-alphabetic characters
• Words that followed words that were outside
the vocabulary of the 1b corpus (and thus the language models)
3.1.2 Statistical models
Similar toSmith & Levy(2013), we used general-ized additive mixed-effects models (GAMMs) to predict reading times with themgcv(Wood,2004) package in R (R Core Team,2013). We estimated seven GAMMs, one for each language model. Each GAMM modeled gaze duration on a word as a function of two linear surprisal terms: one for the surprisal of the current word and one for the sur-prisal of the previous word. Each GAMM also in-cluded random intercepts for each of the 10 read-ers and a range of linear and non-linear covariates not of direct interest for the present work, identical to those included bySmith & Levy(2013). These covariates were:
• a tensor product interaction between ortho-graphic word length and log-frequency (un-igram log probability estimated from the 1b corpus) of the current word
• a tensor product interaction between ortho-graphic word length and log-frequency of the previous word
• a spline effect of word number within the text
• a binary variable of whether or not the
previ-ous word had received a fixation
3.1.3 Analysis
We compare the predictive power of different lan-guage models for reading times by comparing the log likelihoods across GAMMs that include sur-prisals derived from different language models.1
To enable comparison of log likelihoods across models, we change two aspects of mgcv’s default GAMM fitting procedure: we use maximum like-lihood fitting instead of REML and we use splines with fixed degrees of freedom instead of penalized splines. We set the fixed degrees of freedom for each covariate to be a bit above the estimated de-grees of freedom from a GAMM estimated in the default way (which was relatively constant across models).
To measure the added predictive power of the two linear surprisal terms in each model, we sub-tract the models’ log likelihood from a model that only includes the covariates, yielding a mea-sure we denote ∆LogLik. (Note that because these models are in a subset relationship -2 times ∆LogLik is a Chi-square distributed deviance as in a likelihood ratio test.)
To assess the extent to which this measure of predictive power is related to the language model’s linguistic quality, we correlate this∆LogLik met-ric with perplexity. Additionally, since these mod-els with linear effects of surprisal also estimate the coefficient of surprisal for predicting reading times – both for the current word’s surprisal and the prior word’s – we also assess the correlation between these coefficients and the model’s perplexity. To the extent to which there are systematic relation-ships between these coefficients and the language model’s linguistic quality, it may suggest that poor
1Technically, these models include log
10 probabilities,
Figure 1: Improvements in log likelihood for lin-ear models, charted against decreases in perplex-ity. Distance from the central trend line is indica-tive of larger departures in log likelihood as a func-tion of perplexity. The blue line represents a linear best fit, with a coefficient of−1.66andR2 = 0.94
quality language models cannot be trusted to ac-curately estimate the size of the effect of surprisal on reading times.
3.2 Results and discussion
3.2.1 Log Likelihood
As shown in Figure1and Table2, there is a mono-tonic effect of language model quality on predic-tive power. Better language models (lower per-plexity) yield surprisal values that better predict reading times, as seen by increased∆LogLik. In-deed, Figure1shows a strikingly strong relation-ship between a language model’s linguistic qual-ity (measured by perplexqual-ity) and the abilqual-ity of sur-prisal values derived from that model to predict reading times (measured by∆LogLik). These two values have anR2of 0.94.
However, there is one relatively clear depar-ture from this tight linear relationship. Namely, the large decrease in the perplexity going from the 5-gram model to the LSTM is not reflected in a large jump in∆LogLik. Put another way, although there is a clear systematic relationship between language model linguistic quality and ∆LogLik, there is also some evidence for effects of language modeltype, such that the LSTM is less useful for predicting reading times than would be expected given its perplexity.
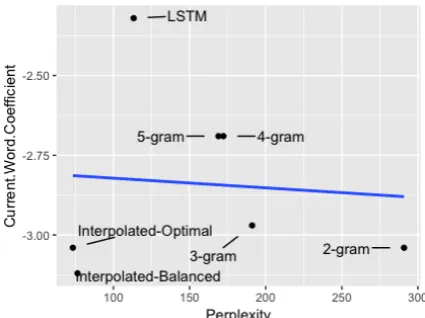
Figure 2: Changes in the current word’s coefficient for linear models, charted against increases in per-plexity. Distances from the central trend line are indicative of larger departures of the current word coefficient from the expected trend. Regardless of perplexity, the coefficient is stable. The blue line represents a linear best fit, with a coefficient of
−2.79andR2 = 0.007.
3.2.2 Current Word
The effects of two words’ surprisal was incorpo-rated into the GAMs: the surprisal of the current word and the surprisal of the previous word. De-spite the different models’ very different perplex-ities, the size of the effects of surprisal were es-timated very stably across language models. As seen in Figure 2, all models had surprisal coef-ficients around 3 (although the LSTM model is again somewhat of a low outlier). There is no clear relationship between the coefficients for the sur-prisal of the current word and language model quality, with both the best model (optimal inter-polation) and the worst model (bigrams) having a value of 3.04.
3.2.3 Previous Word
Similar to the results above for the current word, the previous word’s surprisal also had an inconsis-tent effect across models. In other words, the coef-ficient for the previous word’s surprisal (see Table
2) bore no clear relationship with relative improve-ments in language model perplexity.
4 Non-linear effects of surprisal
[image:5.595.310.523.64.223.2]sur-Language Model ∆LogLik Current Word Coefficient
Previous Word Coefficient Interpolated-Optimal 284 -3.04 -4.57 Interpolated-Balanced 280 -3.12 -4.68
LSTM 231 -2.32 -2.56
5-gram 228 -2.69 -3.82
4-gram 224 -2.69 -3.81
3-gram 218 -2.97 -3.92
[image:6.595.308.527.268.413.2]2-gram 151 -3.04 -3.98
[image:6.595.76.289.268.428.2]Table 2: As the perplexity of a language model increases, its improvement over baseline log likelihood (∆LogLik) decreases. The coefficients for both the current and previous words do not bear a consistent relationship with model perplexity.
Figure 3: Regression plot of coefficients on the previous word. The blue line represents a linear best fit, with a coefficient of0.001andR2 = 0.03.
prisal. These models also let us ask whether the
shapeof the estimated effect of surprisal on read-ing times varies with language model quality.
4.1 Methodology
The primary methodology was identical to that from the previous analysis, except that instead of including linear effects of current and previous word surprisal in the GAMMs, we included cubic splines (40 d.f.) of current and previous word sur-prisal. For this non-linear model, since there are not coefficients of current and previous word sur-prisal, we also investigate the F statistic associated with the strength of each surprisal term predictor.
Additionally, to analyze whether the shape of the surprisal effect differs across conditions, we fit additional GAMMs that had the same struc-ture but were estimated in mgcv’s usual way (i.e., with splines penalized and REML). These
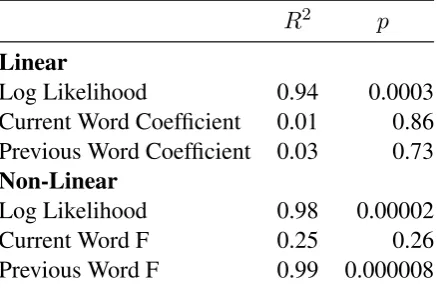
addi-R2 p
Linear
Log Likelihood 0.94 0.0003
Current Word Coefficient 0.01 0.86 Previous Word Coefficient 0.03 0.73
Non-Linear
Log Likelihood 0.98 0.00002
Current Word F 0.25 0.26
Previous Word F 0.99 0.000008
Table 3: Correlation results for metrics of predic-tors of linear and non-linear GAMMs
tional models were only used for visualization.
4.2 Results and discussion
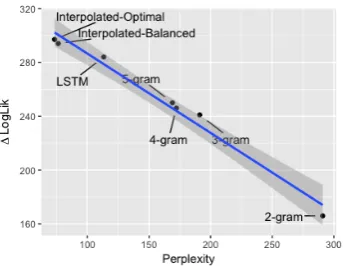
When allowing for non-linear effects of surprisal, the relationship between linguistic quality and pre-dictive power for reading times becomes even more clear. The relationship between ∆LogLik and perplexity becomes even stronger (Figure4), with an R2 of 0.98. Further, as seen in Table 4, while the F statistic for the current word surprisal is inconsistent as model perplexity improves (sim-ilar to the coefficients of surprisal in the linear models), the F statistic of the previous word is tightly related to perplexity. As perplexity of a model improves, the F statistic of the previous word improves in lockstep. This suggests that at least in the non-linear models, many of the im-provements in predictive ability may come specif-ically from effects of prior word surprisal.
As can be seen in the GAM plots in Figures5
Figure 4: Improvements in log likelihood for non-linear models, charted against decreases in per-plexity. The blue line is a linear best fit line with a coefficient of -1.66,R2 = 0.98.
Figure 5: GAM plots on current word using nor-mal estimation
of surprisal as language model quality improves – all look roughly linear. If a trend in shape does ex-ist, the highest quality models (interpolation) ap-pear to have the most linear slopes. Additionally, the slope for surprisal of the prior word appears to flatten out for LSTMs for high surprisals.2
5 General Discussion
Taking all of the results together, we have shown evidence here for a strong effect of language model linguistic quality on the predictive power of surprisals estimated from that language model for reading times. This effect holds regardless of whether surprisal is modeled as a linear or non-linear effect. Despite this clear relationship with linguistic quality in terms of predictive power, we also saw remarkable consistency. Across language
[image:7.595.312.519.66.226.2]2This approach was followed rather than performing a sta-tistical model comparison testing for non-linearity because our GAMM models lacked by-word random slopes. Because the model lacks these parameters, we would expect the model to capture variance across word tokens in the corpus by bend-ing the curve away from linearity.
Figure 6: GAM plots on previous word using nor-mal estimation
models that varied by more than a factor of 4 in perplexity, the size of the effect of surprisal was estimated to be the similar and the shape of the ef-fect of surprisal was estimated to be roughly linear. These results suggest that we can put a reasonable amount of trust in results about surprisal estimated with computational language models, despite the state-of-the-art still being far from human quality. In addition, the way that the language models were composed seems to play a role in its fit to the data. The LSTM-based model does seem to be somewhat of a low-performing outlier. However, when the LSTM model is used with the 5-gram model in interpolation, these yield superior results. Therefore, although a purely LSTM-based model does not predict reading time as well as other models, it provides a good fit for the data. When used in conjunction with a count-based model, this combination provides more accurate predictions of the reading time data.
A number of studies have used the Dundee eye-tracking corpus in conjunction with a probabilistic language model.Demberg & Keller(2008), using less sophisticated linear models, found that sur-prisal is an accurate measure of processing com-plexity as measured by eye gaze duration. Ac-cording toDemberg & Keller(2008), greater word surprisal invokes higher “integration costs,” which accounts for prolonged gaze duration.
[image:7.595.97.267.279.404.2]Language Model ∆LogLik Current WordF Statistic Previous WordF Statistic
Interpolated-Optimal 297 21.13 63.8 Interpolated-Balanced 294 21.76 63.27
LSTM 284 17.58 55.16
5-gram 250 21.31 50.47
4-gram 246 21.18 50.13
3-gram 241 22.86 48.12
2-gram 166 15.6 34.94
Table 4: Log likelihood and F statistics for GAMMs with nonlinear smoothers on all covariates
reason, surprisal that accounts for the hierarchical structure of language has also been studied, to see if taking hierarchy into account can better predict eye gaze duration.Frank & Bod(2011) concludes that including hierarchy information does not bet-ter account for variance compared to a sequence-based model. According to their study, hierarchi-cal information does not noticeably affect the gen-eration of expectations of the following word.
Fossum & Levy(2012), on the other hand, make various modifications to the models used inFrank & Bod(2011), adding additional lexical informa-tion to the unlexicalized hierarchical models. Fos-sum & Levy(2012) concludes that hierarchical in-formation, when properly lexicalized, can improve sequence-only lexical models. Similarly,Mitchell et al.(2010) created a model that interpolates syn-tactic and distributional semantic information, and found that this improved the prediction of eye tracking durations.
As this bears on the present study, the LSTM model is able to detect word relationships that span arbitrary distances. While the LSTM model is not explicitly representing hierarchical informa-tion, the model does capture long distance infor-mation. Our results show that the LSTM model outperforms the purely n-gram models in terms of predictive capabilities. Thus, while we do not need to build hierarchical information explicitly into our model, the long-distance information does improve both linguistic and psychological accu-racy. This could point to the conclusion that eye gaze duration is also sensitive to, if not hierar-chical information, then information provided at a long distance from the current word.
In a similar vein to our results,Monsalve et al.
(2012) shows that perplexity of a language model (linguistic accuracy) bears a strong relationship to the log likelihood of a reading time model
(psy-chological accuracy). The key differences between this study and ours is thatMonsalve et al.(2012) analyzes self-paced reading data rather than eye-tracking, and that we use higher-performing state-of-the-art language models.
Finally, the present study can, in many respects, be viewed as a follow-up toSmith & Levy(2013). (Smith & Levy,2013) measured the shape of the surprisal curve, similar to our experiment in Sec-tion 4; however, the present study demonstrates that the the effect of surprisal is still linear even with much more (linguistically and psychologi-cally) accurate language models.
As many studies have noted (Monsalve et al.,
2012; Frank et al., 2013), a corpus such as the Dundee corpus, collected from newspapers, of-ten requires a great deal of global, extra-senof-tential context. Therefore, when processing a given sen-tence, the reader must also take into account in-formation provided many sentences prior, or even not provided in the document at all. This limitation could impact the results reported herein.
Despite possible limitations, the results above provide consistent evidence that improving the lin-guistic accuracy of language models will improve the models’ ability to make psychological predic-tions. This underscores the importance of under-standing language structure in order to better un-derstand cognitive processes such as eye gaze du-ration.
Acknowledgements
References
Bicknell, K., & Levy, R. (2010). A rational model of eye movement control in reading. In J. Ha-jivc, S. Carberry, S. Clark, & J. Nivre (Eds.), Pro-ceedings of the 48th annual meeting of the associ-ation for computassoci-ational linguistics (acl)(pp. 1168– 1178). Uppsala, Sweden: Association for Computa-tional Linguistics.
Chelba, C., Mikolov, T., Schuster, M., Ge, Q., Brants, T., Koehn, P., & Robinson, T. (2013). One billion word benchmark for measuring progress in statistical language modeling. arXiv preprint arXiv:1312.3005.
Demberg, V., & Keller, F. (2008). Data from eye-tracking corpora as evidence for theories of syntac-tic processing complexity. Cognition,109(2), 193– 210.
Fossum, V., & Levy, R. (2012). Sequential vs. hierar-chical syntactic models of human incremental sen-tence processing. InProceedings of the 3rd work-shop on cognitive modeling and computational lin-guistics(pp. 61–69).
Frank, S. L., & Bod, R. (2011). Insensitivity of the human sentence-processing system to hierarchical structure. Psychological science,22(6), 829–834. Frank, S. L., Monsalve, I. F., Thompson, R. L., &
Vigliocco, G. (2013). Reading time data for eval-uating broad-coverage models of english sentence processing. Behavior Research Methods, 45(4), 1182–1190.
Hale, J. (2001). A probabilistic Earley parser as a psy-cholinguistic model. In Proceedings of the second meeting of the north american chapter of the as-sociation for computational linguistics on language technologies(pp. 1–8).
Heafield, K., Pouzyrevsky, I., Clark, J. H., & Koehn, P. (2013, August). Scalable modi-fied Kneser-Ney language model estimation. In Proceedings of the 51st annual meeting of the association for computational linguistics (pp. 690–696). Sofia, Bulgaria. Retrieved
from https://kheafield.com/papers/
edinburgh/estimate paper.pdf
Jozefowicz, R., Vinyals, O., Schuster, M., Shazeer, N., & Wu, Y. (2016). Exploring the limits of language modeling. arXiv preprint arXiv:1602.02410. Kennedy, A., Hill, R., & Pynte, J. (2003). The dundee
corpus. InProceedings of the 12th european confer-ence on eye movement.
Levy, R. (2008). Expectation-based syntactic compre-hension. Cognition,106(3), 1126–1177.
Mitchell, J., Lapata, M., Demberg, V., & Keller, F. (2010). Syntactic and semantic factors in process-ing difficulty: An integrated measure. In Proceed-ings of the 48th annual meeting of the association for computational linguistics(pp. 196–206).
Monsalve, I. F., Frank, S. L., & Vigliocco, G. (2012). Lexical surprisal as a general predictor of reading time. InProceedings of the 13th conference of the european chapter of the association for computa-tional linguistics(pp. 398–408).
R Core Team. (2013). R: A language and environment for statistical computing [Computer software man-ual]. Vienna, Austria. Retrieved from http:// www.R-project.org/
Shannon, C. E. (1948). A mathematical the-ory of communication. Bell System Tech-nical Journal, 27(3), 379–423. Retrieved
from http://dx.doi.org/10.1002/
j.1538-7305.1948.tb01338.x doi:
10.1002/j.1538-7305.1948.tb01338.x
Smith, N., & Levy, R. (2011). Cloze but no cigar: The complex relationship between cloze, corpus, and subjective probabilities in language process-ing. InProceedings of the cognitive science society (Vol. 33).
Smith, N., & Levy, R. (2013). The effect of word pre-dictability on reading time is logarithmic. Cogni-tion,128(3), 302–319.
Stolcke, A., Zheng, J., Wang, W., & Abrash, V. (2011). Srilm at sixteen: Update and outlook. In Proceed-ings of ieee automatic speech recognition and un-derstanding workshop(Vol. 5).
Taylor, W. L. (1953). ” Cloze procedure”: a new tool for measuring readability.Journalism quarterly.
Wood, S. N. (2004). Stable and efficient multiple smoothing parameter estimation for generalized ad-ditive models. Journal of the American Statistical Association,99(467), 673-686.