Measuring Risk of Attack on Bus Networks
Claire French
Department of Civil Structural & Environmental Engineering Trinity College Dublin
Dublin 2 Ireland Tel: 353 1 8962084 Fax: 353 1 6773072
Email: margaret.omahony@tcd.ie
Margaret O’Mahony*
Centre for Transport and Innovation for People (TRIP) Department of Civil Structural & Environmental Engineering
Trinity College Dublin Dublin 2
Ireland Tel: 353 1 8962084 Fax: 353 1 6773072
Email: margaret.omahony@tcd.ie
* Corresponding author
Word count: 4868 + (10*250) = 7368
ABSTRACT
Public transport systems are at risk from attacks as they are open, dynamic systems carrying large numbers of people. Although attacks have been carried out on public transport since the 1920’s, the nature of attacks has changed in recent years and the objective of many terrorist attacks is to cause large number of casualties and create major disruptions on the network. The research examines the risk from such an attack on the bus network in Dublin.
As part of the research, a framework was developed which can be used to calculate risk using a number of factors which were chosen to take into account the attractiveness of the target, the overall threat and the level of disruption caused. The factors were grouped into static factors (factors that remain largely unchanged) and dynamic factors (factors which change due to further factors such as time). These factors were weighted using the Analytic Hierarchy Process (AHP). Eleven bus routes throughout Dublin were chosen and were analysed under five different scenarios.
BACKGROUND
For those determined to kill in quantity and willing to kill indiscriminately, public
transportation offers an ideal target (1). Attacks have been carried out on public
transport since the 1920’s but since the events of 9/11 the issue of security on public transport and the vulnerability of public transport systems to terrorist attacks is now much more at the forefront of the minds of the public. The aviation industry has introduced many measures to provide security including X-rays, screening and searching passengers. Introducing measures such as those used in aviation would not be practical on public transport systems in a lot of cases.
The most common form of attack on public transport is the bomb which
accounts for 60% of attacks (1). Although the recent attacks in Madrid (2004) and
London (2005) took place mainly on rail systems, 32% of terrorist attacks between 1920 and 2000 occurred on buses compared with 26% on rail systems. Although the
actual number of attacks has decreased, the lethality of them has increased (2). It is
shown that approximately two-thirds of the attacks had intent to kill as opposed to just cause disruption (1).
Unlike in aviation where there are lengthy security checks in place such as X-rays, metal detectors, passenger screening, explosive sniffers and searches, boarding and alighting from public transport is incredibly simple and attractive to potential
terrorists (1). In the US there are approximately 700 million boardings a year in
aviation compared to approximately 20 billion boardings of rail and bus systems (3).
A further complication is that the threat varies by location and also the time, and if
there is a particular ongoing political or social issue. Friedman and Mitchell (4)
showed that buses in particular are highly attractive targets as they are seen as a low risk, high-visibility and high impact targets. An attack on a bus has the potential to kill a large number of people and cause severe disruption. From a survey carried out among bus operators the results showed that the biggest perceived threat is a suicide bomber (3).
The public transportation system of London was subjected to a 25 year series
of terrorist attacks between 1973 and 1998 (5). Between 1991 and 1997 there were 41
attacks. There were also 6,569 telephone bomb threats and 9,430 suspicious devices
reported, none of which could be ignored and had to be dealt with (1). To eliminate
the potential of attacks a series of measures were put in place. Jenkins et al (1)
describe those included:
• Removal of lockers and litter bins to prevent concealment of a bomb;
• Installation of more than 3,500 CCTV camera’s to act as a deterrent and to
detect suspicious behaviour
• Improved lighting in poorly lit areas
• Increased police patrols of the stations
• Staff trained to look under seats during cleaning
• Public Information Campaign which asked the public to be alert and to report
anything suspicious
Although the above campaign did not completely eliminate attacks on the public transport system, it drove the terrorists away from the main stations in central London and out to more remote locations which reduced the potential disruption and number of casualties.
On March 11th 2004, the Spanish national rail system RENFE was targeted by
deaths and 1800 injuries. After the attack, existing security measures were intensified and new ones put in place. RENFE are currently looking into purchasing X-Ray machines, mobile scanners and using security dogs. The CCTV system was extended. However, unlike in London where litter bins were removed, they considered that sealing 150,000 bins and the problems that would then be caused for passengers was not appropriate.
On March 20th 1995, a chemical (sarin) was released on three commuter trains
in Tokyo. This terrorist attack was carried out by the Aum Shinrikyo cult. The sarin was in liquid form and placed into plastic bags (approx 900mm). These bags were wrapped in newspaper and placed on the floor of the train. Each terrorist was given two or three bags which they then pierced with umbrella tips at a specific station after which they then quickly escaped. The liquid evaporated quickly and started affecting the people in the immediate vicinity and also entered the air ventilation system. Five people were killed and approx 5,000 injured.
Following the attack, security measures were introduced. These included:
• Installation of 2,200 CCTV cameras
• A new patrol of security guards to watch for suspicious objects and
behaviour (prior to the attack there had been no security guards)
• Removal of litter bins
• Installation of windows that can be easily opened and closed
• Materials used in trains are now fire proof
• Not to use emergency ventilation that was designed for smoke as this
only spreads the chemical faster (although in some cases ventilation is still used)(1).
The three cities have been subjected to different forms of terrorist attacks – a continuing low casualty campaign (London), a high casualty suicide bomber attack (Madrid) and a chemical attack (Tokyo). All of these cities brought in improved security measures afterwards to try to minimise the risk of future attacks. For places that have never experienced any type of attack and are considered to be at low risk from such attacks, it can be difficult to determine what security measures to put in place.
Abkowitz (6) states that due to constraints such as money and time, it would
be impossible to fully secure public transport. Moriarty et al (7) presents
evacuation-specific simulation software packages providing detail on how each deals with
influencing factors of response to an emergency. Schwartz (8) studied a facility
location and resource allocation problem in the special context of emergency management. Using the evacuation lessons learned from Hurricanes Katrina and Rita
as a backdrop, Breekinridge et al (9) sought to emphasise the importance of sufficient
planning, preparation and skilled execution in successfully conducting mass evacuation.
Elmitiny et al (10) used VISSIM to evaluate the current plan and alternative
plans for the deployment of transit during an emergency situation in a transit facility such as a bus depot. They found that traffic rerouting could have potential reductions
in delay and evacuation clearance times. Leone and Rongfang (11) tackled the
challenge of designing a system for ferries that has acceptable detection probability and false alarm rates but that does not unduly inconvenience travellers.
Litman (12) found that, overall, traffic accidents represent a much greater risk
than terrorism but suggests that the risk of terrorism cannot be ignored. He notes that transit terrorism tends to instil more fear than other risks which are actually greater.
currently working to increase transport security. Shepherd et al (16) present results
which suggest that emergency transport operations can and should be improved.
Taylor et al (17) looked at additional policing, use of security technologies, public
information and outreach, and crime prevention through environmental strategies and how operators of US transit systems rate them in terms of protecting the system from terrorism. He found that the latter two policies were not particularly effective.
Rowshan et al (18) defines managing security risk as a process of identifying
the risk, reducing the risk that can be reduced and accepting the risk that is acceptable.
Xia et al (19) discuss risk assessment for a highway network. They defined the risk of
a highway network as a measure of: expected damage, the outcome of the event, expected casualties and loss of use. The five areas that have been identified in an anti-terrorism strategy for transport are: preparedness, prevention, protection, response and
recovery (ITS America (20)). In order to be prepared, the risk must be known. There
are many factors that contribute to the overall risk and Xia et al (19) group these into
static and dynamic factors, described below. The static factors are those which remain largely unchanged over a long period of time. The dynamic factors are concerned with things that can change such as flow, speed, vehicles and weather conditions.
As part of the research presented here, a framework was developed which can be used to calculate risk using a number of factors which were chosen to take into account the attractiveness of the target, the overall threat and the level of disruption caused. The factors were grouped into static factors (factors that remain largely unchanged) and dynamic factors (factors which change due to further factors such as time). These factors were weighted using the Analytic Hierarchy Process (AHP). Eleven bus routes throughout Dublin were chosen and were analysed under five different scenarios which examined the impact of time of the day and the year, different conditions and whether there is instability politically or socially or if the country is on high alert.
METHODOLOGY
The method used to develop a framework that can analyse the risk on a bus network is
based on a similar framework developed by Xia et al (19) for road networks. The risk
will be determined by a number of static and dynamic factors, the criteria used and how they were weighted. To obtain the weights, the Analytic Hierarchy Process
(AHP) (21) is used.
Risk Assessment Framework
The static factors remain largely unchanged over a long period of time and consider the attractiveness of the target and the loss of use. The dynamic factors are concerned with things that change. They consider the overall threat, the potential causalities and the expected damage.
Therefore, the total risk (R) is dependent on the contribution of static and dynamic factors, i.e.:
R = A + B (1)
Where A = ∑ static factors
B = ∑ dynamic factors and
R = Risk
Type of Bus (atb)
Importance of route (air) Possible Targets (apt)
The score for each factor is determined by its perceived contribution to the total score for the static factors. The factors therefore are weighted as some factors will make a bus route more attractive to attack and put the bus route at a greater risk. To incorporate the weights the following is used:
a
i= w
i.A
max.L/5
(2)where: w are the weights for each factor which will be determined using the AHP detailed below:
Amax is the maximum possible score for the static factors.
L is the risk level. Each individual factor has a separate set of criteria which determines its risk level. The risk level can range from 5 (highest risk) to 1 (lowest risk).
These factors and the criteria which determine the risk level are described below.
The dynamic factors which make up B are: Frequency (bf)
Volume (bv) Condition (bc) Stability (bs)
and
b
i= w
i.B
max.L/5
(3)where, as before,
w = weight
Bmax = Maximum Dynamic Factor Value L = Risk Level
These factors and their criteria are described in detail below.
Analytic Hierarchy Process (AHP)
There are a number of factors that will be used to determine the total risk. However, these factors are not weighted equally because their relevance to risk are not equal. To
determine the weights the AHP (21) is used. Saaty (21) describes it as a basic
approach to decision making. Pairwise comparisons of factors (two factors are compared at one time) are carried out and their relative importance to each other can be calculated. The advantage of using AHP is that when comparing factors either actual measurements or a scale which represents relative strengths can be used.
The elements are compared in pairs and a numerical value is assigned (21).
importance 9 and the values of 2, 4, 6 and 8 are intermediate values between the others above (this is a typical range used when adapting the AHP process).
The pairwise comparisons are reduced to a square matrix having the reciprocal property that aji = 1/aij, where i are the rows and j the columns. To find the relative strengths of the factors, the matrix needs to be solved. There are a number of ways of
doing this. Saaty (21) describes two methods which involve computing a set of
eigenvectors and for this research the following method has been used.
To calculate the weight of each element, each element is divided by the sum of the elements in that column. The average weight for each factor is then calculated as
shown below (21).
( )
⎟ ⎟ ⎟ ⎟ ⎟ ⎟ ⎠ ⎞ ⎜ ⎜ ⎜ ⎜ ⎜ ⎜ ⎝ ⎛ → ⎟⎟ ⎟ ⎟ ⎟ ⎟ ⎟ ⎟ ⎟ ⎟ ⎟ ⎟ ⎟ ⎟ ⎟ ⎠ ⎞ ⎜⎜ ⎜ ⎜ ⎜ ⎜ ⎜ ⎜ ⎜ ⎜ ⎜ ⎜ ⎜ ⎜ ⎜ ⎝ ⎛ 44 43 42 41 4 34 33 32 31 3 24 23 22 21 2 14 13 12 11 1 4 3 2 1 4 4 3 4 2 4 1 4 4 4 3 3 3 2 3 1 3 4 4 2 3 2 2 2 1 2 2 4 1 3 1 2 1 1 1 1 4 3 2 1 a a a a A a a a a A a a a a A a a a a A A A A A w w w w w w w w A w w w w w w w w A w w w w w w w w A w w w w w w w w A A A A A∑
= = 4 1 1 11 1 j j a a w [image:7.595.91.397.241.531.2]Determining the Weights
Static Dynamic
Static 1 ½
Dynamic 2 1
Values assigned when comparing factors
Calculated Weights
[image:8.595.222.371.71.127.2]Average Values
Table 1. Example of calculated weights and average values
It is assumed the static factors contribute to 33% of the risk and the dynamic factors to 67%.
As R =1000:
Amax = Static Factors = 330 Bmax = Dynamic Factors = 670
Determining the Individual Static factors
The same procedure is once again carried out, this time for the static factors. Table 2 shows the numerical values assigned, the calculated weights and the average weight of each factor.
Type of Bus Importance of Route Possible Targets
Type of Bus 1 1/5 1/7
Importance of Route 5 1 1/4
Possible Targets 7 4 1
Static Factors Pairwise Comparison Values
Type of Bus Importance of Route Possible Targets Average Type of Bus 0.0769 0.04 0.1625 0.072
Importance of Route 0.3846 0.1923 0.1794 0.252
[image:8.595.89.506.519.703.2]Possible Targets 0.5384 0.769 0.717 0.675 Calculated and Average Weights
Table 2. Pairwise comparison values, calculated and average weights for static factors
Static Dynamic Static 0.333333 0.33
Dynamic 0.666667 0.666667
Average Static 0.333333
Therefore, the type of bus is assumed to contribute 7.26 % to the total static risk (ATotal), the importance of the route 25.2% to the risk and the possible targets to 67.5%. The maximum total value (ATotal), of the static factors is 330. Using these weights, the maximum scores for each of the static factors can be calculated. They are 23.96 for atpmax, 83.2 for airmax and 222.68 for aptmax.
Determining the individual Dynamic Factors
Using the AHP procedure once more, Table 3 shows the values assigned when
carrying out pairwise comparisons of the dynamic factors, the calculated weights and the average value of each factor.
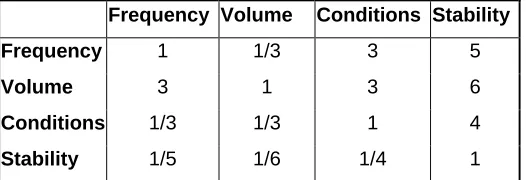
Frequency Volume Conditions Stability
Frequency 1 1/3 3 5
Volume 3 1 3 6
Conditions 1/3 1/3 1 4
Stability 1/5 1/6 1/4 1 Dynamic Factors Pairwise comparison values
Frequency Volume Conditions Stability Average
Frequency 0.22 0.18 0.41 0.31 0.28
Volume 0.66 0.54 0.41 0.38 0.5
Conditions 0.07 0.18 0.14 0.25 0.16
Stability 0.04 0.09 0.03 0.06 0.06
[image:9.595.168.431.231.321.2]Calculated and average weights
Table 3. Pairwise comparison values, calculated and average weights for dynamic factors
Therefore frequency will contribute 28%, volume 50%, conditions 16% and stability 6% to the total dynamic contribution to the risk. The maximum total value (BTotal) for the dynamic factors is 670. Using these weights, this then gives the maximum scores of the dynamic values. For frequency (Bfmax) the value is 189, for volume (Bvmax) it
is 333.7, for conditions (Bcmax) 107.7 and for stability (Bsmax) the value if 38.8.
Risk Level Criteria
Static Factors
For the bus type, the highest risk level (Level 5) is assigned to bus routes where more than 90% of the buses used on the route are double deck buses. The lowest level (Level 1) is assigned to the case where more than 90% of the buses are single deck. When 61-89% of buses are double decker, the risk level assigned is 4, when 41-60% are double decker, a value of 3 is used and when 10-39% are double decker a value of 2 is assigned.
For importance of route, the risk level is calculated on the basis of whether the bus service is the only public transport option on that corridor and on the basis of road type.
a. No alternative public transport nearby – Risk Level 1.5
b. Alternative public transport nearby – Risk level 1.0
2. Road Type
a. Primary Roads –Risk Level 3.5
b. Primary and Regional Roads – Risk Level 2.0
c. Regional Roads – Risk Level 1.0
To obtain the risk levels, maps were used. The route was traced out and it was noted if there was other public transport nearby and the types of roads used by the route was also noted. The summary for importance of route is presented in Table 4.
Factor Weight Max Score
Level Description
+
Level Description1.5 No alternative Public transport
3.5 Primary Roads
1 Alternative Public
Transport
2 Primary and
Regional Importance
of Route
25.2 83.193
1 Regional
[image:10.595.85.512.237.404.2]Roads Table 4. Importance of Route Summary
As well as causing casualties and disruption, certain buildings or institutions on a bus route could be targeted because of their associated meaning. These would include buildings of symbolic importance such as embassies or religious buildings, or outside or near venues where there could be large crowds.
The more potential targets that are passed by buses, the higher the risk. Correspondingly the maximum risk level (Level 5) is assigned to routes that pass by more than 8 potential targets. The lowest risk level (Level 1) is for routes that only pass 1 potential target and intermediate values are assigned to those in between.
Dynamic Factors
Similar methods are used for the dynamic factors. They account for things that do not remain the same and are influenced by external factors. As mentioned earlier, the dynamic factors considered are: Frequency of buses, passenger volume, conditions and stability of the country.
The frequency of buses is calculated as the number of buses per hour, based upon the published timetables from Dublin Bus. This factor is deemed to be an important factor as the more buses there are, the more potential for that route to be targeted for attack. The higher the frequency, the greater the risk. Risk level 5 is assigned to routes on which there are more than 10 buses per hour in one direction. Risk Level 1 is assigned when there are 2 or less buses using the route, and intermediate values are assigned in between.
The passenger volume is also crucial in determining the routes at risk. Jenkins
et al (1) identified that the large volume of passengers using the London Underground
made it particularly vulnerable. Friedman and Mitchell (4) also point out the
escape more easily. Routes that transport large number of people will be at the greatest risk. The passenger volume will be calculated as:
No. of buses per hour * Bus Capacity * Bus Occupancy factor
Risk Level 5 is assigned to situations where more than 900 passengers per hour are using a route; Risk Level 1 where there is less than 200 passengers per hour and intermediate levels are assigned in between.
Buses carry more passengers at certain times of the day and certain times of the year. The busiest times during the year are between September and June when the schools are open and there is an increase in the number of passengers. More people use the bus during the week than at the weekends. This can be seen from the number of buses that operate on a daily basis. Five random bus routes were chosen.
Three different time frames are considered and the total risk level is equal to the sum for the individual time frame.
1. Time of Year
a. Between September and June – Risk Level 1.5
b. Between July and August – Risk Level 1.0
2. Time of Week
a. Weekday – Risk Level 1.5
b. Saturday – Risk Level 1.0
c. Sunday – Risk Level 0.5
3. Time of Day
a. Rush Hour – 2.0
b. Off peak – 1.0
The stability of the country will influence the likelihood of a terrorist attack. This factor is the most subjective of all the factors and also the hardest to predict. The following are used:
A highly unstable environment where there are high tensions in Ireland and abroad and where the country is on high alert: 5.
A stable environment in Ireland but high tensions abroad, leading to demonstrations and unrest in Ireland because of it: 3.
A stable environment in both Ireland and abroad when there are no major incidents or discontentment taking place: 1.
Bus Routes
Map Reference Location Bus Route
1 Clontarf 130
2 Malahide 42
3 Swords 41
4 Finglas 40
5 Blanchardstown 39
6 Lucan 67
7 Clondalkin 51c
8 Tallaght 77
9 Rathfarnham 15a
10 Dun Loaghaire 46a
11 Bray 45
Fig 1. Bus routes
1
2 3
4
5
6
7
8
9 10
RESULTS
This section details the results obtained when eleven different bus routes were analysed under five different scenarios. The routes analysed were: 15a, 39, 40, 41, 42, 45, 46a, 67, 77, 51c and 130 and the scenarios are:
1. A weekday in September between 8 am and 9 am where there is a
relatively stable environment
2. A Saturday afternoon (3pm – 4pm) in July, with a relatively stable
environment
3. A weekday in November between 9 pm and 10 pm, when the country in
very unstable
4. Weekday afternoon in February, off-peak (2-3pm) in a stable environment
5. Weekday during rush hour in an unstable environment
The results display the scores obtained for each individual static and dynamic factor, the total static and total dynamic score, the total risk score for each route under each of the five scenarios and the largest contributing factor. Table 5 shows the results for Scenario 1.
Location Route ATotal BTotal RTotal Contributing Factor
Rathfarnham 15a 199.16 511.94 711.1 Volume
Blancherstown 39 126.7 407.41 534.1 Volume
Finglas 40 60.76 578.67 639.4 Volume
Swords 41 77.40 407.41 484.8 Volume
Malahide 42 52.44 407.41 459.8 Volume
Bray 45 235.38 474.14 709.5 Volume
Dun Laoghaire 46a 207.48 654.27 861.7 Volume
Clondalkin 51c 65.55 407.36 472.9 Volume
Lucan 67 82.19 407.41 489.6 Volume
Tallaght 77 162.94 511.94 674.8 Volume
[image:13.595.88.516.360.572.2]Clontarf 130 52.44 616.47 668.9 Volume
Table 5. Total Static, Dynamic and Risk Scores for Scenario 1.
The bus route most at risk is the 46a route with a score of just over 150 higher than the next highest route and almost twice the score of the lowest scoring route. For each route in this scenario, the volume was the biggest contributing factor.
Location Route ATotal BTotal RTotal Contributing Factor
Rathfarnham 15a 199.16 230.85 430.0 Possible Targets
Blancherstown 39 126.73 335.38 462.11 Volume
Finglas 40 60.76 297.58 358.3 Frequency
Swords 41 77.40 230.85 308.25 Frequency
Malahide 42 52.44 193.05 245.49 Volume
Bray 45 235.38 230.85 466.23 Possible Targets
Dun Laoghaire 46a 207.48 335.38 542.86 Possible Targets
Clondalkin 51c 65.55 192.45 258.00 Volume
Lucan 67 82.19 193.05 275.24 Volume
Tallaght 77 162.95 230.85 393.79 Frequency
[image:14.595.92.528.70.286.2]Clontarf 130 52.44 335.38 387.82 Volume
Table 6. Total Static, Dynamic and Risk Scores for Scenario 2.
For Scenario 2, the 46a route is once again the highest scoring route. However, the total risk score for each route is lower than the previous scenario suggesting that this situation does not provide as great a threat as the previous scenario. Although for some routes the volume is the biggest contributing factor, in this scenario for some other routes the frequency and possible targets provide the biggest contribution to the total risk score.
The results for Scenario 3 are presented in Table 7.
Location Route ATotal BTotal RTotal Contributing Factor
Rathfarnham 15a 199.16 268.31 467.47 Possible Targets
Blancherstown 39 126.72 268.31 395.04 Conditions
Finglas 40 60.76 268.31 329.07 Conditions
Swords 41 77.40 268.31 345.71 Conditions
Malahide 42 52.44 230.51 282.95 Conditions
Bray 45 235.38 230.51 465.89 Possible Targets
Dun Laoghaire 46a 207.48 372.84 580.32 Possible Targets
Clondalkin 51c 65.55 230.51 296.06 Conditions
Lucan 67 82.19 230.51 312.70 Conditions
Tallaght 77 162.94 268.31 431.26 Conditions
Clontarf 130 52.44 372.84 425.29 Frequency
Table 7. Total Static, Dynamic and Risk Scores for Scenario 3.
Once again, the 46a route obtains the highest risk score. These scores are slightly higher for each route than for the previous scenario. Unlike the previous two scenarios the volume is not the biggest contributing factor for any route. The conditions are the biggest contributing factor in the majority of the bus routes with possible targets and the frequency contributing the most for some bus routes. This highlights a particular feature of this scenario relating to the instability/ high alert status at that time.
[image:14.595.79.522.419.628.2]Location Route ATotal BTotal RTotal Contributing Factor
Rathfarnham 15a 199.16 252.39 451.56 Possible targets
Blancherstown 39 126.72 356.93 483.65 Volume
Finglas 40 60.76 319.13 379.89 Volume
Swords 41 77.40 252.39 329.79 Conditions
Malahide 42 52.44 252.39 304.84 Conditions
Bray 45 235.38 252.39 487.77 Possible targets
Dun Laoghaire 46a 207.48 461.46 668.94 Volume
Clondalkin 51c 65.55 213.99 279.55 Conditions
Lucan 67 82.19 252.39 334.59 Conditions
Tallaght 77 162.94 319.13 482.07 Volume
[image:15.595.92.528.98.314.2]Clontarf 130 52.44 356.93 409.37 Volume
Table 8. Total Static, Dynamic and Risk Scores for Scenario 4.
The 46a is again the highest scoring route. The scores are higher for each route than for Scenarios 2 and 3 but not as high as for the first scenario. There are a number of different contributing factors for the routes in this scenario including volume, conditions and possible targets.
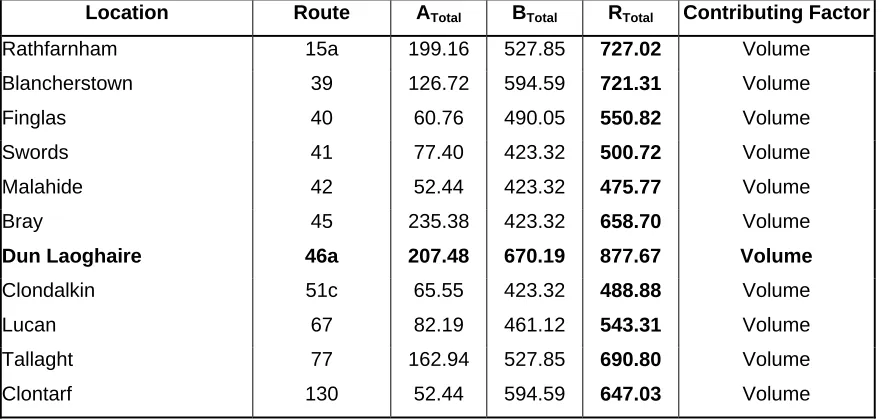
Finally the results for Scenario 5 are presented in Table 9.
Location Route ATotal BTotal RTotal Contributing Factor
Rathfarnham 15a 199.16 527.85 727.02 Volume
Blancherstown 39 126.72 594.59 721.31 Volume
Finglas 40 60.76 490.05 550.82 Volume
Swords 41 77.40 423.32 500.72 Volume
Malahide 42 52.44 423.32 475.77 Volume
Bray 45 235.38 423.32 658.70 Volume
Dun Laoghaire 46a 207.48 670.19 877.67 Volume
Clondalkin 51c 65.55 423.32 488.88 Volume
Lucan 67 82.19 461.12 543.31 Volume
Tallaght 77 162.94 527.85 690.80 Volume
Clontarf 130 52.44 594.59 647.03 Volume
Table 9.Total Static, Dynamic and Risk Scores for Scenario 5.
[image:15.595.89.530.438.648.2]Counter Measures
The devised framework has presented a risk score for a number of different routes under a number of different scenarios. Now that the risk is known, how to reduce this risk needs to be considered. As previously discussed, it is shown that the route most at risk is the 46a; the highest scoring scenario is scenario 5 and the biggest contributing factor is the volume.
These results confirm what was stated by Friedman and Mitchell (4) who
identified that the greater the potential number of casualties, the higher the risk. There will be a greater number of casualties when there is a large volume. For the two scenarios considered in the rush hour period, volume was the biggest contributing factor to the risk score for every route. However, this is one of the most difficult factors to counteract as it would mean having to reduce the number of buses or the size of the buses when it the most crucial time to have the necessary means to carry a large volume of passengers.
Instead, it may be easier to concentrate on the static factors which are not subject to change. If there was an unstable environment in the country it may be more effective to concentrate on the possible targets which is the biggest contributing factor in a number of cases. It could be possible to reroute a number of routes such as the 45 route which passes by six embassies. However, a balance needs to be found so that people do not panic and cease using public transport. In London, a high profile campaign warning people to be on the look out for anything suspicious proved to be very effective. However in Madrid, following the bombings, they decided against such a campaign as they did not want to discourage the use of public transport.
CONCLUSIONS
The objective for this project was to assess the security risk of bus networks. This was achieved by developing a framework which allowed a risk score for bus routes to be calculated. Eleven bus routes throughout Dublin were chosen and five scenarios were developed to take account for different times and situations. A number of static and dynamic factors were identified and they were weighted using the Analytic Hierarchy Process (AHP).
The main findings of this research are:
• The scenario that gives the highest risk score for all bus routes is scenario 5,
i.e. when it is rush hour and there is an unstable environment
• The biggest contributing factor to risk is the volume, particularly in the rush
hour scenarios where it is the biggest contributing factor for every route
• For off peak scenarios other factors such as possible targets, conditions and
frequency are the critical factors
• The risk varies depending on time, location and the perceived threat
In terms of mitigating the risks, the routes that pass a number of targets are known and so if the country was unstable, the routes could be changed to reduce the risk. An important measure that could be introduced to reduce the risk and avoid attacks is training programmes. This would make drivers aware of the times when the risk is greatest, what signs to look out for and what to do if they noticed anything suspicious.
REFERENCES
1. Jenkins, B.M. and Gersten, L.N. (2001). Protecting Public Surface
Transportation Against Terrorism and Serious Crime: Continuing Research on Best Security Practices. Mineta Transportation Institute, MTI Report 01-07
2. Fink, C.N.Y. (2002). Anti-Terrorism Security and Surface Transportation
Systems: A review of Case Studies and Current Tactics. Transportation
Research Board 2003 Annual Meeting, Washington D.C.
3. Mineta Transporation Institute (2006) Third National Transportation Security
Summit: Rail Security – A Symposium on Terrorism and Business Continuity
American Public Transportation Association (APTA) Annual Meeting,
September 29th 2005, Dallas,Texas.
4. Friedman, D.M. and Mitchell, C (2003). Security Measures in the
Commercial Trucking and Bus Industries. Transportation Research Board
5. Taylor,B., Loukaitou-Sideris, A., Liggett, R., Fink,C., Wachs, M., Cavanagh,
E., Cherry, C., Haas, P.J. (2005). Designing and Operating Safe and Secure
Transit Systems: Assessing Current Practices in the United States and Abroad.
Mineta Transportation Institute, MTI Report 04-05
6. Abkowitz, M.D (2002). Transportation Risk Management: A New Paradigm.
Transportation Research Board 2003 Annual Meeting.
7. Moriarty, K., Daiheng, N. and Colura, J. (2007). Modelling Traffic Flow
under Emergency Evacuation Situations: Current Practice and Future Directions. Transportation Research Board 2007 Annual Meeting.
Washington D.C. January.
8. Schwartz, M. (2007). Planning for the Worst: Evaluating Evaluation Criteria
for Emergency Preparedness Plans. Transportation Research Board 2007
Annual Meeting. Washington D.C. January.
9. Breckinridge, W.L., Najafi, F.T., Rouleau, M., Ekberg, J. and
Mamaghanizadeh, E. (2007). A Summary Review on the Importance of
Transportation Planning, Preparation and Execution during a Mass Evacuation. Transportation Research Board 2007 Annual Meeting.
Washington D.C. January.
10.Elmitiny, N., Ramasamy, S. and Radwan, E. (2007). Transit Facilities’
Emergency Evacuation Planning and Preparedness using Traffic Simulation.
Transportation Research Board 2007 Annual Meeting. Washington D.C. January.
11.Leone, K. and Rongfang, L. (2006). An Analysis of Security System Designs
for Ferry Transportation. Transportation Research Board 2006 Annual
Meeting, Washington.D.C. January.
12.Litman, T. (2006). Terrorism, Transit and Public Safety. Transportation
Research Board 2006 Annual meeting. Washington D.C. January.
13.FTA (2005). Transit Security Website. Federal Transit Administration.
(http://transit-safety.volpe.dot.gov/Security/Default.asp)
14.National Transportation Security Centre. Mineta Transportation Institute.
(http://transweb.sjsu.edu/transitsecurity.htm)
15. Transportation System Security Website.
(www.4.trb.org/trb/homepage.nsf/web/security) Transportation Research
16.Shepherd, K.E., Baird, M.E., Abkowitz, M. and Wegmann, F. (2006). Transportation and Emergency Services; Identifying Cultural Interfaces, Obstacles and Opportunities. Transportation Research Board 2006 Annual
Meeting. Washington D.C. January.
17.Taylor, B.D., Liggett, R. and Fink, C.N.Y. (2006). Transit Security in the Post
9/11 Era: A Survey of US Transit Operators. Transportation Research Board
2006 Annual Meeting. Washington D.C. January.
18.Rowsahn, S., Sauntry, W.C., Wood, T.M., Chuchill, B., Levine, S.R. (2005).
Reducing Security Risk for Transportation Management Centres.
Transportation Research Board 2005 Annual Meeting. Washington D.C.
19.Xia, J., Chen, M,. and Liu,R. (2004) A Framework for Risk Assessment of
Highway Network. Transportation Research Board 2005 Annual Meeting.
Washington D.C.
20.Intelligent Transportation Society of America (2002). ITS America.
Homeland Security and ITS: Using Intelligent Transportation Systmes to Improve and Support Homeland Security, Washington D.C.
21.Saaty, T.L., Vargas, L.G. (2001) Models, Methods, Concepts & Applications
of the Analytic Hierarchy Process. Boston
22.Schmoldt, D.L. (2001) The Analytic Hierarchy Process in Natural Resource