warwick.ac.uk/lib-publications
Manuscript version: Author’s Accepted Manuscript
The version presented in WRAP is the author’s accepted manuscript and may differ from the
published version or Version of Record.
Persistent WRAP URL:
http://wrap.warwick.ac.uk/106537
How to cite:
Please refer to published version for the most recent bibliographic citation information.
If a published version is known of, the repository item page linked to above, will contain
details on accessing it.
Copyright and reuse:
The Warwick Research Archive Portal (WRAP) makes this work by researchers of the
University of Warwick available open access under the following conditions.
Copyright © and all moral rights to the version of the paper presented here belong to the
individual author(s) and/or other copyright owners. To the extent reasonable and
practicable the material made available in WRAP has been checked for eligibility before
being made available.
Copies of full items can be used for personal research or study, educational, or not-for-profit
purposes without prior permission or charge. Provided that the authors, title and full
bibliographic details are credited, a hyperlink and/or URL is given for the original metadata
page and the content is not changed in any way.
Publisher’s statement:
Please refer to the repository item page, publisher’s statement section, for further
information.
Recurrent Neural Networks
Mihaela Porumb1 [0000-0001-9983-0204], Rossana Castaldo1 [0000-0003-4143-1678] and Leandro
Pecchia1 [0000-0002-7900-5415]1
1 University of Warwick, Coventry, CV4 7AL, United Kingdom
{m.porumb,r.castaldo,[email protected]}
Abstract. Heart rate variability (HRV) analysis has increasingly become a prom-ising marker for the assessment of the autonomic nervous system. The easy der-ivation of the HRV has determined its popularity, being successfully used in many research and clinical studies. However, the conventional HRV analysis is performed on 5 minutes ECG recordings which in e-health monitoring might be unsuitable, due to real-time requirements. Thus, the aim of this study is to evalu-ate the association between the raw ECG heartbeats and the HRV features to fur-ther reduce the number of heart beats required for the HRV estimation enabling real time monitoring. We propose a deep learning based system, specifically a recurrent neural network for the inference of two time domain HRV features: AVNN (the average of all the NN intervals) and IHR (instantaneous heart rate). The obtained results suggest that both AVNN and IHR can be accurately inferred from a shorter ECG interval of about 1 minute, with a mean error of < 5% of the computed HRV features.
Keywords: Heart rate variability, Long Short-Term Memory (LSTM)
1
Introduction
Over the last decades heart rate variability (HRV) analysis has become a popular method for the assessment of the autonomous nervous system in diverse fields of re-search. Depressed HRV has been proven to be an independent predictor for several clinical outcomes, such as death in chronic congestive heart failure [1], myocardial in-farction, mental stress detection [2], risk of accidental falls in hypertensive patients [3] and many other. HRV analysis attempts to assess cardiac autonomic regulation by quantifying the sinus rhythm variability [4], which is usually derived from the consec-utive QRS intervals (RR) of the electrocardiogram (ECG).
2
studies have shown that some of these features can be reliably computed and used from shorter ECG recordings(less than 5 minutes). The HRV features computed from an ECG segment that is less than 15 and 5 minutes are often referred to as short-term and ultra-short HRV features, respectively [1]. The need for reducing the ECG monitoring period is crucial, especially for real-time applications where decisions are usually taken from the analysis of the most recent ECG beats. Shorter ECG recordings can be easily recorded without significant increase in healthcare costs using wearable devices and they can be easily translated in the out-patient clinical life. Thus, being able to reduce the ECG recording interval without compromising the analysis results represents an important step towards using the HRV analysis in real-time applications.
The aim of this study is to evaluate the association between the time and space rep-resentation of the heartbeats and some of the HRV features to further reduce the number of beats required for the HRV estimation. Recent studies [3] [5] performed both short and ultra-short term HRV analysis for the comparison of their prediction capability on different clinical outcomes. Instead, we are interested to find out whether the HRV fea-tures computed on a 5 minutes ECG can be inferred using a shorter ECG interval. In order to achieve this, we developed a framework based on deep learning methodologies that proved to be appropriate for learning time series representations in recent studies [6] [7].
1.1 Related Work
Deep learning methods have been successfully employed for different time series anal-ysis tasks, for problems such as classification and time series forecasting. Recurrent neural networks (RNN) are capable of large scale learning as showed in recent studies, being used for speech recognition [8], language translation models [9], or mental stress classification based on ECG data [10], thus proved to be successful in learning temporal dependencies between the inputs.
However, a significant limitation of the simple RNN models which integrate state information over time is known as the vanishing or exploding gradient effects, both referring to the ability of RNNs to backpropagate an error signal through a long-range temporal interval. The RNN version, known as Long Short-Term Memory (LSTM), first proposed in [11], are recurrent modules which enable long-range learning. LSTM units consist of hidden states augmented with nonlinear mechanisms to allow a state to propagate without modification, be updated, or be reset, using simple learned gating functions. Thus, in this study we propose a LSTM based model for the HRV features inference.
2
Methods
2.1 Dataset description
the cardiovascular problems of sleep-disordered breathing. Out of the total 6441 sub-jects enrolled in the study, a subset of 500 subsub-jects with high-quality ECG recordings (125-Hz sampling frequency) were selected for a sub-study to quantify the HRV by sleep stage. The computed 5-minute HRV features for the 500 subjects together with the original ECG recordings were made available. Some of the available HRV features are summarize in Table 1.
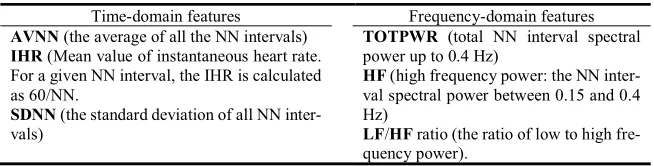
Table 1. Some SHHS 5 minutes HRV features
Time-domain features Frequency-domain features AVNN (the average of all the NN intervals)
IHR (Mean value of instantaneous heart rate. For a given NN interval, the IHR is calculated as 60/NN.
SDNN (the standard deviation of all NN inter-vals)
TOTPWR (total NN interval spectral power up to 0.4 Hz)
HF (high frequency power: the NN inter-val spectral power between 0.15 and 0.4 Hz)
LF/HF ratio (the ratio of low to high fre-quency power).
The available data for each subject comprises a mean of 7 hours of ECG recordings, which represent around 70 intervals of consecutive 5-minute ECG segments together with the corresponding HRV features for each segment. A histogram presenting the distribution of the 5-minute segments for the 500 subjects is presented in Fig. 1.
It has been previously shown that some of the HRV features are highly correlated with each other, and so for short term data only the time-domain measures of AVNN, SDNN, rMSSD, pNN10 - pNN50 and the frequency-domain measures of total power, VLF power, LF power, HF power and LF/HF ratio can be reliably computed [4]. Con-sidering all these observations, this study focuses only on prediction of 4 HRV features: AVNN, SDNN, HF and IHR.
2.2 ECG preprocessing
4
2.3 LSTM architecture for the ECG analysis
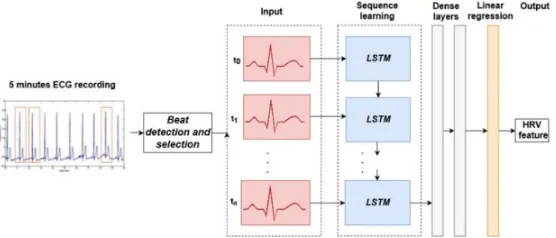
For the HRV features inference problem, the input is sequential consisting of consecu-tive heartbeats in a 5-minute window. Thus, the aim in this work is to investigate whether LSTM-based networks are able to learn a sequence of ECG beats for inferring the ultra-short term HRV features. The intuition behind employing an LSTM-based model is that the time-varying beat dynamics are explained by the HRV features and in the same time RNNs are specialized in learning temporal dependencies.
[image:5.612.151.459.123.246.2]The LSTM model employed in this study is shown in Fig. 3. The architecture con-sists of three parts: 1) data preprocessing, 2) aggregation of beats across time, sequence- learning, and 3) single/multiple stacked linear layers for performing a linear regression. Different number of beats extracted from each segment were considered as inputs to the LSTM cells, the tested values were: 250, 200 and 100, 50. The number of units in the LSTM cell was set to 60, the dense layer size was set to 100.
Fig. 3. The LSTM architecture used for HRV feature regression
2.4 Training and Evaluation
For training the network, we used the mean squared error (MSE) as optimization ob-jective, the learning rate was set to 0.01 and the used optimizer was the Adam optimizer [14]. The batch size was set to 100. Furthermore, we used dropout with probability 0.5
Fig. 1. Distribution of the five minutes ECG intervals for the 500 subjects
[image:5.612.169.447.444.563.2]for all cells and an early stopping criterion based on the minimum MSE obtained on the validation dataset. We trained the model for a maximum number of 15000 steps that correspond to about 68 epochs.
We evaluated the regression performance of the proposed LSTM model on the SHHS dataset. The regression performance was assessed using multiple measures: the MSE, median absolute error (MedAE), mean absolute error (MAE), the Pearson corre-lation coefficient (R) between the predictions and the correct HRV values and for meas-uring the agreement we used the Bland-Altman plot [15].
3
Results
The regression results obtained by employing the proposed LSTM architecture, using a maximum number of 250 time steps, for the selected four HRV features are presented in Table 2. Table 3 shows the regression results for the AVNN and IHR variables that could be predicted with a satisfactory error, as shown in Table 2, but using less time steps: 200, 100 and 50. The results were obtained on the test dataset, after training the model for the maximum number of epochs. The results for the early stopping criteria are not shown here as they are very similar to the presented ones.
Table 2. Test dataset LSTM regression results corresponding to four HRV features: AVNN, SDNN, HF and IHR for 250 time steps (250 input beats)
Variable MSE MedAE Correlation (R) MAE/Mean value (%) AVNN 3951 37.58ms 0.843 48.27ms/953.42ms (5%) SDNN 615.5 13ms 0.603 17.55ms/52.1ms (33.6%) HF 163.3 311ms2 0.04 552.9ms2/593.5ms2 (93.2%)
[image:6.612.141.471.388.440.2]IHR 13.4 2.09bpm 0.89 2.71bpm/63.86bpm (4.2%)
Table 3. Test dataset - LSTM results obtained for AVNN and IHR features considering different number of time steps
# beat
AVNN IHR
MSE MedAE
[ms] R MAE [ms] (% of mean) MSE MedAE [bpm] R MAE [bpm] (% of mean) 200 4743 39.69 0.79 51.8 (5.4%) 15.4 2.268 0.87 2.95 (4.6%) 100 4728 41.43 0.8 52.3 (5.48%) 22.61 2.51 0.80 3.34 (5.2%) 50 5437 46.55 0.78 57.04 (5.9%) 21.4 2.76 0.81 3.49 (5.4%)
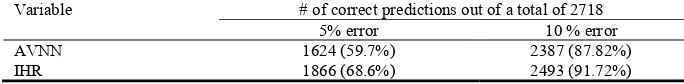
The number of samples that are predicted correctly on the test dataset within an error range of 5% of 10% of the correct value are presented in Table 4.
Table 4. # of correct predictions for AVNN and IHR using of 5% and 10% error threshold
Variable # of correct predictions out of a total of 2718 5% error 10 % error
AVNN 1624 (59.7%) 2387 (87.82%)
[image:6.612.138.475.479.540.2] [image:6.612.133.475.602.644.2]6
Fig. 4. Distribution plot of the error between computed and predicted AVNN
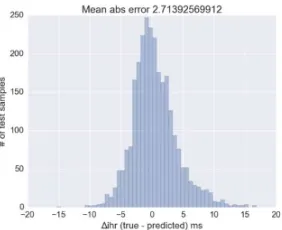
[image:7.612.144.287.127.259.2]Fig. 5. Distribution plot of the error between computed and predicted IHR
Fig. 6. Bland Altman plot for the AVNN on the test dataset
Fig. 7. Bland Altman plot for the IHR on the test dataset
4
Discussion
[image:7.612.317.458.143.258.2] [image:7.612.142.287.302.416.2] [image:7.612.317.459.303.416.2]reveling that the majority of the points lie within ±1.96 std of the mean difference for both of the variables.
We developed and evaluated a deep learning model employing an LSTM network for the HRV features inference based on the raw ECG signal. We investigated the num-ber of beats that are necessary to predict some of the time domain features with a satis-factory mean absolute error, and we showed that 50 beats are appropriate. However, changing the network architecture and cascading a CNN with the LSTM are interesting directions to be explored in the future.
Conflict of interest
.The authors declare that they have no conflict of interest.References
1. T. F. of the E. S. of C. the N. A. S. of P. Electrophysiology, “Heart Rate Variability: Stand-ards of Measurement, Physiological Interpretation, and Clinical Use,” Circulation, vol. 93, no. 5, pp. 1043–1065, Mar. 1996.
2. R. Castaldo, W. Xu, P. Melillo, L. Pecchia, L. Santamaria, and C. James, “Detection of mental stress due to oral academic examination via ultra-short-term HRV analysis,” Conf. Proc. Annu. Int. Conf. IEEE Eng. Med. Biol. Soc. IEEE Eng. Med. Biol. Soc. Annu. Conf., vol. 2016, pp. 3805–3808, 2016.
3. R. Castaldo, P. Melillo, R. Izzo, N. D. Luca, and L. Pecchia, “Fall Prediction in Hypertensive Patients via Short-Term HRV Analysis,” IEEE J. Biomed. Health Inform., vol. 21, no. 2, pp. 399–406, Mar. 2017.
4. J.-P. Niskanen, M. P. Tarvainen, P. O. Ranta-aho, and P. A. Karjalainen, “Software for ad-vanced HRV analysis,” Comput. Methods Programs Biomed., pp. 73–81, Oct. 2004. 5. R. Castaldo, P. Melillo, and L. Pecchia, “Acute Mental Stress Detection via Ultra-short term
HRV Analysis,” in World Congress on Medical Physics and Biomedical Engineering, June 7-12, 2015, Toronto, Canada, 2015, pp. 1068–1071.
6. Z. C. Lipton, D. C. Kale, C. Elkan, and R. Wetzell, “Learning to diagnose with LSTM re-current neural networks,” ArXiv Prepr. ArXiv151103677, 2015.
7. S. Kiranyaz, T. Ince, and M. Gabbouj, “Real-Time Patient-Specific ECG Classification by 1-D Convolutional Neural Networks,” IEEE Trans. Biomed. Eng, pp. 664–675, Mar. 2016. 8. A. Graves, A. Mohamed, and G. Hinton, “Speech recognition with deep recurrent neural
networks,” 2013, pp. 6645–6649.
9. I. Sutskever, O. Vinyals, and Q. V. Le, “Sequence to sequence learning with neural net-works,” in Advances in neural information processing systems, 2014, pp. 3104–3112. 10. P. Bashivan, I. Rish, M. Yeasin, and N. Codella, “Learning Representations from EEG with
Deep Recurrent-Convolutional Neural Networks,” ArXiv151106448 Cs, Nov. 2015. 11. S. Hochreiter and J. Schmidhuber, “Long Short-Term Memory,” Neural Comput, vol. 9, no.
8, pp. 1735–1780, Nov. 1997.
12. D. A. Dean et al., “Scaling Up Scientific Discovery in Sleep Medicine: The National Sleep Research Resource,” Sleep, vol. 39, no. 5, pp. 1151–1164, May 2016.
13. S. Yazdani, S. Fallet, and J.-M. Vesin, “A Novel Short-term Event Extraction Algorithm for Biomedical Signals,” IEEE Trans. Biomed. Eng., Jun. 2017.
14. D. P. Kingma and J. Ba, “Adam: A Method for Stochastic Optimization,” ArXiv14126980 Cs, Dec. 2014.