JHEP01(2016)064
Published for SISSA by SpringerReceived: October 14, 2015 Revised: December 7, 2015 Accepted: December 20, 2015 Published: January 11, 2016
Measurement of the production cross-section of a
single top quark in association with a
W
boson at
8 TeV with the ATLAS experiment
The ATLAS collaboration
E-mail:
atlas.publications@cern.ch
Abstract:
The cross-section for the production of a single top quark in association with a
W
boson in proton-proton collisions at
√
s
= 8 TeV is measured. The dataset corresponds
to an integrated luminosity of 20.3 fb
−1, collected by the ATLAS detector in 2012 at the
Large Hadron Collider at CERN. Events containing two leptons and one central
b
-jet are
selected. The
W t
signal is separated from the backgrounds using boosted decision trees,
each of which combines a number of discriminating variables into one classifier. Production
of
W t
events is observed with a significance of 7
.
7
σ
. The cross-section is extracted in a
profile likelihood fit to the classifier output distributions. The
W t
cross-section, inclusive
of decay modes, is measured to be 23
.
0
±
1
.
3(stat.)
+3−3..25(syst.)
±
1
.
1(lumi.) pb. The measured
cross-section is used to extract a value for the CKM matrix element
|
V
tb|
of 1
.
01
±
0
.
10
and a lower limit of 0.80 at the 95% confidence level. The cross-section for the production
of a top quark and a
W
boson is also measured in a fiducial acceptance requiring two
leptons with
p
T>
25 GeV and
|
η
|
<
2
.
5, one jet with
p
T>
20 GeV and
|
η
|
<
2
.
5, and
E
Tmiss>
20 GeV, including both
W t
and top-quark pair events as signal. The measured
value of the fiducial cross-section is 0
.
85
±
0
.
01(stat.)
+0−0..0607(syst.)
±
0
.
03(lumi.) pb.
Keywords:
Hadron-Hadron scattering, Top physics
JHEP01(2016)064
Contents
1
Introduction
1
2
The ATLAS detector and object reconstruction
3
3
Data and simulated samples
5
4
Event selection
7
5
Analysis
8
6
Systematic uncertainties
13
7
Results
18
7.1
Measurement of the inclusive cross-section
18
7.2
Constraints on
|
f
LVV
tb|
and
|
V
tb|
20
8
Cross-section measurement inside a fiducial acceptance
21
8.1
Fiducial selection
22
8.2
Systematic uncertainties
22
8.3
Results
23
9
Conclusion
24
The ATLAS collaboration
32
1
Introduction
JHEP01(2016)064
g
b
t
b
ℓ
−ℓ
+¯
ν
ν
W
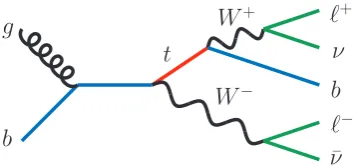
+ [image:3.595.203.380.88.171.2]W
−Figure 1. Representative leading-order Feynman diagram for the production and decay of a single top quark in association with aW boson.
The production of single top quarks has been observed at the Tevatron
proton-antiproton collider in the
t
-channel [
10
,
11
] and
s
-channel [
12
–
14
], as well as their
combi-nation [
15
–
17
]. The
W t
process has a small expected cross-section at the Tevatron and
was not observed. The
t
-channel mode has been observed by both the ATLAS [
18
,
19
] and
CMS [
20
,
21
] collaborations at the LHC. The
s
-channel mode has not yet been measured
at the LHC because of its small production cross-section [
22
]. Evidence for
W t
production
was reported by ATLAS [
23
] and CMS [
24
] in proton-proton (
pp
) collisions at 7 TeV. The
observation of
W t
production in
pp
collisions at 8 TeV has been reported by CMS [
25
].
Production of
W t
events proceeds via
b
-quark-induced partonic channels such as
gb
→
W t
→
W
−W
+b
. A leading-order (LO) Feynman diagram in the 5-flavour-number scheme
(5FNS, considering the quarks
u
,
d
,
s
,
c
, and
b
in the initial state) is shown in figure
1
.
The presence of only a single
b
-quark in the final state represents a distinctive feature
with respect to the
W
+W
−b
¯
b
final state of top-quark pair (
t
¯
t
) production. The
W t
final
state contains an additional
b
-quark in higher-order Quantum Chromodynamics (QCD)
correction diagrams in the 5FNS, as well as in the leading-order process in the
4-flavour-number scheme (4FNS, considering only the quarks
u
,
d
,
s
,
c
in the initial state), making
it challenging to experimentally separate
W t
production from
t
¯
t
production.
The theoretical prediction for the
W t
production cross-section at next-to-leading
order (NLO) with next-to-next-to-leading logarithmic (NNLL) soft gluon corrections is
22
.
37
±
1
.
52 pb [
26
] at a centre-of-mass energy of
√
s
=8 TeV for a top-quark mass of
m
t= 172
.
5 GeV [
27
]. In this calculation, the uncertainty on the theoretical cross-section
accounts for the variation of the renormalisation and factorisation scale between
m
t/
2
and 2
m
tand for the parton distribution function (PDF) uncertainties (using the 90%
confidence level errors of the MSTW2008 NNLO PDF set [
28
]). This cross-section
rep-resents about 20% of the total cross-section for all single top-quark production modes
at the LHC. A second theoretical prediction for the
W t
production cross-section is
18
.
8
±
0
.
8 (scale)
±
1
.
7 (PDF) pb, computed at NLO with Hathor v2.1 [
29
,
30
]. The PDF
uncertainties are calculated using the PDF4LHC prescription [
31
] with three different PDF
sets (
CT10
,
MSTW2008nlo68cl
[
28
] and
NNPDF2.3
[
32
]). The renormalisation and
factorisation scales are set to 65 GeV and the
b
-quark from initial-state radiation is required
to have a transverse momentum of less than 60 GeV.
JHEP01(2016)064
detector in 2012. The measurement is carried out in the dilepton final state shown in
fig-ure
1
where each
W
boson decays to an electron or a muon and a neutrino (
eν
or
µν
). This
analysis requires two opposite-sign high-transverse-momentum (
p
T) leptons (
ee
,
eµ
,
µµ
),
missing transverse momentum (
E
missT
), and one high-
p
Tcentral jet, which is required to
contain a
b
-hadron (
b
-jet). The main background to this signature is from
t
¯
t
production,
with smaller backgrounds coming from dibosons (
W W
,
W Z
,
ZZ
),
Z
+jets, and events
where one or both leptons are misidentified (fake-lepton events) or non-prompt. Control
regions enriched in
t
¯
t
and other background events are also defined. Events in the
t
¯
t
-enriched regions fulfil the same lepton and missing transverse momentum requirements,
and have exactly two jets, with one or both of the jets required to be identified as a
b
-jet.
Events in the other background-enriched regions have one or two jets which are required
to not be identified as
b
-jets. The backgrounds are estimated with simulation, except the
non-prompt or fake-lepton background, which is estimated from data. Boosted decision
trees (BDT) are used to optimise the discrimination between signal and background [
33
].
The cross-section is extracted using a profile likelihood fit of the BDT response. The
background normalisation and the systematic uncertainties are constrained by
simultane-ously analysing phase-space regions with substantial
W t
signal contributions and regions
where the
W t
contributions are negligible. The ratio of the measured cross-section to the
theoretical prediction (which assumes
V
tb= 1) is used to extract a value of
|
f
LVV
tb|
.
In the 5FNS, the
W t
single top-quark process overlaps and interferes with
t
t
¯
production
at NLO where diagrams involving two top quarks are part of the real emission corrections
to
W t
production [
34
,
35
]. A calculation in the 4FNS scheme includes
W t
and
t
¯
t
as well as
non-top-quark diagrams [
36
] and the interference between
W t
and
t
¯
t
enters already at tree
level. A measurement of the cross-section inside a fiducial acceptance, designed to reduce
the dependence on the theory assumptions, is also presented. The fiducial acceptance
is defined using physics objects constructed of stable particles to approximate the
W t
detector acceptance. The cross-section for the sum of
W t
and
t
t
¯
production is measured
in this fiducial acceptance.
This paper is organised as follows: section
2
provides a brief overview of the ATLAS
detector and the definition of physics objects. Section
3
describes the data and Monte
Carlo samples used for the analysis. Section
4
describes the event selection and background
estimation. Section
5
presents the procedure defined to discriminate the signal from the
backgrounds using BDTs. The dominant systematic uncertainties are discussed in section
6
.
Section
7
presents the results for the inclusive cross-section measurement and for
|
V
tb|
and
discusses the impact of systematic uncertainties. Section
8
defines the fiducial acceptance
and presents the fiducial cross-section measurement. Finally, a summary is presented in
section
9
.
2
The ATLAS detector and object reconstruction
The ATLAS detector [
37
] is a multi-purpose particle detector with a forward-backward
symmetric cylindrical geometry and a near 4
π
coverage in solid angle.
1ATLAS comprises
1ATLAS uses a right-handed coordinate system with its origin at the nominal interaction point (IP) in
JHEP01(2016)064
an inner detector (ID) surrounded by a thin superconducting solenoid providing a 2 T axial
magnetic field, a calorimeter system and a muon spectrometer in a toroidal magnetic field.
The ID tracking system covers the pseudorapidity range
|
η
|
<
2
.
5 and consists of silicon
pixel, silicon microstrip, and transition radiation tracking detectors.
The ID provides
precise position and momentum measurements for charged particles and allows efficient
identification of jets containing
b
-hadrons. Lead/liquid-argon (LAr) sampling calorimeters
provide electromagnetic (EM) energy measurements with high granularity up to
|
η
|
= 2
.
5.
A hadron (steel/scintillator-tile) calorimeter covers the central pseudorapidity range (
|
η
|
<
1
.
7). The end-cap and forward regions are instrumented with LAr calorimeters for both the
EM and hadronic energy measurements up to
|
η
|
= 4
.
9. The muon spectrometer surrounds
the calorimeters. It consists of three large air-core toroid superconducting magnet systems,
separate trigger detectors and high-precision tracking chambers providing accurate muon
tracking for
|
η
|
<
2
.
7 and muon triggering for
|
η
|
<
2
.
4.
A three-level trigger system [
38
] is used to select events. The first-level trigger is
implemented in hardware and uses a subset of the detector information to reduce the event
rate to less than 75 kHz. Two software-based trigger levels, Level-2 and the Event Filter,
reduce the rate of Level-1 accepts to about 400 Hz on average.
Candidate events are characterised by exactly two leptons (
ee
,
µµ
,
eµ
), missing
trans-verse momentum
E
Tmissdue to the neutrinos from the leptonic decays of the two
W
bosons,
and a
b
-jet originating from the top-quark decay. Electron candidates are reconstructed
from energy clusters in the calorimeter which are matched to ID tracks [
39
]. Selected
electrons must have
E
T>
25 GeV and
|
η
|
<
2
.
47, excluding the barrel/end-cap transition
region of 1
.
37
<
|
η
|
<
1
.
52. A hit in the innermost layer of the ID is required, to reject
photon conversions. Electron candidates are required to fulfil calorimeter-based and
track-based isolation requirements in order to suppress backgrounds from hadron decays. The
calorimeter transverse energy within a cone of size ∆
R
= 0
.
2 and the scalar sum of track
p
Twithin ∆
R
of 0
.
3 around the electron, in each case excluding the contribution from the
elec-tron itself, are each required to be smaller than
E
T- and
η
-dependent thresholds calibrated
to give nominal selection efficiencies of 90% for prompt electrons from
Z
→
ee
decays.
Muon candidates are reconstructed by combining matching tracks reconstructed in
both the ID and the muon spectrometer [
40
]. Selected muons have a
p
T>
25 GeV and
|
η
|
<
2
.
5. An isolation criterion [
41
] is applied in order to reduce background contamination
from events in which a muon candidate is accompanied by hadrons. The ratio of the sum of
p
Tof additional tracks in a variable-size cone around the muon, to the
p
Tof the muon [
41
],
is required to be less than 0.05, yielding a selection efficiency of 97% for prompt muons
from
Z
→
µµ
decays.
Jets are reconstructed using the anti-
k
tjet clustering algorithm [
42
] with a radius
pa-rameter of
R
= 0
.
4, using locally calibrated topological clusters as inputs [
43
]. Jet energies
are calibrated using energy- and
η
-dependent correction factors derived from simulation
and with residual corrections from in-situ measurements [
44
]. Jets are required to be
re-of the LHC ring, and they-axis points upwards. Cylindrical coordinates (r, φ) are used in the transverse plane,φbeing the azimuthal angle around thez-axis. The pseudorapidity is defined in terms of the polar angleθ asη=−ln tan(θ/2). Angular separation is measured in units of ∆R≡p
JHEP01(2016)064
constructed in the range
|
η
|
<
2
.
5 and to have
p
T>
20 GeV. To reduce the contamination
due to jets from additional
pp
interactions in the same or neighbouring bunch crossings
(pileup), tracks originating from the primary vertex must contribute a large fraction to the
scalar sum of the
p
Tof all tracks in the jet. This jet vertex fraction (JVF) [
45
] is required
to be at least 50% for jets with
p
T<
50 GeV and
|
η
|
<
2
.
4.
To avoid double-counting objects in an event and to suppress leptons from
heavy-flavour decays, overlaps between reconstructed objects are resolved in the following order:
(1) jets overlapping with a selected electron within ∆
R
of 0
.
2 are removed; (2) electrons
that are within ∆
R
of 0
.
4 of a jet are removed; (3) events are rejected if a selected electron
shares an ID track with a selected muon; and (4) muons that are within ∆
R
of 0
.
4 of a jet
are removed.
The identification of
b
-jets relies of the long lifetime of
b
-hadrons and the topological
properties of secondary and tertiary decay vertices reconstructed within the jet. A
combi-nation of multivariate algorithms is used to identify
b
-jets (
b
-tag) [
46
]. The
b
-tag algorithm
has an average efficiency of 70% for
b
-jets from
t
t
¯
decays and an average mis-tag rate of
0
.
8% [
47
,
48
] for light-quark jets.
The missing transverse momentum (
E
Tmiss) is calculated as the magnitude of the vector
sum over the energies of all clusters in the calorimeters, and is refined by applying
object-level corrections to the contributions arising from identified electrons, muons, and jets [
49
].
3
Data and simulated samples
The dataset used for this analysis was collected at
√
s
= 8 TeVin 2012 by the ATLAS
detector at the LHC, and corresponds, after data quality requirements, to an integrated
luminosity of 20.3 fb
−1. Events are required to have fired either a electron or
single-muon trigger. The electron and single-muon triggers impose a
p
Tthreshold of 24 GeV, along
with isolation requirements on the lepton. To recover efficiency for higher
p
Tleptons, the
isolated lepton triggers are complemented by triggers without isolation requirements, but
with
p
Tthresholds of 60 GeV and 36 GeV for electrons and muons respectively.
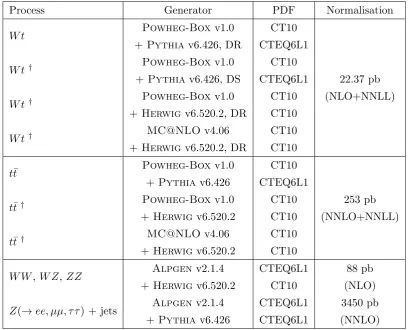
Samples of signal and background events are simulated using various Monte Carlo
(MC) generators, as summarised in table
1
. The generators used for the estimation of
the modelling uncertainties are listed together with the reference simulation for the
W t
signal and the
t
¯
t
background. In addition, PDFs used by each generator and the
pertur-bative order in QCD of the respective calculations are provided. All simulation samples
are normalised to theoretical cross-section predictions. A top-quark mass of 172.5 GeV is
used [
27
].
The
W t
events are simulated using the NLO generator
Powheg
-
Box
[
50
,
51
],
inter-faced to
Pythia
[
52
] for parton showering with the Perugia 2011C set of tuned
parame-ters [
53
]. In the
Powheg
-
Box
event generator, the CT10 [
54
] PDFs are used, while the
CTEQ6L1 [
55
] PDFs are used for
Pythia
. The generation of
W t
events is performed in
cross-JHEP01(2016)064
Process
Generator
Normalisation
W t
Powheg
-
Box
v1.0
CT10
+
Pythia
v6.426, DR
CTEQ6L1
W t
†Powheg
-
Box
v1.0
CT10
+
Pythia
v6.426, DS
CTEQ6L1
22.37 pb
W t
†Powheg
-
Box
v1.0
CT10
(NLO+NNLL)
+
Herwig
v6.520.2, DR
CT10
W t
†MC@NLO
v4.06
CT10
+
Herwig
v6.520.2, DR
CT10
t
¯
t
Powheg
-
Box
v1.0
CT10
+
Pythia
v6.426
CTEQ6L1
t
¯
t
†Powheg
-
Box
v1.0
CT10
253 pb
+
Herwig
v6.520.2
CT10
(NNLO+NNLL)
t
¯
t
†MC@NLO
v4.06
CT10
+
Herwig
v6.520.2
CT10
W W
,
W Z
,
ZZ
Alpgen
v2.1.4
CTEQ6L1
88 pb
+
Herwig
v6.520.2
CT10
(NLO)
Z
(
→
ee, µµ, τ τ
) + jets
Alpgen
v2.1.4
CTEQ6L1
3450 pb
[image:7.595.93.504.83.413.2]+
Pythia
v6.426
CTEQ6L1
(NNLO)
Table 1. Monte Carlo generators used to model the W t signal and the background processes at
√s= 8 TeV. The samples marked with a
†are used as alternatives forW tort¯tto evaluate modelling uncertainties. DR refers to the diagram-removal scheme and DS to the diagram-subtraction scheme to handle the overlap and interference betweenW tandtt¯, as discussed in the text.
section contribution from Feynman diagrams containing two top quarks is subtracted, is
used to evaluate the uncertainty associated with the modelling of the overlap between
W t
and
t
¯
t
[
56
]. Two alternative samples are used to determine theory modelling
uncertain-ties: one using
MC@NLO
[
57
] and the other using
Powheg
-
Box
, both interfaced to
Herwig
[
58
], with
Jimmy
for underlying-event modelling [
59
].
The dominant and largely irreducible
t
¯
t
background is simulated with
Powheg
-
Box
,
using the CT10 NLO PDF set, with parton showering and hadronisation performed with
Pythia
. The
t
¯
t
production cross-section is
σ
t¯t= 253
+13−15pb, computed at NNLO in QCD,
including resummation of NNLL soft gluon terms [
60
–
66
].
Smaller backgrounds arise from diboson and
Z
+jets production. The
Alpgen
LO
gen-erator [
67
], interfaced to
Herwig
, is used to generate diboson events, with the CTEQ6L1
PDF set. Diboson events are normalised to the NLO prediction [
68
]. The
Z
+jets
back-ground is generated with
Alpgen
, interfaced to
Pythia
, with the CTEQ6L1 PDF set.
The diboson estimate also accounts for lower cross-section diboson processes, including
JHEP01(2016)064
The non-prompt or fake-lepton background arises from non-prompt electrons or muons
from the weak decay of mesons events, or from events where one or both leptons are
mis-identified. This background contribution includes the
t
-channel and
s
-channel single
top-quark production modes. The normalisation and shape of the non-prompt or fake-lepton
background is determined directly from data, using the matrix method [
70
]. In addition
to events from the signal data sample (labelled as “tight” events), a second (“loose”) set
enriched with fake leptons is defined by removing the lepton isolation requirement. Given
the probabilities for real and fake leptons that already passed the loose selection to also
pass the tight selection, the number of tight events with a fake lepton is determined from
a linear system of equations.
Generated events are passed through a simulation [
71
] of the ATLAS detector based
on
Geant4
[
72
] and reconstructed using the same procedure as for collision data. The
alternative
t
¯
t
samples used to evaluate theory modelling uncertainties are instead processed
with the ATLFAST-II [
71
] simulation, which employs a parameterisation of the response
of the electromagnetic and hadronic calorimeters, and
Geant4
for the other detector
components. The simulations also include the effect of multiple
pp
collisions per bunch
crossing (pileup).
4
Event selection
The dilepton selection requires that each event has a high-quality reconstructed primary
vertex, which must be formed from at least five tracks with
p
T>
0
.
4 GeV. Each selected
event must contain exactly two isolated opposite-sign leptons (
e
,
µ
) that originate from the
primary vertex, at least one of which must be associated with a lepton that triggered the
event. In addition, since the
W t
signature contains a high-
p
Tquark from the top-quark
decay, events are required to have either one jet or two jets.
Events from
Z
-boson decays (including
Z
→
ee
,
Z
→
µµ
, and
Z
→
τ τ
with
τ
→
e
or
µ
)
are suppressed through requirements on the invariant mass of the dilepton system as well
as on
E
Tmissand the pseudorapidity of the leptons+jet(s) system. Events containing
same-flavour leptons (
ee
or
µµ
) are rejected if the invariant mass of the lepton pair is between
81 GeV and 101 GeV. Events are also required to have
E
Tmiss>
40 GeV, with the threshold
raised to 70 GeV if the invariant mass of the lepton pair is below 120 GeV. Events containing
one electron and one muon are required to have
E
Tmiss>
20 GeV, with the threshold raised
to 50 GeV if the invariant mass of the lepton pair is below 80 GeV. Since
W t
events are
more central than
Z
+jets events, the pseudorapidity of the system of both leptons and all
jets, reconstructed from the vectorial sum of lepton and jet momenta, is required to be
|
η
sys|
<
2
.
5.
JHEP01(2016)064
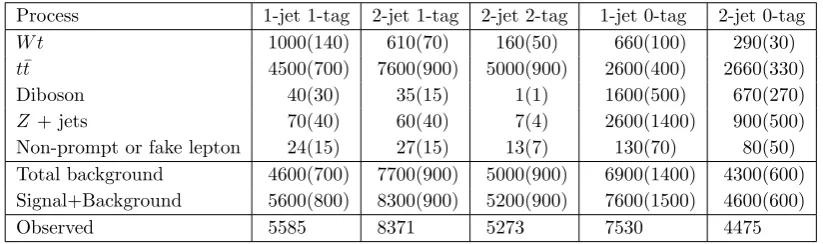
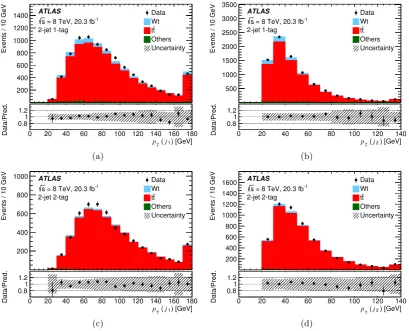
Process 1-jet 1-tag 2-jet 1-tag 2-jet 2-tag 1-jet 0-tag 2-jet 0-tagW t 1000(140) 610(70) 160(50) 660(100) 290(30) t¯t 4500(700) 7600(900) 5000(900) 2600(400) 2660(330) Diboson 40(30) 35(15) 1(1) 1600(500) 670(270) Z + jets 70(40) 60(40) 7(4) 2600(1400) 900(500) Non-prompt or fake lepton 24(15) 27(15) 13(7) 130(70) 80(50) Total background 4600(700) 7700(900) 5000(900) 6900(1400) 4300(600) Signal+Background 5600(800) 8300(900) 5200(900) 7600(1500) 4600(600)
[image:9.595.92.504.83.205.2]Observed 5585 8371 5273 7530 4475
Table 2. Numbers of expected events for theW tsignal and the various background processes and observed events in data in the five regions, with their predicted uncertainties. Uncertainties shown include all sources of statistical and systematic uncertainty, summed in quadrature.
in the other backgrounds. Observed yields and kinematic distributions in the 0-tag control
regions are studied while choosing the selection cuts; the three regions included in the
cross-section fit are not part of this optimisation procedure.
The predicted event yields for signal and backgrounds, and their uncertainties, are
summarised in table
2
. Uncertainties from different sources are added in quadrature, not
taking into account possible correlations. Many of the sources of systematic uncertainty
are common to the
W t
signal and
t
¯
t
background processes, and correlated between regions
(see section
6
). The numbers of events observed in data and the total predicted yields are
compatible within the uncertainties. The
W t
signal comprises 21% of the total expected
event yield in the 1-jet 1-tag region. The main background originates from the production
of top-quark pair events, which accounts for almost 80% of the total event yield in the
1-jet 1-tag region. For the other regions included in the fit, the expected fraction of signal
events is smaller, 9% in the 2-jet 1-tag region and 3% in the 2-jet 2-tag region, which is the
most enriched in
t
t
¯
. The other backgrounds are small in the 1-jet 1-tag and 2-jet regions
where they account for 2% of the total event yield. The 0-tag control regions are enriched
in other backgrounds (diboson,
Z
+jets and non-prompt or fake lepton), which contribute
40–60% of the total event yield.
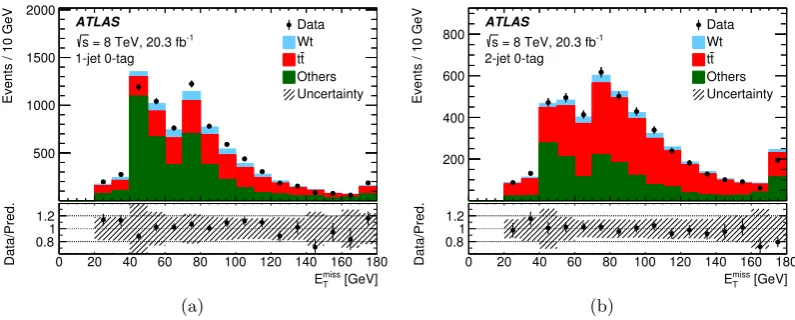
The
E
missT
distributions of events in the 0-tag regions are shown in figure
2
to
demon-strate the good modelling of the other backgrounds. The behaviour of this distribution
at low
E
Tmissvalues is a result of the different requirements for same-flavour and
opposite-flavour leptons. Figures
3
and
4
show the distributions of kinematic variables of
recon-structed objects for the three
b
-tagged regions. The data distributions are well modelled
by the background and signal expectations in all regions.
5
Analysis
JHEP01(2016)064
Events / 10 GeV
500 1000 1500 2000 Data Wt t t Others Uncertainty ATLAS -1
= 8 TeV, 20.3 fb s 1-jet 0-tag [GeV] T miss E
0 20 40 60 80 100 120 140 160 180
Data/Pred.
0.81 1.2
(a)
Events / 10 GeV
200 400 600 800 Data Wt t t Others Uncertainty ATLAS -1 = 8 TeV, 20.3 fb s 2-jet 0-tag [GeV] T miss E 0 20 40 60 80 100 120 140 160 180
Data/Pred.
0.81 1.2
[image:10.595.97.495.95.255.2](b)
Figure 2. Distributions of the missing transverse momentumEmiss
T in (a) 1-jet and (b) 2-jet events
with 0b-tags. The simulated signal and background contributions are scaled to their expectations. The hatched area represents the sum in quadrature of the statistical and systematic uncertainties. The last bin includes the overflow.
Events / 10 GeV
200 400 600 800 1000 1200 Data Wt t t Others Uncertainty ATLAS -1 = 8 TeV, 20.3 fb s 1-jet 1-tag ) [GeV] 1 l ( T p
0 50 100 150 200
Data/Pred.
0.81 1.2
(a)
Events / 10 GeV
500 1000 1500 2000 2500 Data Wt t t Others Uncertainty ATLAS -1 = 8 TeV, 20.3 fb s 1-jet 1-tag ) [GeV] 2 l ( T p
0 20 40 60 80 100 120
Data/Pred.
0.81 1.2
(b)
Events / 10 GeV
200 400 600 800 1000 Data Wt t t Others Uncertainty ATLAS -1 = 8 TeV, 20.3 fb s 1-jet 1-tag ) [GeV] 1 j ( T p
0 20 40 60 80 100 120 140 160 180
Data/Pred.
0.81 1.2
(c)
Events / 10 GeV
200 400 600 800 1000 Data Wt t t Others Uncertainty ATLAS -1 = 8 TeV, 20.3 fb s 1-jet 1-tag [GeV] T miss E 0 20 40 60 80 100 120 140 160 180
Data/Pred.
0.81 1.2
(d)
Figure 3. Distributions, in the 1-jet 1-tag region, of (a) pT of the leading lepton (`1), (b) pT
of the second-leading lepton (`2), (c) pT of the jet (j1), and (d) ETmiss. The simulated signal and
[image:10.595.96.496.335.659.2]JHEP01(2016)064
Events / 10 GeV
200 400 600 800 1000 1200 1400 Data Wt t t Others Uncertainty ATLAS -1 = 8 TeV, 20.3 fb s 2-jet 1-tag ) [GeV] 1 j ( T p
0 20 40 60 80 100 120 140 160 180
Data/Pred.
0.81 1.2
(a)
Events / 10 GeV
500 1000 1500 2000 2500 3000 3500 Data Wt t t Others Uncertainty ATLAS -1
= 8 TeV, 20.3 fb s 2-jet 1-tag ) [GeV] 2 j ( T p
0 20 40 60 80 100 120 140
Data/Pred.
0.81 1.2
(b)
Events / 10 GeV
200 400 600 800 1000 Data Wt t t Others Uncertainty ATLAS -1 = 8 TeV, 20.3 fb s 2-jet 2-tag ) [GeV] 1 j ( T p
0 20 40 60 80 100 120 140 160 180
Data/Pred.
0.81 1.2
(c)
Events / 10 GeV
200 400 600 800 1000 1200 1400 1600 Data Wt t t Others Uncertainty ATLAS -1 = 8 TeV, 20.3 fb s 2-jet 2-tag ) [GeV] 2 j ( T p
0 20 40 60 80 100 120 140
Data/Pred.
0.81 1.2
[image:11.595.93.503.90.421.2](d)
Figure 4. Distributions of thepTof the leading jet (j1) and the second-leading jet (j2) in the (a,b)
2-jet 1-tag and (c,d) 2-jet 2-tag regions. The simulated signal and background contributions are scaled to their expectations. The hatched area represents the sum in quadrature of the statistical and systematic uncertainties. The last bin includes the overflow.
equal-size
W t
samples are combined to reduce sensitivity to the modelling uncertainties
and to maximise the number of events available for training: the
Powheg-Box+Pythia
sample with the DR scheme, the
Powheg-Box+Pythia
sample with the DS scheme,
and the
Powheg-Box+Herwig
sample with the DR scheme. The
AdaBoost
boosting
algorithm is used [
74
]. This algorithm increases the event weight for mis-classified events
for consecutive trees in the training. The final BDT is then the weighted average over
all trees. The list of variables entering the BDT algorithm is chosen based on the power
to discriminate the
W t
signal from the
t
¯
t
background and is derived from a large set
of kinematic variables that show good agreement between data and MC simulation. The
number of input variables is a compromise between the achievable discrimination power and
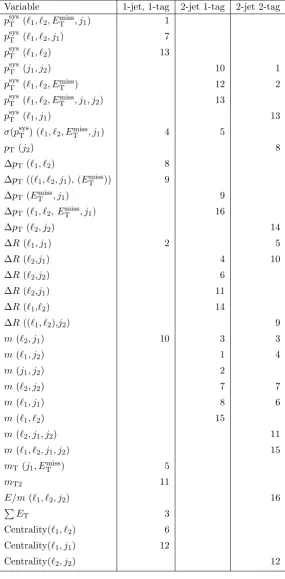
possible overtraining. As a result of this optimisation procedure, 13, 16, and 16 variables
are selected for the 1-jet 1-tag, 2-jet 1-tag, and 2-jet 2-tag regions, respectively.
JHEP01(2016)064
•
p
sysT(
o
1, . . . , o
n), magnitude of the vector sum of the transverse momenta of
the objects.
•
P
E
T, the scalar sum of transverse energy of calorimeter cells. For cells associated
with electrons and jets, the corresponding corrections are applied.
•
σ
(
p
sysT(
o
1, . . . , o
n)), the ratio ofp
sysTto (
H
T+
P
E
T), where
H
Tis the scalar sum of
the transverse momenta of the objects.
•
∆
p
T(
o
1, o
2), the difference in
p
Tbetween the two objects.
•
∆
R
(
o
1, o
2), the separation of the two objects in
φ
–
η
space.
•
m
T(
o
1, o
2), the transverse mass, given by
p
2
p
T(
o
1)
p
T(
o
2)(1
−
cos ∆
φ
).
•
Centrality(
o
1, o
2), the ratio of the scalar sum of the
p
Tof the two objects to the sum
of their energies.
•
m
(
o
1, o
2), the invariant mass of the system of the two objects.
•
m
T2, which contains information about the presence of the two neutrinos from the
two
W
-boson decays [
75
–
77
]. The
m
T2algorithm creates candidates for the
trans-verse momenta of the two neutrinos, which must sum to give the missing transtrans-verse
momentum. These are combined with the momenta of the two leptons to form the
transverse mass of two candidate
W
bosons, with each also fulfilling a
W
-boson mass
constraint. For each such candidate pair, the larger of the two transverse masses is
kept. Then
m
T2is given by the smallest transverse mass in all possible candidate
pairs.
•
E/m
(
o
1, o
2, o
3), the ratio of the energy of the system of the three objects to the
invariant mass of this system.
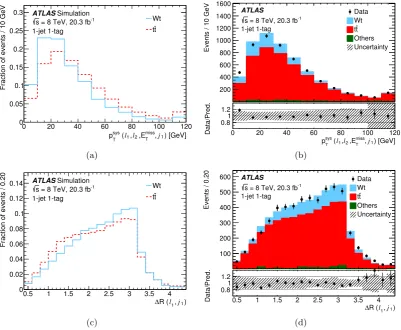
Figure
5
compares the shapes of the most important variables in the 1-jet 1-tag region
for
W t
and
t
¯
t
events and shows a comparison of the data and the SM predictions. The most
important variable is
p
sysT(
`
1, `
2, E
Tmiss, j
1), which is sensitive to the unidentified
b
-quark in
t
¯
t
events. This variable peaks at lower values for
W t
and has a longer tail for
t
¯
t
. The
second most important variable is the separation of the leading lepton and the jet, in
φ
-
η
space. These two objects originate from the same top quark in
W t
events, leading to a
sharper peak than in
t
¯
t
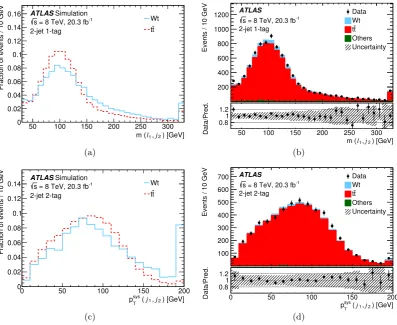
events. Figure
6
shows the most important discriminating variables
in the 2-jet regions. Here, the
p
sysTdistribution also peaks at lower values for
W t
than for
t
¯
t
, but the distribution is also broader for
W t
, resulting in a long tail. The invariant
mass variables are important for 2-jet events, where half of the possible lepton-jet pairings
correspond to the objects from the decay of one of the top quarks in
t
t
¯
events leading to a
peak at lower invariant mass. For
W t
, only one quarter of the possible pairings of jets and
leptons correspond to the objects from the top-quark decay.
JHEP01(2016)064
Variable 1-jet, 1-tag 2-jet 1-tag 2-jet 2-tagpsysT (`1, `2, ETmiss, j1) 1
psysT (`1, `2, j1) 7
psysT (`1, `2) 13
psysT (j1, j2) 10 1
psysT (`1, `2, ETmiss) 12 2
psysT (`1, `2, ETmiss, j1, j2) 13
psysT (`1, j1) 13
σ(psysT ) (`1, `2, ETmiss, j1) 4 5
pT (j2) 8
∆pT (`1, `2) 8
∆pT ((`1, `2, j1), (ETmiss)) 9
∆pT (ETmiss, j1) 9
∆pT (`1, `2,ETmiss, j1) 16
∆pT (`2, j2) 14
∆R(`1, j1) 2 5
∆R(`2,j1) 4 10
∆R(`2,j2) 6
∆R(`2,j1) 11
∆R(`1,`2) 14
∆R((`1, `2),j2) 9
m(`2, j1) 10 3 3
m(`1, j2) 1 4
m(j1, j2) 2
m(`2, j2) 7 7
m(`1, j1) 8 6
m(`1, `2) 15
m(`2, j1, j2) 11
m(`1, `2, j1, j2) 15
mT(j1, ETmiss) 5
mT2 11
E/m(`1, `2, j2) 16
P
ET 3
Centrality(`1, `2) 6
Centrality(`1, j1) 12
[image:13.595.155.441.93.674.2]Centrality(`2, j2) 12
JHEP01(2016)064
) [GeV] 1 j , T miss ,E 2 l , 1 l ( T sys p0 20 40 60 80 100 120
Fraction of events / 10 GeV
0 0.05 0.1 0.15 0.2 0.25 0.3 Wt t t ATLASSimulation -1 = 8 TeV, 20.3 fb s
1-jet 1-tag
(a)
Events / 10 GeV
200 400 600 800 1000 1200 1400 1600 Data Wt t t Others Uncertainty ATLAS -1 = 8 TeV, 20.3 fb s 1-jet 1-tag ) [GeV] 1 j , T miss ,E 2 l , 1 l ( T sys p
0 20 40 60 80 100 120
Data/Pred. 0.81 1.2 (b) ) 1 j , 1 l R ( ∆
0.5 1 1.5 2 2.5 3 3.5 4
Fraction of events / 0.20
0 0.02 0.04 0.06 0.08 0.1 0.12 0.14 Wt t t ATLASSimulation -1 = 8 TeV, 20.3 fb s
1-jet 1-tag
(c)
Events / 0.20
100 200 300 400 500 600 Data Wt t t Others Uncertainty ATLAS -1 = 8 TeV, 20.3 fb s 1-jet 1-tag ) 1 j , 1 l R ( ∆
0.5 1 1.5 2 2.5 3 3.5 4
Data/Pred.
0.81 1.2
[image:14.595.99.501.91.421.2](d)
Figure 5. Distributions of the two most important BDT input variables for the 1-jet 1-tag region. The distributions are shown for (a, b) the pT of the system of the leptons, jet and ETmiss and (c,
d) the ∆Rbetween the leading lepton and the jet. Each contribution is normalised to unit area in (a, c) and to its expectation in (b, d). The hatched area represents the sum in quadrature of the statistical and systematic uncertainties. The last bin includes the overflow.
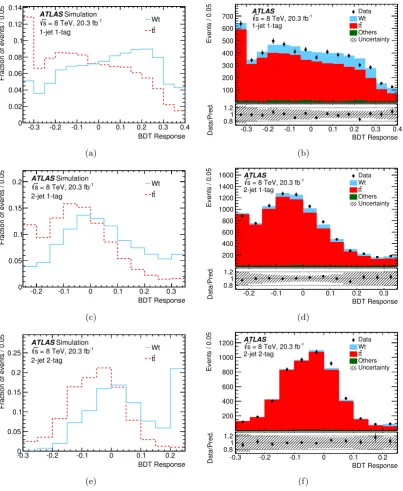
response values. The BDT range in each region is chosen to ensure sufficient simulation
statistics in each bin. The BDT separates the signal from the background in all three
regions, although even for high BDT response values in the 1-jet 1-tag region, there remains
a large expected background from
t
¯
t
events. The BDT responses from figure
7
are used in
the profile likelihood fit swith this binning.
6
Systematic uncertainties
Systematic uncertainties affect the acceptance estimates for the signal and background
processes. Some of the systematic uncertainties also affect the shape of the BDT response.
Experimental sources of uncertainty arise from the modelling of jets, leptons and
E
Tmiss.
JHEP01(2016)064
) [GeV] 2 j , 1 l m ( 50 100 150 200 250 300Fraction of events / 10 GeV
0 0.02 0.04 0.06 0.08 0.1 0.12 0.14 0.16 Wt t t ATLASSimulation -1
= 8 TeV, 20.3 fb s
2-jet 1-tag
(a)
Events / 10 GeV
200 400 600 800 1000 1200 Data Wt t t Others Uncertainty ATLAS -1 = 8 TeV, 20.3 fb s 2-jet 1-tag ) [GeV] 2 j , 1 l m (
50 100 150 200 250 300
Data/Pred. 0.81 1.2 (b) ) [GeV] 2 j , 1 j ( T sys p
0 50 100 150 200
Fraction of events / 10 GeV
0 0.02 0.04 0.06 0.08 0.1 0.12 0.14 Wt t t ATLASSimulation -1
= 8 TeV, 20.3 fb s
2-jet 2-tag
(c)
Events / 10 GeV
100 200 300 400 500 600 700 Data Wt t t Others Uncertainty ATLAS -1 = 8 TeV, 20.3 fb s 2-jet 2-tag ) [GeV] 2 j , 1 j ( T sys p
0 50 100 150 200
Data/Pred.
0.81
1.2
[image:15.595.101.499.91.416.2](d)
Figure 6. Distributions of the most important BDT input variables in the (a, b) 2-jet 1-tag and (c, d) 2-jet 2-tag regions. The distributions are shown for (a, b) the invariant mass of the system of the leading lepton and the second-leading jet and (c, d) the pT of the system of the two jets.
Each contribution is normalised to unit area in (a, c) and to its expectation in (b, d). The hatched area represents the sum in quadrature of the statistical and systematic uncertainties. The last bin includes the overflow.
to the modelling and the heavy-flavour correction, with an acceptance uncertainty for
W t
and
t
¯
t
events of 1-2%. The shape uncertainty is taken into account for the JES component
with the largest impact on the fit result (JES modelling component 1). The jet energy
resolution uncertainty is evaluated by smearing the energy of each jet in the simulation
and symmetrising the resulting change in acceptance and BDT response shape [
79
]. The
resulting acceptance uncertainty for
W t
and
t
¯
t
events is 1-3%, and the shape uncertainty
is taken into account.
The uncertainties in the modelling of the jet reconstruction and the jet vertex fraction
requirement are evaluated by randomly discarding jets according to the difference in jet
reconstruction efficiency between the data and MC simulation and by varying the the
jet vertex fraction requirement, respectively. These uncertainties have an impact on the
acceptance for
W t
and
t
t
¯
events of less than 1%. They do not change the shape of the
BDT response.
JHEP01(2016)064
BDT Response
-0.3 -0.2 -0.1 0 0.1 0.2 0.3 0.4
Fraction of events / 0.05
0 0.02 0.04 0.06 0.08 0.1 0.12 0.14 Wt t t ATLASSimulation -1 = 8 TeV, 20.3 fb s
1-jet 1-tag
(a)
Events / 0.05
100 200 300 400 500 600
700 DataWt
t t Others Uncertainty ATLAS -1
= 8 TeV, 20.3 fb s
1-jet 1-tag
BDT Response
-0.3 -0.2 -0.1 0 0.1 0.2 0.3 0.4
Data/Pred.
0.81
1.2
(b)
BDT Response
-0.2 -0.1 0 0.1 0.2 0.3
Fraction of events / 0.05
0 0.05 0.1 0.15 0.2 Wt t t ATLASSimulation -1
= 8 TeV, 20.3 fb s
2-jet 1-tag
(c)
Events / 0.05
200 400 600 800 1000 1200 1400 1600 Data Wt t t Others Uncertainty ATLAS -1
= 8 TeV, 20.3 fb s
2-jet 1-tag
BDT Response -0.2 -0.1 0 0.1 0.2 0.3
Data/Pred.
0.81 1.2
(d)
BDT Response
-0.3 -0.2 -0.1 0 0.1 0.2
Fraction of events / 0.05
0 0.05 0.1 0.15 0.2 0.25 Wt t t ATLASSimulation -1
= 8 TeV, 20.3 fb s
2-jet 2-tag
(e)
Events / 0.05
200 400 600 800 1000
1200 DataWt
t t Others Uncertainty ATLAS -1
= 8 TeV, 20.3 fb s
2-jet 2-tag
BDT Response -0.3 -0.2 -0.1 0 0.1 0.2
Data/Pred.
0.81 1.2
[image:16.595.100.504.90.582.2](f)
Figure 7. BDT response for (a, b) 1-jet 1-tag, (c, d) 2-jet 1-tag and (e, f) 2-jet 2-tag events. Each contribution is normalised to unit area in (a, c, e) and to its expectation in (b, d, f). The hatched area represents the sum in quadrature of the statistical and systematic uncertainties. The first bin includes the underflow and the last bin the overflow.
JHEP01(2016)064
Uncertainties in the modelling of the
b
-tagging efficiency and mis-tag rates are
esti-mated from data [
47
,
48
]. These uncertainties depend on the jet flavour and
p
T, and for
mis-tag rates also on jet
η
. The uncertainty for
b
-jets is evaluated in six components, with
the largest component having an acceptance uncertainty for
W t
and
t
¯
t
events of 1–4%,
depending on the analysis region [
48
]. The
b
-tag modelling uncertainties do not change the
shape of the BDT response.
The variations in lepton and jet energies are propagated to the
E
Tmissvalue. This
uncertainty has additional contributions from the modelling of the energy deposits which
are not associated with any reconstructed object [
49
]. Both an energy scale and an energy
resolution component are considered. The corresponding acceptance uncertainty for
W t
and
t
¯
t
events is less than 0.3%. The
E
Tmissscale component also alters the shape of the
BDT response.
Theoretical uncertainties are evaluated for the signal as well as the
t
t
¯
predictions.
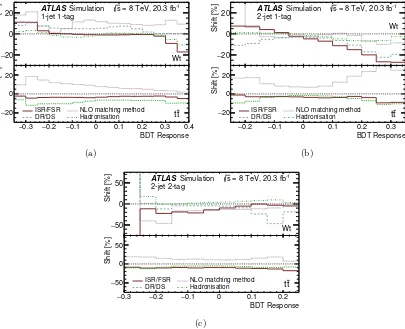
Figure
8
shows the relative shift of the BDT response associated with four of the theory
modelling uncertainties. The uncertainty on the
W t
signal and the
t
¯
t
background
asso-ciated with initial- and final-state radiation (ISR/FSR) is evaluated using
Powheg-Box
interfaced to
Pythia
. The renormalisation scale associated with the strong coupling
α
Sis varied up and down by a factor of two in the matrix-element calculation and a
Pythia
Perugia 2012 tune is used to create samples with increased and decreased levels of
radi-ation that are compatible with 7 TeV ATLAS data [
82
]. For
t
¯
t
, the
hdamp
parameter of
Powheg-Box
[
51
], which affects the amount of QCD radiation, is varied together with
ISR/FSR. This uncertainty is treated as uncorrelated between
W t
and
t
t
¯
events. Figure
8
shows that this uncertainty has a large effect on the acceptance and also alters the shape
of the BDT response.
The uncertainty associated with the NLO matching method is evaluated by comparing
Powheg-Box
with
MC@NLO
, both interfaced to
Herwig
. Figure
8
shows that this
uncertainty has a dependence on the shape of the BDT response. For
W t
production, the
largest impact of this uncertainty is to shift events between the 1-jet 1-tag and 2-jet 2-tag
regions. For
t
¯
t
events, the impact of this uncertainty is on the acceptance, where it is
11–12%. This uncertainty is treated as correlated between
W t
and
t
¯
t
events.
The uncertainty associated with the modelling of the hadronisation and parton shower
is evaluated by comparing samples where
Powheg-Box
is interfaced with
Pythia
to those
where it is interfaced with
Herwig
. This uncertainty alters the shape of the BDT response.
For the
W t
signal, the uncertainty associated with the scheme used to remove overlap
with
t
¯
t
is evaluated by comparing the two different schemes: the nominal sample, generated
with the DR scheme, is compared to a sample generated with the DS scheme. The relative
shift of the BDT response is shown in figure
8
. The relative shift of this uncertainty
is about 5% in the signal region for 1-jet 1-tag events, and grows to large values in the
background-dominated region for 2-jet events, where its evaluation is limited by simulation
statistics and the predicted event yield is very small. This uncertainty alters the shape of
the BDT response.
JHEP01(2016)064
0.3− −0.2 −0.1 0 0.1 0.2 0.3 0.4
Shift [%]
20 −
0
20 ATLASSimulation
-1
= 8 TeV, 20.3 fb s
1-jet 1-tag
Wt
BDT Response 0.3
− −0.2 −0.1 0 0.1 0.2 0.3 0.4
Shift [%] 20 − 0 20 t t
ISR/FSR NLO matching method DR/DS Hadronisation
(a)
0.2
− −0.1 0 0.1 0.2 0.3
Shift [%]
20
−
0
20 ATLASSimulation
-1 = 8 TeV, 20.3 fb s
2-jet 1-tag
Wt
BDT Response 0.2
− −0.1 0 0.1 0.2 0.3
Shift [%] 20 − 0 20 t t
ISR/FSR NLO matching method DR/DS Hadronisation
(b)
0.3
− −0.2 −0.1 0 0.1 0.2
Shift [%]
50
−
0
50 ATLASSimulation
-1 = 8 TeV, 20.3 fb s
2-jet 2-tag
Wt
BDT Response 0.3
− −0.2 −0.1 0 0.1 0.2
Shift [%] 50 − 0 50 t t ISR/FSR NLO matching method DR/DS Hadronisation
[image:18.595.97.502.90.419.2](c)
Figure 8. Relative shift of the BDT response associated with systematic variations of ISR/FSR, NLO matching method, DR/DS and hadronisation for (a) 1-jet 1-tag, (b) 2-jet 1-tag, and (c) 2-jet 2-tag events. DR refers to the diagram-removal scheme, DS to the diagram-subtraction scheme.
uncertainty on the acceptance for
W t
and
t
t
¯
events is evaluated in each of the three analysis
regions. The PDF uncertainty is considered correlated between
W t
and
t
t
¯
events, except
for
t
¯
t
1-jet events, for which it is considered to be uncorrelated. The PDF uncertainty
com-ponents that affect the
t
¯
t
acceptance in this region differ from the uncertainty components
that affect the
t
¯
t
acceptance in the other regions [
83
].
The normalisation of the
t
¯
t
background has an uncertainty of 6% [
65
,
66
]. The diboson
background process has an uncertainty of 30% for 1-jet events and 40% for 2-jet events [
84
],
which is treated as uncorrelated between different regions. The
Z
+jets and non-prompt or
fake-lepton backgrounds have normalisation uncertainties of 60% to account for possible
mismodelling of the jet multiplicity and the acceptance of these small backgrounds [
85
,
86
]. The
Z
+jets and non-prompt or fake-lepton normalisation uncertainties are treated as
uncorrelated between background sources and regions.
JHEP01(2016)064
of the background processes that are normalised to theory predictions. The statistical
uncertainty due to the finite size of the simulation samples is also taken into account.
7
Results
7.1
Measurement of the inclusive cross-section
A profile likelihood fit to the BDT classifier distributions is performed, using the RooStats
software [
88
,
89
], in order to determine the inclusive
W t
cross-section, utilising the 1-jet
1-tag, 2-jet 1-tag, and 2-jet 2-tag regions.
The inclusion of the 2-jet regions provides
additional signal sensitivity and also helps to constrain the
t
¯
t
background normalisation
and systematic uncertainties.
The binned likelihood function is constructed as the product of Poisson probability
terms over all bins considered in the analysis. This likelihood depends on the signal-strength
parameter
µ
, which is a multiplicative factor on the unconstrained
W t
yield prediction.
Nuisance parameters (denoted
θ
) are used to encode the effects of the various sources
of systematic uncertainty on the signal and background expectations.
These nuisance
parameters are implemented in the likelihood function with multiplicative Gaussian or
log-normal constraints with mean
θ
0and standard deviation ∆
θ
. The likelihood is then
maximised with respect to the full set of
µ
and
θ
parameters. The values of these parameters
after maximisation are referred to as ˆ
µ
, ˆ
θ
, and ∆ˆ
θ
.
The expected cross-section is obtained from a fit to the so-called Asimov dataset [
90
],
with the signal and all backgrounds scaled to their predicted sizes [
26
].
The
ex-pected measurement is ˆ
µ
exp=
1
.
00
+0−0..1718.
The observed result for the signal
strength is ˆ
µ
obs=
1
.
03
+0−0..1617, which corresponds to a measured cross-section of
23
.
0
±
1
.
3 (stat.)
−+33..25(syst.)
±
1
.
1 (lumi.) pb.
Including systematic uncertainties, the
ob-served (expected) significance of the signal compared to the background-only hypothesis is
7
.
7 (6
.
9) standard deviations, obtained using an asymptotic approximation [
90
].
The post-fit (pre-fit) effect of each individual systematic uncertainty on ˆ
µ
is calculated
by fixing the corresponding nuisance parameter at ˆ
θ
+ ∆ˆ
θ
(ˆ
θ
+ ∆
θ
), and performing
the fit again. The difference between the default and the modified ˆ
µ
, ∆ˆ
µ
, represents the
effect on ˆ
µ
of this particular uncertainty. The pull (( ˆ
θ
−
θ
0)
/
∆
θ
), and the pre-fit and
post-fit impacts for the nuisance parameters with the largest impact on ˆ
µ
are shown in
figure
9
. Since the total number of observed events in the 2-jet regions is about 14000,
with a
W t
signal fraction of about 6%, the nuisance parameters that have a
t
t
¯
acceptance
uncertainty of more than about 2% can be constrained in the fit. This applies to the
jet energy resolution and
t
t
¯
normalisation uncertainties, amongst others. The
E
Tmissscale
uncertainty has a shape dependence in the 1-jet 1-tag region for
W t
and
t
¯
t
, which results
in the corresponding nuisance parameter being shifted but not much constrained. The
theory modelling uncertainties due to ISR/FSR, DR/DS, and NLO matching method have
large pre-fit and post-fit impacts. The nuisance parameter for ISR/FSR
W t
is shifted
and constrained in the fit due to its BDT response shape dependence, shown in figure
8
.
This uncertainty has the largest impact on ˆ
µ
, both pre-fit and post-fit. The ISR/FSR
t
¯
t
JHEP01(2016)064
Pull
1
−
0
1
t Normalisation t
t ISR/FSR t NLO matching method
Pileup Electron identification DR/DS Luminosity JES modelling comp. 1 scale
miss T
E
Jet energy resolution ISR/FSR Wt
µ
∆
0.1
−
0
0.1
ATLAS
-1
= 8 TeV, 20.3 fb
s
θ
∆
)/
0
θ
-θ
Pull (
µ
pre-fit impact on
σ
1
±
µ
post-fit impact on
σ
[image:20.595.158.444.79.451.2]1
±
Figure 9. Effect on the uncertainty on the fitted value of the signal strength ˆµ (∆ˆµ) and pull of the dominant nuisance parameters, ordered by their impact on ˆµ. The shaded and hashed areas refer to the top axis: the shaded bands show the initial impact of that source of uncertainty on the precision of ˆµ; the hatched areas show the impact on the measurement of that source of uncertainty, after the profile likelihood fit, at the±1σlevel. The points and associated error bars show the pull of the nuisance parameters and their uncertainties and refer to the bottom axis. A mean of zero and a width of 1 would imply no constraint due to the profile likelihood fit. Only the 11 uncertainties with the largest impact on ˆµare shown.
shape dependence. In a test where the ISR/FSR uncertainty is considered to be correlated
between
W t
and
t
¯
t
events, the expected uncertainty on ˆ
µ
is reduced to
±
0
.
16. The nuisance
parameter for the NLO matching method uncertainty is constrained by the
t
¯
t
background
because of the large acceptance component and shape dependence of the NLO matching
method uncertainty.
uncer-JHEP01(2016)064
Uncertainty
Impact on ˆ
µ
[%]
Statistical
±
5
.
8
Luminosity
±
4
.
7
Theory modelling
ISR/FSR
+8−9..24Hadronisation
±
1
.
7
NLO matching method
±
2
.
5
±
0
.
6
DR/DS
+2−4..28Detector
Jet
+9−9..09Lepton
±
3
.
0
E
Tmiss±
5
.
5
b
-tag
±
1
.
0
Background norm.
+2−2..96 [image:21.595.187.409.82.330.2]Total
+16−17Table 4. Summary of the relative uncertainties on the W tcross-section measurement. Detector uncertainties are grouped into categories. All sources of uncertainty within a category are added in quadrature to obtain the category uncertainty.
tainties. The largest contributions to the cross-section uncertainty are from the modelling
of ISR/FSR and from the jet energy resolution and scale.
The BDT response for each region is shown normalised to the fit result in figure
10
.
The dependence of the cross-section on the top-quark mass is evaluated using
W t
and
t
¯
t
simulation samples with various top-quark masses. The cross-section depends linearly on
the top-quark mass due to changes in acceptance, with a slope of 1.11 pb/GeV.
7.2
Constraints on
|
fLVV
tb|
and
|
V
tb|
The inclusive cross-section measurement provides a direct determination of the magnitude
of the CKM matrix element
V
tb. The ratio of the measured cross-section to the theoreticalprediction is equal to
|
f
LVV
tb|
2, where the form factor
f
LVcould be modified by new physics
or radiative corrections through anomalous coupling contributions, for example those in
refs. [
3
,
91
,
92
]. The
W t
production and top-quark decays through
|
V
ts|
and
|
V
td|
are
assumed to be small. A lower limit on
|
V
tb|
is obtained for
f
LV= 1 as in the SM, without
assuming CKM unitarity [
5
,
93
]. An additional systematic uncertainty due to a variation
of the top-quark mass by 1 GeV is included in the
V
tbextraction. The uncertainties on the
theoretical cross-section due to the variation of the renormalisation and factorisation scale
(0.6 pb), the PDF uncertainty (1.4 pb), and the beam-energy uncertainty [
94
] (0.38 pb)
are also accounted for.
JHEP01(2016)064
Events / 0.05
100 200 300 400 500 600
700 DataWt
t t Others Uncertainty ATLAS -1
= 8 TeV, 20.3 fb s
1-jet 1-tag Post-fit
BDT Response 0.3
− −0.2 −0.1 0 0.1 0.2 0.3 0.4
Data/Pred.
0.81
1.2
(a)
Events / 0.05
200 400 600 800 1000 1200 1400 1600 Data Wt t t Others Uncertainty ATLAS -1
= 8 TeV, 20.3 fb s
2-jet 1-tag Post-fit
BDT Response 0.2
− −0.1 0 0.1 0.2 0.3
Data/Pred.
0.81 1.2
(b)
Events / 0.05
200 400 600 800 1000
1200 DataWt
t t Others Uncertainty ATLAS -1
= 8 TeV, 20.3 fb s
2-jet 2-tag Post-fit
BDT Response 0.3
− −0.2 −0.1 0 0.1 0.2
Data/Pred.
0.81 1.2
[image:22.595.95.500.89.420.2](c)
Figure 10. Distribution of the post-fit BDT response for (a) 1-jet 1-tag, (b) 2-jet 1-tag, and (c) 2-jet 2-tag events. The signal, backgrounds and uncertainties are scaled to the fit result. The first bin includes the underflow and the last bin the overflow.