High-accuracy determination of internal
circadian time from a single blood sample
Nicole Wittenbrink, … , Dieter Kunz, Achim Kramer
J Clin Invest.
2018;128(9):3826-3839. https://doi.org/10.1172/JCI120874.
Graphical abstract
Clinical Medicine
Genetics
Find the latest version:
Introduction
Many fundamental aspects of human physiology, metabolism, and behavior display 24-hour rhythms. These are found at all lev-els — from cells, tissues, and organs to the entire organism (for a
review see ref. 1). The master circadian clock resides in the hypo-thalamic suprachiasmatic nuclei and coordinates daily rhythms of sleep and wakefulness, core body temperature, and hormone secretion (such as cortisol, melatonin, and many others). The circadian clock is synchronized to Earth’s rotation primarily by light-dark cycles — a process called “entrainment.” In addition, virtually every cell of the body contains a circadian oscillator that contributes to the daily rhythmicity of a large variety of physio-logical and metabolic activities, including immune responses and xenobiotic detoxification as well as renal and cardiovascular functions. In fact, at least 40% of protein-coding genes show dai-ly rhythms in expression in a tissue-specific manner not ondai-ly in nocturnal rodents (2), but also in humans (3).
Given this ubiquity of daily rhythms, it is not surprising that the metabolism (pharmacokinetics) and effects (pharmacody-namics) of many, especially short-half-life, drugs change over the BACKGROUND. The circadian clock is a fundamental and pervasive biological program that coordinates 24-hour rhythms in
physiology, metabolism, and behavior, and it is essential to health. Whereas therapy adapted to time of day is increasingly reported to be highly successful, it needs to be personalized, since internal circadian time is different for each individual. In addition, internal time is not a stable trait, but is influenced by many factors, including genetic predisposition, age, sex, environmental light levels, and season. An easy and convenient diagnostic tool is currently missing.
METHODS. To establish a validated test, we followed a 3-stage biomarker development strategy: (a) using circadian transcriptomics of blood monocytes from 12 individuals in a constant routine protocol combined with machine learning approaches, we identified biomarkers for internal time; and these biomarkers (b) were migrated to a clinically relevant gene expression profiling platform (NanoString) and (c) were externally validated using an independent study with 28 early or late chronotypes.
RESULTS. We developed a highly accurate and simple assay (BodyTime) to estimate the internal circadian time in humans from a single blood sample. Our assay needs only a small set of blood-based transcript biomarkers and is as accurate as the current gold standard method, dim-light melatonin onset, at smaller monetary, time, and sample-number cost.
CONCLUSION. The BodyTime assay provides a new diagnostic tool for personalization of health care according to the patient’s circadian clock.
FUNDING. This study was supported by the Bundesministerium für Bildung und Forschung, Germany (FKZ: 13N13160 and 13N13162) and Intellux GmbH, Germany.
High-accuracy determination of internal circadian time
from a single blood sample
Nicole Wittenbrink,1,2 Bharath Ananthasubramaniam,1,3 Mirjam Münch,1,4,5 Barbara Koller,1 Bert Maier,1 Charlotte Weschke,1
Frederik Bes,4,5 Jan de Zeeuw,5,6 Claudia Nowozin,4,5 Amely Wahnschaffe,4,5 Sophia Wisniewski,4,5 Mandy Zaleska,6
Osnat Bartok,7 Reut Ashwal-Fluss,7 Hedwig Lammert,8 Hanspeter Herzel,3 Michael Hummel,8 Sebastian Kadener,7,9
Dieter Kunz,4,5,6 and Achim Kramer1
1Charité Universitätsmedizin Berlin, corporate member of Freie Universität Berlin, Humboldt-Universität zu Berlin, and Berlin Institute of Health, Laboratory of Chronobiology, Berlin, Germany. 2Humboldt-Universität zu Berlin, Department of Biology, Systems Immunology Lab, Berlin, Germany. 3Humboldt-Universität zu Berlin, Institute for Theoretical Biology, Berlin, Germany. 4
St-Hedwig-Krankenhaus, Clinic for Sleep and Chronomedicine, Berlin, Germany. 5Charité Universitätsmedizin Berlin, corporate member of Freie Universität Berlin, Humboldt-Universität zu Berlin, and Berlin Institute
of Health, Institute of Physiology, Group Sleep Research and Clinical Chronobiology, Berlin, Germany. 6Intellux Berlin GmbH, Berlin, Germany. 7The Hebrew University, Biological Chemistry Department,
Jerusalem, Israel. 8Charité Universitätsmedizin Berlin, corporate member of Freie Universität Berlin, Humboldt-Universität zu Berlin, and Berlin Institute of Health, Institute of Pathology, Berlin, Germany. 9Brandeis University, Department of Biology, Waltham, Massachusetts, USA.
Authorship note: NW, BA, and MM contributed equally to this work.
Conflict of interest: The study was supported by Intellux Berlin GmbH. JDZ and MZ are employees of Intellux GmbH. DK is shareholder of Intellux GmbH. Charité Universitäts-medizin Berlin has filed a patent application (EP17177735) relating to the BodyTime assay, in which AK, BA, and NW are listed as inventors; decision is pending.
Role of funding source: This study was supported by the Bundesministerium für Bildung und Forschung, Germany (FKZ: 13N13160 and 13N13162), and Intellux Berlin GmbH, Germany, which had no role in the design, conduct, analysis, or interpretation nor in the decision to publish the study.
Submitted: March 2, 2018; Accepted: June 20, 2018.
first searched the circadian transcriptome of blood monocytes for biomarkers using machine learning approaches. Next, we migrat-ed the biomarkers to a clinically relevant gene expression profil-ing platform and finally validated our assay usprofil-ing an indepen-dent study. Our BodyTime assay uses a small set of blood-based transcript biomarkers to compute internal time with an accuracy equaling that of the current gold standard method at a smaller monetary and time cost. Thus, the BodyTime assay is a precise new diagnostic tool allowing personalized therapeutic interven-tion adapted to the patient’s endogenous circadian phase. Such a tool has the potential to foster further development of chrono-medicine on a much larger scale.
Results
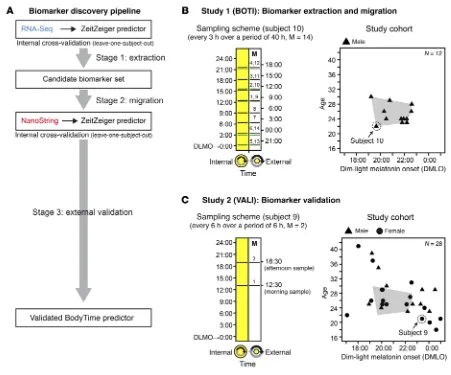
Strategy for BodyTime assay development. The goal of the present
study was to develop an objective and simple assay to determine internal circadian time in humans for both clinical and research use (BodyTime assay). Specifically, we aimed to accurately quan-tify the phase of entrainment (also called chronotype) of humans using multiplex gene expression profiling. To establish a validat-ed test, we followvalidat-ed a 3-stage biomarker development strategy (Figure 1A and ref. 23): (a) unbiased discovery of biomarkers, i.e., time-telling genes, using a large-content platform (RNA-Seq) (time-telling genes are likely to be identified among those genes whose expression is robustly time-of-day-dependent across many individuals with similar phase, amplitude, and expression level); (b) migration to a targeted gene expression profiling plat-form (RNA-Seq → NanoString); and (c) independent external biomarker/assay validation.
To this end, we conducted 2 independent studies with healthy volunteers: the BOTI (BOdy TIme) study (Figure 1B) to identify the time-telling genes (stages 1 and 2) and the VALI (VALIdation) study (Figure 1C) to test whether the final assay performs well on a clinically relevant platform with an independent subject cohort (stage 3). The design of these studies will be outlined in the respec-tive sections of Results. To assess the performance of the Body-Time assay, we compared it with the current gold standard for internal circadian time, the measurement of DLMO.
We chose to use peripheral blood monocytes as source mate-rial for gene expression profiling, because (a) blood is an easily accessible source of human cells and (b) monocytes constitute a homogenous blood cell population and have been shown to pos-sess a high-amplitude circadian clock (24, 25) in contrast to other PBMCs, such as B or T cells. For the final multiplex gene expres-sion profiling, we chose the NanoString Technologies nCounter platform, since it offers key advantages (sensitivity, reproducibili-ty, technical robustness, etc.) over more traditional methods such as microarrays and quantitative reverse transcription PCR (26). Moreover, NanoString-based diagnostic tests with FDA clearance are already on the market (27).
Stage 1: Extraction of biomarkers for internal time from human monocyte transcriptome time series data. The goal of stage 1 was to
extract a candidate set of time-telling genes from whole monocyte transcriptomic time series data from multiple individuals. That is, we sought a function that maps gene expression signatures to time. To this end, we conducted the BOTI study under controlled laboratory conditions using a narrow cohort design (12 exclusive-24 hours. A recent study has shown that approximately 50% of all
current drugs target the product of a circadian gene (3). Addition-ally, therapeutic outcomes such as survival after open-heart sur-gery (4), efficacy and tolerance of chemotherapy (5), wound heal-ing (6), antibody response to vaccination (7), or effectiveness of acetylsalicylic acid application for cardiovascular diseases (8) all vary across time of day.
Therefore, tailoring drug administration or other therapeutic interventions to optimal time of day (chronotherapeutics) aims to maximize efficacy and/or improve tolerance (9). However, one key barrier to widespread adoption of chronotherapeutics is that humans are heterogeneous with respect to timing of their internal clocks as well as to their behavior influencing synchronization of their clocks to the environmental light-dark cycle. In other words, humans have different “phases of entrainment” — a concept that underlies different “chronotypes” whose physiological and behav-ioral rhythms range from early (“morning larks”) to late (“night owls”), the majority being somewhere in between (10). Moreover, the phase of entrainment of humans is not a stable trait; it rath-er depends on many intrath-ernal and extrath-ernal factors. It has a genetic basis (11), is age- and sex-dependent (10), and depends on light exposure level (12, 13) and on the season (12, 14) as well as on the location within the time zone (10).
Therefore, any timed therapeutic intervention needs to be personalized. In other words, we need a simple diagnostic tool to read out objectively the internal time of an individual at a giv-en momgiv-ent. The presgiv-ent approaches to assess internal time are either based on questionnaires and therefore not objective (10, 15), or they are cumbersome and costly, requiring multiple mea-surements under controlled conditions. The current gold standard to assess circadian phase is to determine the time point when endogenous melatonin secreted from the pineal gland reach-es a predefined thrreach-eshold concentration in saliva or blood plas-ma — dim-light melatonin onset (DLMO) (16, 17). Because light suppresses melatonin secretion, sampling has to be carried out under controlled dim-light conditions. Moreover, the sampling rate (every 30–60 minutes over a period of 5–6 hours) makes the protocol inconvenient to be used in daily clinical routine. Hence, the current situation is suboptimal, which is unfortunate because there is an increasing need for internal circadian time assessment as reflected by inclusion of DLMO in the latest catalog of diagnos-tic criteria for circadian rhythm sleep disorders (18).
The estimation of internal circadian time from single or mul-tiple samples was pioneered by Ueda et al. (19). Their molecu-lar-timetable method was originally developed on mouse liver transcripts and later translated to humans by analysis of blood metabolites from 2 samples taken 12 hours apart (20). Subsequent studies applied machine learning approaches (ZeitZeiger and par-tial least squares) to circadian transcriptomes from human periph-eral blood mononuclear cells (PBMCs), which, however, did not result in a prediction accuracy similar to that of the current gold standard DLMO measurement (21, 22). In addition, the identified biomarkers were not validated in truly independent studies, and the measurement platforms were not adapted for clinical usage.
dance profiles (9,115 genes) from 10 subjects (Supplemental Table 2 and Supplemental Figure 1).
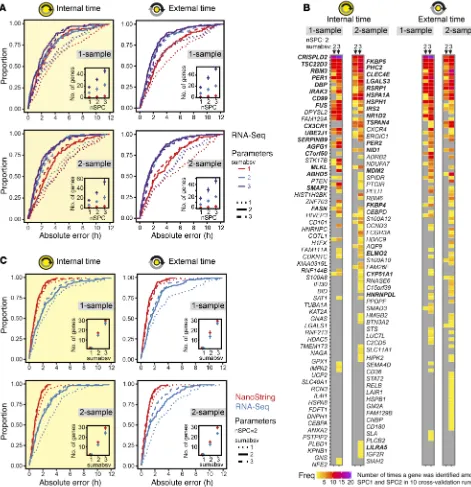
Among the various bioinformatics methods proposed to obtain predictors that map gene signatures to time, we applied ZeitZeiger (29) to the RNA-Seq data set, because ZeitZeiger achieves good prediction performance with fewer genes com-pared with other methods. We devised a 4-predictors approach, i.e., we tested 4 types of predictors that differ with respect to the predicted variable (external time or internal time) and the format of the RNA-Seq data input (1 sample or 2 samples 6 hours apart). The difference between the 2 formats is the mRNA abundance profile assigned to each measurement (Mi) in the time series (1-sample: single profile recorded at Mi; 2-sample: ratio of 2 pro-files recorded 6 hours apart, Mi/Mi+2). The idea of the 4-predictor approach is that genes with high and robust time-telling proper-ties should be less dependent on the type of predictor and thus should be frequently extracted by ZeitZeiger.
ly male subjects; mean age, 25.3 ± 2.6 years [± SD], range 22–30 years; mean DLMO, 21:17 ± 1:09, range 19:13–22:36) (Figure 1B and Supplemental Table 1; supplemental material available online with this article; https://doi.org/10.1172/JCI120874DS1). For each subject, 14 blood samples were taken at regular intervals of 3 hours over a period of 40 hours in a constant routine protocol (28) to minimize unwanted effects of sleep, activity, or meals on circadian gene expression. Subjects remained in a semi-recum-bent posture in bed under dim light and constant temperature and humidity during a period of 40 hours of sleep deprivation. They received isocaloric snacks every hour and water. Hourly sali-va samples were taken for determination of melatonin secretion profiles. Monocytes were sorted from whole blood, and resulting RNA was subjected to RNA-Seq. In addition to the external time of day, each sample was assigned an additional time stamp, which relates to the subject’s DLMO (internal time). After quality assess-ment, the final RNA-Seq time series included 136 mRNA
[image:4.585.62.513.52.427.2]1) are similar to those of the internal time predictors. Likewise, the 1-sample (MdAE = 1.4–1.6 hours, IQR = 1.8–2.0 hours) and 2-sam-ple methods (MdAE = 1.2–1.4 hours, IQR = 2.3–2.4 hours) perform comparably. The global gene sets of all predictors are shown in Figure 2B. The global gene set of a predictor aggregates all genes identified by ZeitZeiger for prediction (biomarkers) across the internal cross-validation runs. For reasons of comprehensibility, the composition of the global gene sets will be specified in the con-text of migration to the NanoString platform (stage 2).
Together, our results indicate that monocyte transcriptome time series data are well suited to extract time-telling genes with internal cross-validation performance similar to that of previous studies (21, 22). However, the MdAEs as well as the frequencies of predictions with an error ≥1 hour indicate that the accuracy of pre-dictions can still be improved, since for internal time it is below the accuracy established by the gold standard saliva melatonin radio-immunoassay that was used to determine DLMO in our study cohort (30 minutes to 1 hour; refs. 16, 17).
Stage 2: Platform migration — selection of a candidate biomark-er set for intbiomark-ernal time. Following the biomarkbiomark-er extraction process
and internal validation, the next stage aimed to adapt candidate biomarkers (time-telling genes) to a clinically applicable assay platform (Figure 1A). It is crucial which and how many time-telling genes are selected for migration to the NanoString platform. There-fore, we predefined the following selection criteria: (a) the final number of genes should be as small as possible, and (b) the genes selected for migration should have robust time-telling properties. Our selection of a candidate set of time-telling genes is based on the global gene sets of the best-performing predictors (Table 1 and Figure 2B). The global gene set of a predictor aggregates the genes extracted by ZeitZeiger for prediction across the internal cross-val-idation runs. In the case of leave-one-subject-out cross-valcross-val-idation, as performed here, the number of cross-validation runs equals the number of subjects (n = 10). Since our predictors use 2 SPCs for pre-diction, the maximal times a gene can be identified is N × nSPC = 20. Figure 2B summarizes the global gene sets of the best-perform-To evaluate the performance of the predictors, we followed a
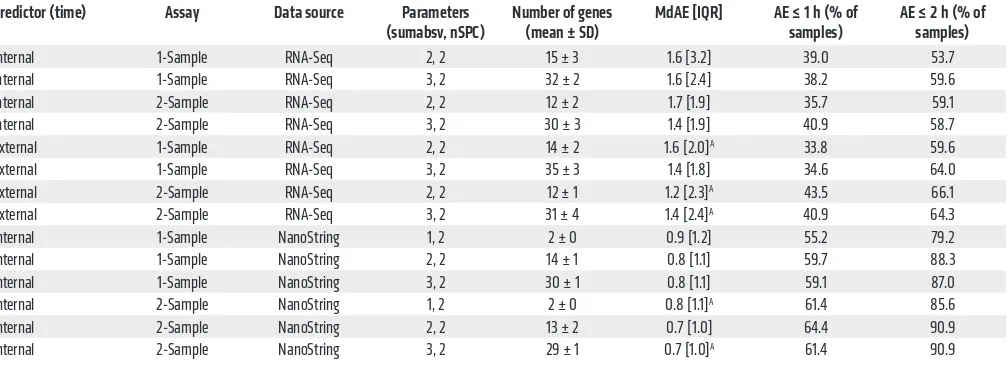
leave-one-subject-out cross-validation approach. To this end, the predictors were trained with data from all subjects except one, and internal/external times of the samples from this left-out subject were subsequently predicted. This was repeated for all subjects. Moreover, cross-validation was always done for 9 combinations of ZeitZeiger’s 2 main parameters sumabsv and nSPC. Briefly, sumabsv controls how many genes form each sparse principal component (SPC), and number of SPCs (nSPC) determines how many SPCs are used for prediction, i.e., the higher the sumabsv or nSPC, the more genes are needed for prediction. All 4 types of predictors performed comparably (Figure 2A and Table 1) in terms of optimal parameter combination (nSPC = 2, sumabsv = {2, 3}) and mean number of genes used for prediction (12–15 genes for sumabsv = {2} and 30–35 genes for sumabsv = {3}). As a mea-sure of accuracy, we use the median absolute difference between the predicted and the observed (internal or external time) time stamps and its interquartile range (IQR). Hereafter, for simplicity, we abbreviate median absolute difference as MdAE. The accura-cy achieved in predicting internal time is similar for the 1-sample (MdAE = 1.6 hours, IQR = 2.4–3.2 hours) and the 2-sample method (MdAE = 1.4–1.7 hours, IQR = 1.9 hours) (Figure 2A and Table 1); differences between the 2 methods are not statistically significant (Benjamini-Hochberg adjusted P value of pairwise Wilcoxon test > 0.05). With 53.7%–59.6% of the predictions showing an error of ≤2 hours, our predictors’ performances are comparable to those of previously published internal cross-validation predictors (21, 22). The MdAEs show no significant variation over the entire constant routine (Kruskal-Wallis test on 3-hour time bins, P > 0.05) for any of the predictors, indicating that the cumulative sleep deprivation experienced by the subjects does not affect prediction accuracy. Likewise, there is no statistically significant difference in terms of MdAE between samples obtained during day 1 (0–24 hours) and day 2 (24–40 hours) of the constant routine (Mann-Whitney U test,
P > 0.05). The accuracies of the external time of day predictors
[image:6.585.40.544.83.267.2](MdAE = 1.2–1.6 hours, IQR = 1.8–2.4 hours; Figure 2A and Table
Table 1. Best-performance internal cross-validation predictors built on the BOTI RNA-Seq or NanoString data sets
Predictor (time) Assay Data source Parameters
(sumabsv, nSPC) Number of genes (mean ± SD) MdAE [IQR] AE ≤ 1 h (% of samples) AE ≤ 2 h (% of samples)
Internal 1-Sample RNA-Seq 2, 2 15 ± 3 1.6 [3.2] 39.0 53.7 Internal 1-Sample RNA-Seq 3, 2 32 ± 2 1.6 [2.4] 38.2 59.6 Internal 2-Sample RNA-Seq 2, 2 12 ± 2 1.7 [1.9] 35.7 59.1 Internal 2-Sample RNA-Seq 3, 2 30 ± 3 1.4 [1.9] 40.9 58.7 External 1-Sample RNA-Seq 2, 2 14 ± 2 1.6 [2.0]A 33.8 59.6
External 1-Sample RNA-Seq 3, 2 35 ± 3 1.4 [1.8] 34.6 64.0 External 2-Sample RNA-Seq 2, 2 12 ± 1 1.2 [2.3]A 43.5 66.1
External 2-Sample RNA-Seq 3, 2 31 ± 4 1.4 [2.4]A 40.9 64.3
Internal 1-Sample NanoString 1, 2 2 ± 0 0.9 [1.2] 55.2 79.2 Internal 1-Sample NanoString 2, 2 14 ± 1 0.8 [1.1] 59.7 88.3 Internal 1-Sample NanoString 3, 2 30 ± 1 0.8 [1.1] 59.1 87.0 Internal 2-Sample NanoString 1, 2 2 ± 0 0.8 [1.1]A 61.4 85.6
Internal 2-Sample NanoString 2, 2 13 ± 2 0.7 [1.0] 64.4 90.9 Internal 2-Sample NanoString 3, 2 29 ± 1 0.7 [1.0]A 61.4 90.9
ing predictors in terms of which genes were identified and how often. A total of 119 genes were extracted at least once across all predictors. Gene ontology functional enrichment analysis revealed that they are significantly associated (P < 10–5) with biological processes related to the immune system (e.g., immune response, defense response, cell activation; for a full list see Supplemental Table 3). Furthermore, 4 genes have previously been related to the circadian clock (DBP, NR1D2, PER1, and PER2) (1).
Of the 119 genes, 34 were selected as candidates for migration to the NanoString platform because they were frequently identi-fied during cross-validation of the individual predictors and across predictors: ABHD5, AGFG1, C7orf50, CD99, CLEC4E, CRISPLD2,
CX3CR1, CYP51A1, DBP, ELMO2, FASN, FKBP4, FKBP5, FUS, HNRNPDL, HSPA1A, HSPH1, IRAK3, IRS2, LGALS3, LILRA5, MLKL, NID1, NR1D2, PER1, PER2, PHC2, RBM3, RSRP1, SER-PINB9, SMAP2, TSC22D3, TSPAN4, and UBE2J1. Because of the
size of the candidate set, we opted for a 48-plex configuration for the NanoString assay. In addition to the 34 candidate genes, we
chose to further include 4 housekeeping genes (GAPDH, HPRT1,
PPIA, and PSMB2), 3 clock (or clock-associated) genes that were
not part of the RNA-Seq data set because of low expression (KLF9,
NR1D1, and PER3), and 2 clock genes that were not identified in
the biomarker extraction process (CRY1 and CRY2), as well as 5 genes that showed high frequencies of detection when the RNA-Seq data set was still incomplete (CPED1, DHRS9, HGSNAT,
ODC1, and PLAC-8).
To assess the impact of migration of our candidate set to the NanoString platform on prediction accuracy, we performed plat-form comparison. To this end, gene expression profiles using the 48-plex NanoString gene set were acquired for all blood monocyte RNA preparations obtained during the BOTI study (Supplemental Table 4). Afterward, internal cross-validation predictors for both the RNA-Seq and the NanoString data sets were built using those genes shared by both assays (n = 41) and all samples that passed quality control for both assays (n = 136). We again followed the 4-predictor leave-one-subject-out approach. Predictor
[image:7.585.54.532.53.438.2]mances are shown in Figure 2C; predictor performance measures are summarized in Supplemental Table 5. Most strikingly, all pre-dictors’ performances significantly increase after migration to the NanoString platform (internal time 1-sample: P < 0.0008; inter-nal time 2-sample: P < 0.005; exterinter-nal time 1-sample: P < 0.0001; external time 2-sample: P < 0.03; Benjamini-Hochberg adjusted P value of pairwise Wilcoxon test). The MdAEs improved by about 1 hour ranging between 0.6 and 0.9 hours for the different predic-tors. Moreover, the spread of MdAEs narrowed by about a factor of 2, now reaching values in the range of 1 hour. Consequently, the frequencies of predictions with an error ≤1 hour or ≤2 hours increased up to >50% and >70%, respectively. Of particular note is that the NanoString predictors performed equally well for dif-ferent values of sumabsv; that is, a predictor using just 2 genes for prediction achieved the same accuracy as a predictor using ≥12
genes. Spearman’s correlation and Bland-Altman analyses further revealed that, in terms of prediction error, there was no relevant bias between the 2 platforms (ρ ≤ 0.33, Supplemental Figure 2; Bland-Altman mean difference: –0.2 to 0.5 hours, Supplemental Figure 3). Taken together, the migration of our candidate set to the NanoString platform was not only successful, but in fact signifi-cantly improved its performance.
[image:8.585.40.396.51.536.2]After migration of the candidate set of time-telling genes to the NanoString platform, we sought to establish and validate a final assay to assess internal circadian time. By means of internal cross-validation (leave-one-subject-out approach), we first iden-tified the optimal parameter values for ZeitZeiger-based predic-tion of internal time in the NanoString data set of the BOTI study. This analysis differed slightly from the one performed for plat-form comparison, in that here all genes (n = 44) and all samples
and Supplemental Table 6). In addition, in contrast to the BOTI study, in which we chose a controlled laboratory setting (constant routine), now we decided on a setting that better reflected real-life conditions: subjects of the VALI study were allowed to sleep, to eat meals, and to be exposed to light at their habitual times. Most importantly, however, all subjects were classified as extreme or moderate early or late chronotypes (based on questionnaires; see Methods) before inclusion in the study to characterize the predic-tion range of the BodyTime assay with respect to chronotype.
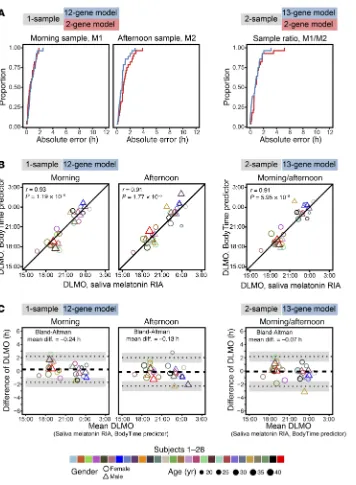
For each subject, 2 blood samples were taken (in the morning and 6 hours later in the afternoon), monocytes were sorted, and mRNA abundance profiles against the 48-plex NanoString gene set were acquired (Supplemental Table 4). To assess and com-pare the prediction of internal time by the 4 BodyTime predic-tors trained on the BOTI study data set, we applied them to the mRNA abundance profiles acquired during the independent VALI study (Figure 1C) (note that external time prediction is not mean-ingful for extreme chronotypes since their individual DLMOs are spread over ~9 hours; Supplemental Table 6). The 1-sample 2-gene and 12-gene BodyTime predictors applied to the VALI study morning samples achieved the best prediction accuracy of internal time (Figure 4A and Table 2). With MdAEs of 0.54 hours (IQR = 0.82 hours) or 0.69 hours (IQR = 0.87 hours) and 100% or 96.3% of samples showing an error of ≤2 hours, both predictors performed as well as they can, considering that the error of the gold standard reference method (DLMO determined from saliva melatonin concentrations measured by radioimmunoassay) itself lies between 0.5 and 1 hours (16, 17). The agreement of our Body-Time predictors with the current gold standard is further empha-sized by the high (circular Pearson r ≥ 0.9) and significant (P < 0.0001) correlation of DLMO estimated by our predictors with DLMO determined from saliva melatonin concentrations (Fig-ure 4B). Moreover, Bland-Altman analyses showed that there is no systematic difference between the 2 methods (Bland-Altman mean difference: –1.02 to 0.24 hours; Figure 4C and Supplemen-tal Figure 6). Application of the 1-sample BodyTime predictors to the afternoon samples resulted in a small but statistically insig-nificant loss of accuracy in terms of MdAE (2-gene: 0.99 hours; 12-gene: 0.80 hours). Likewise, the accuracies of the two 2-sam-ple predictors (2-gene: 0.75 hours; 13-gene: 0.74 hours) were somewhat better than those of the 1-sample predictors, with the difference not being statistically significant. Furthermore, the accuracy of prediction does not depend on the phase of entrain-ment (Suppleentrain-mental Figure 7).
that passed quality control were considered (n = 154 in 11 subjects) and not only those that are also present in the RNA-Seq data set. Regarding accuracy and optimal parameters (nSPC = 2, sumabsv = {1, 2}), the results of the final 1-sample and 2-sample assays’ inter-nal validation were essentially identical to those described above for platform comparison (for a detailed view on performance mea-sures and a description of the global gene sets, see Table 1 and Sup-plemental Figure 4, respectively).
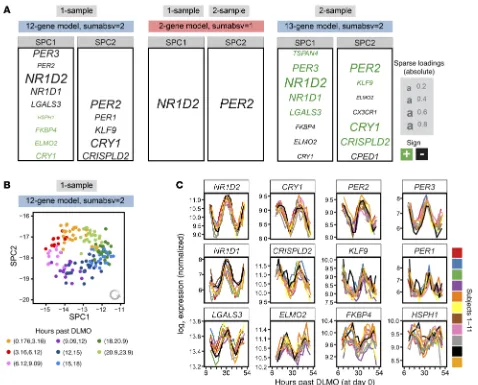
Using the identified optimal parameter combinations, we next trained 2 final internal time predictors on all samples in the 1-sam-ple and 2-sam1-sam-ple NanoString data set of the BOTI study (Figure 3A). Both the 1-sample and the 2-sample predictor trained with sumabsv = 1 are formed by just 2 genes (NR1D2 and PER2). The pre-dictors trained with sumabsv = 2 comprise 12 genes (SPC1: NR1D2,
PER3, NR1D1, LGALS3, PER2, ELMO2, FKBP4, HSPH1, CRY1;
SPC2: CRY1, PER2, CRISPLD2, KLF9, PER1) and 13 genes (SPC1:
NR1D2, PER3, NR1D1, LGALS3, TSPAN4, FKBP4, ELMO2, CRY1;
SPC2: CRY1, PER2, CRISPLD2, CPED1, CX3CR1, KLF9, ELMO2,
PER3), respectively. More importantly, the 1-sample and 2-sample
predictors show a strong overlap in terms of genes that form SPC1 and SPC2, emphasizing the high time-telling capacity of these very small sets of genes. In line with this, the expression levels of the identified genes show consistent circadian oscillations in each subject of the BOTI study (Figure 3C). Interestingly, the graphi-cal illustration of the course of SPC1 and SPC2 over internal time resembles a clock (12-gene 1-sample predictor, Figure 3B; for the other predictors, see Supplemental Figure 5, B–D). When plotted in the 2-dimensional SPC space, the BOTI study’s samples describe a virtually perfect circle with the progression of internal time follow-ing an anti-clockwise trajectory. Such behavior is observed for each individual subject (Supplemental Figure 5A) and might form the basis for future personalized approaches to detect perturbations of the circadian clock in humans. Taken together, we established not 1 but 4 final BodyTime predictors that all show comparably high accuracy and use a very small set of genes.
Stage 3: External validation of the final BodyTime assay in an independent study. Predictors often perform better on data they
[image:9.585.40.553.83.189.2]were built on than on independent samples (30). Therefore, it is essential to validate them externally before implementation for clinical or research use. We thus sought to validate the final Body-Time predictors in an independent study (VALI study). In contrast to the BOTI study, the VALI study used a broad cohort design (11 male plus 17 female subjects; mean age 26.9 ± 5.7 years, range 18–41 years; mean DLMO, 21:04 ± 2:08, range 16:42–00:28) (Figure 1C
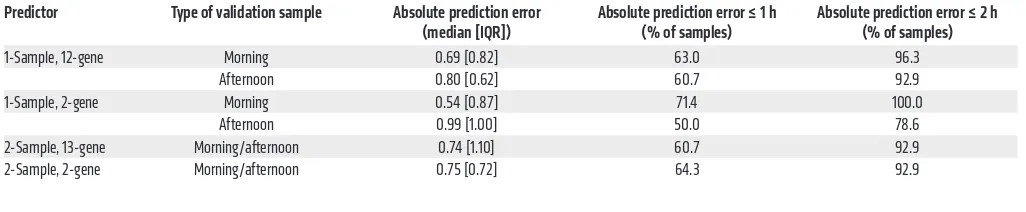
Table 2. External validation of the BodyTime predictors in the independent VALI study
Predictor Type of validation sample Absolute prediction error
(median [IQR]) Absolute prediction error ≤ 1 h (% of samples) Absolute prediction error ≤ 2 h (% of samples)
1-Sample, 12-gene Morning 0.69 [0.82] 63.0 96.3
Afternoon 0.80 [0.62] 60.7 92.9
1-Sample, 2-gene Morning 0.54 [0.87] 71.4 100.0
Afternoon 0.99 [1.00] 50.0 78.6
to our success in establishing the BodyTime assay is difficult to assess, because previous attempts (while being PBMC-based) did not go beyond stage 1 of the biomarker development pipeline (21, 22). That is, direct comparison cannot be made. However, some observations during initial biomarker extraction suggest that the choice of monocytes had a favorable impact on the performance of the assay: (a) independent of the predicted variable (internal or external time) and the data input format (1-sample or 2-sample), we observed a strong overlap in the genes extracted by ZeitZeiger (Figure 3A); and (b) compared with other PBMC-based internal cross-validation approaches with similar performance, our predic-tors need a much smaller set of genes (12–15 vs. ~100) (22). We believe that these observations reflect a combination of reduced cellular noise of monocytes in terms of gene expression compared with PBMCs and an improved clinically proven gene expression measurement platform (NanoString), leaving the possibility that our final assay would perform just as well on PBMCs.
The accuracy of the BodyTime assay is the same for all chronotypes (Supplemental Figure 7), even the extreme ones as revealed in our external validation study. It is thus not affected by where the sleep period of a person is located during the 24-hour window of a day as long as sleep occurs at the person’s normal time (i.e., similar phase angle with respect to the melatonin rhythm and assuming no internal desynchronization). Archer et al. (31) pre-viously showed that when sleep was scheduled out of circadian phase (i.e., out of phase with the melatonin secretion rhythm), the blood transcriptome was affected such that the expression of cir-cadian genes may become arrhythmic or low-amplitude. That is, a predictor including such genes may fail for individuals sleeping out of phase, such as shift workers, with or without internal desyn-chronization. However, when the information provided by Archer et al. was compared with our BodyTime predictors, the majority of genes were unaffected when the subjects slept out of phase (31). Moreover, the accuracy of our internal cross-validation pre-dictors was not affected by the cumulative sleep loss experienced by the subjects enrolled in the BOTI study. We therefore assume that the BodyTime assay should be able to reliably assess internal time even in the case of circadian rhythm disorders or circadian misalignment that may occur during shift work. Whether Body-Time works similarly well in patients or cohorts with known low-er circadian amplitudes (e.g., the eldlow-erly, shift worklow-ers) and/or in the presence of internal circadian desynchronization remains to be elucidated. It is important to note that neither BodyTime nor DLMO determined from saliva melatonin concentrations reports the circadian phase of the suprachiasmatic nuclei (SCN); rather, BodyTime estimates DLMO, and the classical method uses mel-atonin profiles of saliva samples to determine the time of onset of melatonin secretion from the pineal gland. Onset of melatonin secretion is a characteristic of circadian rhythms in the pineal gland, although in clinical circadian and sleep research it serves as the gold standard proxy for SCN phase.
Among the BodyTime predictors were several core clock genes or genes associated with the circadian clock, which is in contrast to biomarker sets previously suggested based on analysis of data acquired on high-content discovery platforms such as microarrays (21, 22). Since the BodyTime predictors are small in size (2 to 15 genes), we cannot deduce any further biological meaning. How-We succeeded in establishing, to our knowledge, the first
externally validated assay that estimates internal circadian time from a single sample. Hallmarks of this BodyTime assay are its high accuracy, its robustness, and its low complexity in that it requires expression profiling of just a handful of genes. Most importantly, it provides a much more convenient alternative to the current gold standard multisample methods.
Discussion
Following a 3-stage biomarker development strategy, we estab-lished and validated a novel assay (BodyTime) for assessing internal circadian time using monocyte NanoString-based gene expression profiles. Our BodyTime assay achieves accuracy (MdAE = 0.54–0.69 hours) similar to that of the current gold stan-dard, DLMO (error: 0.5–1 hour; refs. 16, 17), while eliminating its shortcomings. It requires only 1 blood sample taken at any time during the day, and there is no need for a dim-light environment during sampling. Moreover, it depends on just a handful of genes (≤12) and is of low complexity and thus low cost (<$100 per test). In its current form, our assay is readily usable in a research or clin-ical context, since the requirements regarding equipment (MACS sorting device) and staff are easily met. If not available in house, NanoString gene expression analysis can be outsourced to one of many external service providers. In Supplemental Table 7, we pro-vide an Excel-based tool where users can paste their expression values from NanoString to get an estimate of their DLMO based on our 12-gene 1-sample BodyTime predictor.
What, in our opinion, distinguishes our approach from all pre-vious attempts (21, 22) to establish an assay for internal time is that we focused on biomarker development strategy and decision mak-ing instead of bioinformatics tool development. While bioinfor-matics is certainly crucial for biomarker discovery, our approach demonstrates that, on its own, it is not sufficient. In fact, the suc-cess of our BodyTime predictors can be attributed in large part to the decision to migrate the assay to the NanoString platform. Just the migration increased the accuracy of our predictors significant-ly. We used ZeitZeiger to identify the time-telling genes for use in our multiplex assay for internal time. ZeitZeiger has the advan-tage that it performs both model construction for internal time estimation and feature extraction to find the best multiplex for use in the assay. Other established methods (molecular time table, ref. 19; and partial least squares, ref. 22) use theoretically sub-optimal approaches to find the best combination of time-telling genes. We used the maximum likelihood scheme (described in ref. 29) to estimate internal time from a subject sample. However, oth-er machine learning methods (LASSO and partial least squares) resulted in very similar internal time estimation performanc-es (Supplemental Figure 8 and Supplemental Table 8), further emphasizing that biomarker discovery and the analysis platform (NanoString) rather than a bioinformatics approach had a greater influence on the success of our approach.
pletion of a urinary drug screen (möLab GmbH), participants were prepared for the polysomnographically recorded adaptation night in the laboratory. Habitual sleep and wake times were determined by centering an 8-hour sleep episode to the averaged times of mid-sleep obtained at home, during the 7 days preceding the study. On day 2, participants stayed in their room (illuminance ~500 lx in a vertical direction). In the evening of day 2, i.e., 6 hours before habitual bed-time, participants remained in dim light (<5 lx). Salivary samples were obtained for hormonal analyses every hour. Participants were then again prepared for polysomnographic recordings for the base-line night. After wake time on day 3 (in dim light), the CR protocol in bed and in dim light began. An indwelling catheter was inserted in a peripheral vein of the left or right forearm. An isotonic electro-lyte infusion (1,000 ml Ringer’s lactate per 24 hours) with 10,000 IU heparin per 24 hours was continuously applied via an automatic infusion pump system. The following 40 hours, participants stayed awake in a semi-recumbent position in bed. They produced a salivary sample every hour, and every 3 hours, a blood sample (8 ml each) was drawn via indwelling catheter by a trained assistant. For this purpose, the indwelling catheter was flushed with 10 ml saline solution (0.9% NaCl), and the first 5 ml of the first drawn blood/saline mix were voided. During the entire CR protocol, an assistant was present and constant wakefulness and compliance with the protocol was verified. During the CR, participants were allowed to read (no light-emitting devices, no cell phones), play an instrument, or engage in conversa-tion with the assistant. Wake EEG and performance data obtained during the CR will be reported elsewhere. After the 40 hours of extended wakefulness, the 8-hour recovery sleep episode started, and the CR protocol ended on the next morning (day 5) after wake time. Blood platelet concentrations were regularly controlled (at least 3 times, according to local regulations) in order to prevent a hepa-rin-induced thrombocytopenia. Before, during, and after the study, venous hemoglobin concentrations were measured in order to moni-tor changes in blood volume concentrations.
Participants. Twelve healthy men (mean age 25.3 ± 2.6 years, range
22–30 years; Supplemental Table 1) without any medical, psychiatric, or sleep disorder were included in the study. Before their first visit, participants completed 5 questionnaires: an entrance questionnaire, the Munich Chronotype Questionnaire (MCTQ), the Horne-Östberg Morningness-Eveningness Questionnaire (HO), the Pittsburgh Sleep Quality Index (PSQI), and the Seasonal Pattern Assessment Question-naire (SPAQ). The mean scores, SDs, and ranges are shown in Supple-mental Table 1. Participants also underwent a physical examination, and completed the Ishihara color plates for normal color vision and a polysomnographically recorded adaptation night in the sleep laborato-ry. All participants were healthy, were nonsmokers, had no recent his-tory of drug abuse, and were not extreme morning or evening chrono-types. The questionnaires had to be within a normal range (as reported in the literature) for each participant. Exclusion criteria for the study were travels across more than 1 time zone within the last 3 months and/or shift work during the last 8 weeks before the study.
Study 2 (VALI): study design, protocol, and participants
Study design and protocol. The validation study with extreme morning
and evening types was conducted between February and April 2017 and consisted of 3 ambulatory visits on the same day. During the first visit, a venous blood sample (8 ml) was taken from a peripheral arm
ever, although they did not make it into the final BodyTime pre-dictors, we identified many time-telling candidate genes that are associated with biological processes related to the immune sys-tem. This is in line with the previously suggested biomarker sets for internal time and hints at modulation of immune processes by the circadian clock (32).
Our assay provides a simple yet effective tool for chronotyping individuals from a single blood sample. This assay should there-fore become a useful tool, for example, during drug development to assess whether the effectiveness and side effects of a drug are influenced by the administration schedule. Beyond that, it opens up the opportunity to investigate the dynamics of the internal cir-cadian phase in response to environmental changes and interven-tions (in large study cohorts), e.g., shift work, jet lag, season (pho-toperiod), light level, and daylight savings time, as well as with age. In addition, the BodyTime predictor genes may have the diagnostic potential to assess molecular perturbations of the circadian system. When plotted in the SPC space defined by the BodyTime predictor genes, the time series data of the BOTI study describe a circle with the progression of internal time following an anti-clockwise tra-jectory (Figure 3B). Hughey et al. have previously reported a sim-ilar behavior for a predictor of external time of day in mice (29). Importantly, they were able to show that genetic perturbations of the clock result in characteristic changes in relation to the circular trajectory, such as axis shifts (muscle Bmal1–/–) and shrinking of the radius (liver Nr1d1–/– Nr1d2–/–). If this is also true for humans, the cir-cular trajectory of our BodyTime predictors may provide the basis for the establishment of diagnostic tests.
In summary, our BodyTime assay is a new precision medicine tool that allows the personalization of diagnostics and therapy according to an individual’s circadian phase — an under-recog-nized yet important physiological parameter. BodyTime is simple (it requires only a single blood sample taken anytime during the day) and highly accurate (as good as the current gold standard) and therefore should foster the spread of chronomedicine.
Methods
Study 1 (BOTI): study design, protocol, and participants
Study design. The 4-day laboratory study was conducted between May
2015 and January 2016 and consisted of an adaptation and a baseline night in the sleep laboratory, followed by a 40-hour episode of sleep deprivation and an 8-hour recovery sleep episode. The entire protocol was carried out under constant routine (CR) conditions (<5 lx, con-stant room temperature, semi-recumbent posture in bed, regularly small isocaloric snacks and water, and no time cues; ref. 28). Contin-uous polysomnographic recordings and core body temperature mea-surements started before the first baseline night. During the CR part, salivary samples for hormone analyses were collected hourly, and blood samples via indwelling catheter were obtained every 3 hours.
Study protocol. Participants had to keep a regular sleep-wake cycle
com-the 2–standard deviation (2-SD) method (for study 1) and com-the thresh-old method (for study 2). For the 2-SD method, DLMO was defined as the time when melatonin concentrations exceeded 2 SDs of 3 low daytime concentrations. The threshold method defined DLMO as the time when melatonin concentrations exceeded 10 pg/ml (study 1) or 3 pg/ml (study 2; due to higher sensitivity of the antibody used for the RIA [Bühlmann Laboratories]). For both methods, the “hockey-stick” software developed by Danilenko et al. was used (16). Both methods led to similar timing for DLMO. By visual inspection of the melatonin profiles of study 2, some melatonin concentrations in between 2 sam-ples were very high and were considered as outliers, which might have happened due to remaining small food particles in between 2 samples. These high values were linearly interpolated before DLMO assess-ment, which was done for a total of 14 values out of 336 (4.17%). For the same reason, 4 measurements (at the beginning of the study) were omitted (1.20%). Intra- and interassay coefficients of variability are given in Supplemental Table 9.
Blood collection, monocyte sorting, and RNA preparation
Eight milliliters of EDTA whole blood taken every 3 hours in the BOTI study and twice (6 hours apart) in the VALI study was
imme-diately processed. CD14+ blood monocytes were collected by MACS
sort using whole-blood CD14 microbeads (Miltenyi Bio tec) and the Auto-MACS-Pro device. All steps were performed at 4°C according to the manufacturer’s instructions. Median purity of monocyte prepara-tions (BOTI study) was 89% as revealed by analytical FACS sorting
(CD11b+CD15– fraction; CD11b: 558123, BD Biosciences;
anti-CD15: 560828, BD Biosciences). The CD14+ cell fraction was pelleted
by centrifugation and frozen at –80°C. After completion of the entire time series, total RNA was isolated using TRIzol reagent (Thermo Fisher Scientific). Quality and quantity of isolated RNA were analyzed using the NanoDrop 2000c (Thermo Fisher Scientific) and the Qubit RNA BR Assay Kit (Thermo Fisher Scientific).
RNA library preparation
Total RNA was treated with DNase I (New England Biolabs) following the manufacturer’s protocol. Preparation of stranded, ligation-based, digital gene expression RNA libraries was modified from Shishkin et al. (34) as follows: 400 ng of total RNA was fragmented in FastAP buffer (Thermo Fisher Scientific) for 3 minutes at 94°C, dephosphor-ylated with FastAP, cleaned (using SPRI beads, Agencourt), and then ligated to linker1 (5Phos/AXXXXXXXXAGATCGGAAGAGCGTC-GTGTAG/3ddC/; XXXXXXXX is an internal barcode specific for each sample), using T4 RNA ligase I (New England Biolabs). Ligated RNA was cleaned, and 16 samples of each subject were pooled together
into a single tube using RNA Clean & Concentrator columns (Zymo
Research). The pooled RNA was then PolyA-selected (using oligo-dT beads, Invitrogen) according to the manufacturer’s protocol. Reverse
transcription was performed for the pooled, PolyA+ samples, with
a specific primer (5′-CCTACACGACGCTCTTCC-3′) using
Affini-tyScript Multiple Temperature cDNA Synthesis Kit (Agilent Tech-nologies). Then, RNA-DNA hybrids were degraded by incubation of the reverse transcriptase mixture with 10% 1 M NaOH at 70°C for 12 minutes. pH was then normalized by addition of a corresponding amount of 0.5 M AcOH. The reaction mixture was cleaned up using Silane beads (Dynabeads MyOne, Life Technologies), and a second
ligation was performed, in which the 3′ end of the cDNA was ligated to
vein at the laboratory for Medical Immunology at Charité Universitäts-medizin Berlin (Germany). The blood sample was drawn approximate-ly 2 hours after habitual wake time and was immediateapproximate-ly processed. The participants then left the laboratory and returned after 6 hours for the second blood sample (8 ml). Finally, the participants came to the sleep laboratory 6 hours before their habitual bed time for assessment of circadian phase by means of DLMO. For this purpose, participants remained in constant sitting position in dim light (<5 lx) for 6 hours and provided a salivary sample every 30 minutes. They received small snacks and water and were allowed to read or to engage in conversa-tion with other participants and the assistant. Twenty minutes before each salivary sample, participants were instructed to stop drinking/ eating and to rinse their mouth with water. After the last sample, par-ticipants left the laboratory. As already in the first study, parpar-ticipants had to keep a regular sleep-wake cycle 7 days before the study day, with self-selected target bed and wake times, and an approximately 8-hour sleep episode. Compliance was verified by activity watches (Motion Watch 8, CamNtech) and sleep diaries. The procedures for salivary samples were the same as in the first study, except that the sampling interval was 30 minutes for the validation study.
Participants. Extreme morning and evening types (“larks” and
“owls”) were recruited via flyers at schools and universities in the area of Berlin and Potsdam. Out of 172 returned questionnaires (MCTQ, HO, PSQI, SPAQ, and entrance questionnaire), only participants who met the initial criteria for morning or evening types, based on the MCTQ and on HO scores, were invited for the screening visit. They had to have an MCTQ score (MSF-sc, i.e., local time of mid-sleep on free days corrected for sleep debt accumulated over the workweek) below 3 (i.e., extreme morning type) or higher than 6 (extreme eve-ning type), and to be at least a moderate moreve-ning or moderate eveeve-ning type in the HO questionnaire (HO score 59–69 or 31–41, respective-ly). Or conversely, participants had to be an extreme morning (>69) or extreme evening type (<31) based on the HO score, and at least a moderate chronotype in the MCTQ score (i.e., <4 for morning types, or >5 for evening types). We also accepted 2 moderate morning types with an MCTQ score between 3 and 4 and an HO score between 59 and 69 as study participants. Two participants were extreme morning types only in either the HO (score 77) or the MCTQ (score 6.47). Exclu-sion criteria were medical or psychiatric disorders, recent drug abuse, PSQI scores higher than 10, recent shift work, and travels across more than 1 time zone within the last 2 months. A total of 14 morning (12 extreme and 2 moderate) and 14 evening types (Supplemental Table 6) completed the study. A sample size of 28 was targeted based on the
power calculation for a power of 0.8 with an α level of 0.05 and a large
effect size of 0.5.
Melatonin and cortisol measurement and DLMO determination
Salivary samples were obtained with Salivettes (Sarstedt AG & Co.)
Establishment and evaluation of internal time predictors using ZeitZeiger
To build and evaluate predictors of time based on monocyte tran-scriptomics data, we applied the supervised learning method Zeit-Zeiger developed and described by Hughey et al. (29) using the statistics environment R (40). The R package of ZeitZeiger can be downloaded from https://github.com/jakejh/zeitzeiger. ZeitZeiger extracts a time-telling gene set by means of supervised sparse prin-cipal component analysis. The sparsity of a gene set, i.e., the num-ber of genes it includes, is controlled by the parameter sumabsv. The smaller the value of sumabsv, the higher the sparsity, i.e., the fewer genes. To predict the time stamp of a test observation, Zeit-Zeiger applies maximum-likelihood estimation in which the number of genes involved in prediction is controlled by the number of sparse principal components (nSPC). During both the biomarker extraction and the platform migration process, we trained and evaluated Zeit-Zeiger predictors based on the BOTI study time series data sets (RNA-Seq or NanoString) following a leave-one-subject-out inter-nal cross-validation strategy. The latter provides a well-established and convenient solution to assess a predictor’s performance within a single data set. For each subject, a predictor is trained on all the other subjects and subsequently used to predict the time stamps of the left-out subject’s samples. To identify the optimal parameters for training of a predictor, internal cross-validation was performed for a range of values of sumabsv = {1, 2, 3} and nSPC = {1, 2, 3}. In the external validation process, we trained ZeitZeiger predictors on the complete BOTI NanoString time series data and subsequently used them to predict the time stamps of the samples included in the VALI study. For calculation of prediction errors, we used the calc-TimeDiff function for periodic variables provided by the ZeitZeiger R package; calcTimeDiff makes the error as close to zero as possible (for details, see ref. 29). To assess and compare the performance of ZeitZeiger predictors, we calculated the median absolute difference (MdAE) between the predicted and the observed time stamps and its interquartile range (IQR). ZeitZeiger predictors were trained for 2 different formats of data input, referred to as 1-sample and 2-sample format. The difference between the 2 formats is the mRNA
abun-dance profile assigned to each measurement (Mi) in the time series
(1-sample: single profile recorded at Mi; 2-sample: ratio of 2 profiles
recorded 6 hours apart, Mi/Mi+2).
Excel-based prediction tool
For platform migration and assay validation using NanoString, we normalized all data (from BOTI and VALI studies) together as pre-viously described. However, a sample-by-sample normalization is necessary to make predictions based on newly obtained blood samples profiled by NanoString. We developed such a scheme by replacing the first and last steps outlined previously by a combina-tion of 2 scale factors (computed only from BOTI data) and arith-metic mean of positive spike-in controls (of the new sample) and the geometric mean of the housekeepers (in the new sample only). We subsequently verified this scheme by confirming that predic-tion performance on the sample-by-sample normalized VALI data was unchanged (Supplemental Table 12). Once a new sample is thus normalized, a simple look-up table allows the prediction of the internal time of the sample that we implement as an Excel-based tool (Supplemental Table 7).
linker2 (5Phos/AGATCGGAAGAGCACACGTCTG/3ddC/) using T4 RNA ligase I. The sequences of linker1 and linker2 are partially com-plementary to the standard Illumina read1 and read2 barcode adapt-ers, respectively. Reaction mixture was cleaned up (Silane beads), and PCR enrichment was set up using enrichment primers 1 and 2
(5′
-AATGATACGGCGACCACCGAGATCTACACTCTTTCCCTA-CACGACGCTCTTCCGATCT-3′, 5′
-CAAGCAGAAGACGGCATAC-GAGATXXXXXXXXGTGACTGGAGTTCAGAC).
3′-End RNA-Seq screen
The libraries were 3′-end-sequenced (35) using Illumina NextSeq 500
and the results obtained in fastq format. After quality control using RSeqQC (36), technical replicates for the same sample were
com-bined. 3′-End reads were aligned to the human genome (hg19) using
STAR (37) with the following settings: --outFilterMultimapNmax 1 --clip3pNbases N (where N was chosen between 0 and 8 if there was a loss of quality at the end of reads), and saved as.bam files. Expres-sion counts of high-quality reads for each gene were then extracted from the.bam files using the End Sequence Analysis tool (ESAT; version 1) (38) with the following command: java -jar -Xmx20g esat. v1.jar -annotations (hg19 RefSeq annotation) -wExt 2000 -quality 20. We retained only genes with at least 2.5 counts per million in at least half the number of samples of each subject. The resulting count table was normalized for library size and composition using the trimmed mean of M-values (default method in the edgeR package; ref. 39) and
log2-transformed using the cpm function in edgeR to obtain the whole
transcriptome RNA-Seq time series data (in log2 counts per million).
Raw data have been deposited in the NCBI’s Sequence Read Archive (SRA; SRP133635). The alignment statistics of the RNA-Seq are pro-vided in Supplemental Table 10.
Rhythmicity analysis
Rhythmicity analysis was performed (Supplemental Figure 1) on the raw count data obtained from the ESAT tool (see previous section). The count data were analyzed using the limma-voom R package, which accounts for the dependence of noise in the read counts on the mean gene expression. We assess rhythmicity by fitting cosine curves with a 24-hour period with respect to external time to the count data. After FDR correction using Benjamini-Hochberg, genes were called circadian if their adjusted P value was below 0.05. This analysis was repeated for each subject independently.
NanoString 48-plex data acquisition
A 48-plex NanoString panel was designed comprising 44 candi-date time-telling genes and 4 control housekeeping genes (GAPDH,
HPRT1, PPIA, PSMB2). The custom-designed probes included a 3′-end
biotinylated capture probe and a 5′-fluorescence-barcoded reporter
probe for each gene target (Supplemental Table 11). Hybridization of the probes and 250 ng monocyte RNA was carried out according to the manufacturer’s instructions. Raw expression data were obtained using a NanoString nCounter Digital Analyzer (NanoString Technologies). Normalization was carried out in 3 steps according to the Bioconduc-tor package NanostringQCPro: (a) normalization by the arithmetic mean of the positive spike-in controls, (b) subtraction of the mean of the negative controls, and (c) normalization by the geometric mean of the 4 housekeeping genes. For all further downstream analyses, data
day 2 (24 to 40 hours) of the sampling period. Differences between predictors in terms of accuracy (MdAE) were assessed by pairwise Wilcoxon tests with P values being corrected for multiple comparison according to Benjamini-Hochberg (42). Bland-Altman and circular Pearson correlation analyses were performed to evaluate the level of agreement in terms of prediction accuracy between both different platforms (RNA-Seq, NanoString) and different assays (saliva mel-atonin profiles, BodyTime assay). For Bland-Altman analyses, the R package BlandAltmanLeh was used. For circular Pearson correlation analysis, the R package circStats was used. P values lower than 0.05 were considered as statistically significant. All statistical analyses were performed in the statistics environment R (40).
Study approval
The 2 studies were conducted according to the tenets of the Declara-tion of Helsinki and were approved by the ethics committee of Charité Universitätsmedizin Berlin, Germany. All study participants provided oral and written informed consent.
Author contributions
AK, HH, DK, SK, MM, and MH designed the research study. MM, BK, BM, CW, FB, JDZ, CN, AW, SW, MZ, OB, RAF, and HL per-formed experiments and collected data. NW and BA planned and carried out simulations. NW, BA, MM, RAF, SK, DK, and AK ana-lyzed and interpreted the data. NW and AK drafted the article. BA, MM, BK, BM, AW, SW, JDZ, SK, and HH critically revised the arti-cle. All authors approved the final version of the artiarti-cle.
Acknowledgments
We thank Katharina Grohme, Carolin Schäfer, and Christiane Hirn for medical screenings of the participants and Anna Wirz-Justice for critical reading of the manuscript. The study was supported by the Bundesministerium für Bildung und Forschung, Germany (FKZ: 13N13160 and 13N13162) and Intellux GmbH, Berlin, Germany.
Address correspondence to: Achim Kramer, Charité Universi-tätsmedizin Berlin, Laboratory of Chronobiology, Charitéplatz 1, 10117 Berlin, Germany. Phone: 49.30.450.524263; Email: achim. kramer@charite.de.
Functional enrichment analysis
Gene ontology (GO) analysis of the 119 selected time-telling genes (biomarkers) was carried out using the topGO package in R within the biological process (BP) categorization of the genes with P less than 0.01, and annotated within the org.Hs.eg.db database in Bioconductor. We used a custom (monocyte-specific) background gene set for the analysis consisting of the 9,115 genes identified as expressed across all subjects in our RNA-Seq analysis.
Prediction using LASSO and partial least squares regression
Similar to the ZeitZeiger-based predictors, prediction models were constructed using least absolute shrinkage and selection operator (LASSO) and partial least squares regression (PLS) in order to test the relative performance of different machine learning algorithms (41). Both approaches found linear predictors (of time in our case) based on the features (genes). The use of either approach required trans-forming time (the predicted quantity) to a pair of predicted variables
[cos(2πt/24), sin(2πt/24)], like in ref. 22. The predicted time was
finally obtained by inference of time from the 2 predicted compo-nents using the arctan function. For the 2-sample assay, we predicted
the difference of the log2-normalized data at the 2 time points (that
is, the ratio of the data before log2 normalization), as this is a more
optimal approach with PLS and LASSO. To find the optimal LASSO model, we used the glmnet R package under the “mgaussian” family. Similarly, for the PLS model we used the pls R package with standard settings. Both internal cross-validation using leave-one-subject-out cross-validation of the BOTI NanoString data, and predicted DLMO for the VALI data, were computed by selection of optimal models using cross-validation with the “one-sigma” selection criteria (avail-able in the packages). The analysis thus closely parallels the ZeitZei-ger-based analysis of the NanoString data.
Statistics
The subjects included in the BOTI study experienced cumulative sleep deprivation over the sampling period of 40 hours. To assess whether the accuracy (MdAE) of ZeitZeiger predictors showed variation across sampling time, a Kruskal-Wallis test on 3-hour time bins was per-formed. In addition, a Mann-Whitney U test was performed to test for differences between samples obtained during day 1 (0 to 24 hours) and
1. Yang G, Paschos G, Curtis AM, Musiek ES, McLoughlin SC, FitzGerald GA. Knitting up the raveled sleave of care. Sci Transl Med. 2013;5(212):212rv3.
2. Zhang R, Lahens NF, Ballance HI, Hughes ME, Hogenesch JB. A circadian gene expression atlas in mammals: implications for biology and medicine. Proc Natl Acad Sci U S A. 2014;111(45):16219–16224. 3. Anafi RC, Francey LJ, Hogenesch JB, Kim J.
CYCLOPS reveals human transcriptional rhythms in health and disease. Proc Natl Acad Sci U S A. 2017;114(20):5312–5317.
4. Montaigne D, et al. Daytime variation of perioper-ative myocardial injury in cardiac surgery and its prevention by Rev-Erbα antagonism: a single- centre propensity-matched cohort study and a ran-domised study. Lancet. 2018;391(10115):59–69. 5. Dallmann R, Okyar A, Lévi F. Dosing-time makes
the poison: circadian regulation and
pharmaco-therapy. Trends Mol Med. 2016;22(5):430–445. 6. Hoyle NP, et al. Circadian actin dynamics drive
rhythmic fibroblast mobilization during wound healing. Sci Transl Med. 2017;9(415):eaal2774. 7. Long JE, Drayson MT, Taylor AE, Toellner KM,
Lord JM, Phillips AC. Morning vaccination enhances antibody response over afternoon vaccination: a cluster-randomised trial. Vaccine. 2016;34(24):2679–2685.
8. Bonten TN, et al. Effect of aspirin intake at bed-time versus on awakening on circadian rhythm of platelet reactivity. A randomised cross-over trial. Thromb Haemost. 2014;112(6):1209–1218. 9. Ballesta A, Innominato PF, Dallmann R, Rand
DA, Lévi FA. Systems chronotherapeutics. Phar-macol Rev. 2017;69(2):161–199.
10. Roenneberg T, et al. Epidemiology of the human circadian clock. Sleep Med Rev. 2007;11(6):429–438. 11. Hsu PK, Ptáček LJ, Fu YH. Genetics of human
sleep behavioral phenotypes. Meth Enzymol. 2015;552:309–324.
12. Stothard ER, et al. Circadian entrainment to the natural light-dark cycle across seasons and the weekend. Curr Biol. 2017;27(4):508–513. 13. Wright KP, McHill AW, Birks BR, Griffin BR,
Rus-terholz T, Chinoy ED. Entrainment of the human circadian clock to the natural light-dark cycle. Curr Biol. 2013;23(16):1554–1558.
14. Allebrandt KV, et al. Chronotype and sleep duration: the influence of season of assessment. Chronobiol Int. 2014;31(5):731–740.
15. Horne JA, Ostberg O. A self-assessment question-naire to determine morningness-eveningness in human circadian rhythms. Int J Chronobiol. 1976;4(2):97–110.
mela-tonin onset (DLMO) in humans. Chronobiol Int. 2014;31(3):349–355.
17. Klerman EB, Gershengorn HB, Duffy JF, Kronau-er RE. Comparisons of the variability of three markers of the human circadian pacemaker. J Biol Rhythms. 2002;17(2):181–193.
18. American Academy of Sleep Medicine, eds. The International Classification of Sleep Disorders – Third Edition (ICSD-3). Darien, Illinois, USA: American Academy of Sleep Medicine; 2014. 19. Ueda HR, et al. Molecular-timetable methods
for detection of body time and rhythm dis-orders from single-time-point genome-wide expression profiles. Proc Natl Acad Sci U S A. 2004;101(31):11227–11232.
20. Kasukawa T, et al. Human blood metabolite time-table indicates internal body time. Proc Natl Acad Sci U S A. 2012;109(37):15036–15041.
21. Hughey JJ. Machine learning identifies a compact gene set for monitoring the circadian clock in human blood. Genome Med. 2017;9(1):19. 22. Laing EE, Möller-Levet CS, Poh N, Santhi N,
Archer SN, Dijk DJ. Blood transcriptome based biomarkers for human circadian phase. Elife. 2017;6:e20214.
23. Goossens N, Nakagawa S, Sun X, Hoshida Y. Can-cer biomarker discovery and validation. Transl Cancer Res. 2015;4(3):256–269.
24. Keller M, et al. A circadian clock in macrophages controls inflammatory immune responses. Proc Natl Acad Sci U S A. 2009;106(50):21407–21412.
25. Spies CM, et al. Circadian rhythms of cellular immunity in rheumatoid arthritis: a hypothesis- generating study. Clin Exp Rheumatol. 2015;33(1):34–43.
26. Veldman-Jones MH, et al. Evaluating robustness and sensitivity of the NanoString technologies nCounter platform to enable multiplexed gene expression analysis of clinical samples. Cancer Res. 2015;75(13):2587–2593.
27. Wallden B, et al. Development and verification of the PAM50-based Prosigna breast cancer gene signature assay. BMC Med Genomics. 2015;8:54. 28. Minors DS, Waterhouse JM. The use of constant
routines in unmasking the endogenous compo-nent of human circadian rhythms. Chronobiol Int. 1984;1(3):205–216.
29. Hughey JJ, Hastie T, Butte AJ. ZeitZeiger: supervised learning for high-dimensional data from an oscillatory system. Nucleic Acids Res. 2016;44(8):e80.
30. Bleeker SE, et al. External validation is necessary in prediction research: a clinical example. J Clin Epidemiol. 2003;56(9):826–832.
31. Archer SN, et al. Mistimed sleep disrupts circadi-an regulation of the humcircadi-an trcircadi-anscriptome. Proc Natl Acad Sci U S A. 2014;111(6):E682–E691. 32. Scheiermann C, Kunisaki Y, Frenette PS.
Circadi-an control of the immune system. Nat Rev Immu-nol. 2013;13(3):190–198.
33. Benloucif S, et al. Measuring melatonin in humans. J Clin Sleep Med. 2008;4(1):66–69.
34. Shishkin AA, et al. Simultaneous generation of many RNA-seq libraries in a single reaction. Nat Methods. 2015;12(4):323–325.
35. Afik S, et al. Defining the 5′ and 3′ landscape of the Drosophila transcriptome with Exo-seq and RNaseH-seq. Nucleic Acids Res. 2017;45(11):e95. 36. Wang L, Wang S, Li W. RSeQC: quality
con-trol of RNA-seq experiments. Bioinformatics. 2012;28(16):2184–2185.
37. Dobin A, et al. STAR: ultrafast universal RNA-seq aligner. Bioinformatics. 2013;29(1):15–21. 38. Derr A, et al. End Sequence Analysis Toolkit
(ESAT) expands the extractable information from single-cell RNA-seq data. Genome Res. 2016;26(10):1397–1410.
39. Robinson MD, McCarthy DJ, Smyth GK. edgeR: a Bioconductor package for differential expression analysis of digital gene expression data. Bioinfor-matics. 2010;26(1):139–140.
40. R Core Team. R: a language and environment for statistical computing. R Foundation for Statistical Computing, Vienna, Austria. http:// www.R-project.org/. Accessed June 29, 2018. 41. Hastie T, Tibshirani R, Friedman JH, eds. The Elements of Statistical Learning: Data Mining, Inference, and Prediction. 2nd ed. New York, New York, USA: Springer; 2001.