warwick.ac.uk/lib-publications
Original citation:
Horita, Flávio E.A., Albuquerque, Joao Porto de, Marchezini, Victor and Mendiondo, Eduardo
M.. (2017) Bridging the gap between decision-making and emerging big data sources : an
application of a model-based framework to disaster management in Brazil. Decision Support
Systems.
Permanent WRAP URL:
http://wrap.warwick.ac.uk/87147
Copyright and reuse:
The Warwick Research Archive Portal (WRAP) makes this work of researchers of the
University of Warwick available open access under the following conditions.
This article is made available under the Attribution-NonCommercial-NoDerivatives 4.0 (CC
BY-NC-ND 4.0) license and may be reused according to the conditions of the license. For
more details see:
http://creativecommons.org/licenses/by-nc-nd/4.0/
A note on versions:
The version presented in WRAP is the published version, or, version of record, and may be
cited as it appears here.
Decision Support Systems xxx (2017) xxx–xxx
ARTICLE IN PRESS
DECSUP-12815; No of Pages 11
Contents lists available atScienceDirect
Decision Support Systems
j o u r n a l h o m e p a g e : w w w . e l s e v i e r . c o m / l o c a t e / d s s
Bridging the gap between decision-making and emerging big data
sources: An application of a model-based framework to disaster
management in Brazil
Flávio E.A. Horita
a,*
, João Porto de Albuquerque
a,b,e, Victor Marchezini
d, Eduardo M. Mendiondo
c,d aInstitute of Mathematics and Computer Science, University of São Paulo, ICMC-USP, São Carlos, BrazilbCentre for Interdisciplinary Methodologies, University of Warwick, Coventry, United Kingdom cSão Carlos School of Engineering, University of São Paulo, EESC-USP, São Carlos, Brazil
dBrazilian National Center of Monitoring and Early Warning of Natural Disasters, Ministry of Science, Techn., Innovation, & Communication, Cemaden-MCTIC, São José dos Campos,
SP, Brazil
eGI Science Group, Department of Geography, Heidelberg University, Germany
A R T I C L E I N F O
Article history:
Received 11 August 2016
Received in revised form 22 February 2017 Accepted 6 March 2017
Available online xxxx
Keywords:
Business process model and notation Decision model and notation Big data sources
Design science research Case study
Disaster management
A B S T R A C T
With the emergence of big data and new data sources, a challenge posed to today’s organizations con-sists of identifying how to align their decision-making and organizational processes to data that could help them make better-informed decisions. This paper presents a study in the context of disaster management in Brazil that applies oDMN+, a framework that connects decision-making with data sources through an extended modeling notation and a modeling process. The study results revealed that the framework is an effective approach for improving the understanding of how to leverage big data in the organization’s decision-making.
© 2017 The Authors. Published by Elsevier B.V. This is an open access article under the CC BY-NC-ND license (http://creativecommons.org/licenses/by-nc-nd/4.0/).
1. Introduction
With the widespread adoption of smartphones, social media platforms, and wearable technologies, there has been not only an increase in the amount of available data but also a proliferation of new data sources. All of these “big data” have the potential to trans-form the entire business process[10,35], as well as to provide greater support for decision-making in different contexts, such as business management and marketing [16,36]. However, a remaining chal-lenge lies on how to align decision-making within the organization with the data sources, e.g., how to determine, which data sources could provide useful information for assessing market trends? The reason for this challenge is that despite the fact that the available data could be of great value in supporting decision-making, they often fail to reach the decision-makers in a suitable way[34]. As a result, decision-makers are supplied with useless information that
*Corresponding author.
E-mail address:[email protected](F.E. Horita).
still requires extended knowledge or experience for further data processing. This also makes it difficult to predict the impact that a change of data availability may have on specific tasks, since it is virtually impossible to find out if and where there is a lack of information.
In light of this challenge, this paper proposes the following research question: “How can the decision-makers’ tasks be con-nected to emerging big data sources?”. In order to investigate this question in a practical scenario, we perform a study based on the context of disaster management in the Brazilian National Center for Monitoring and Early Warning of Natural Disasters (Cemaden) (http://www.cemaden.gov.br). Cemaden has the mandate of moni-toring disasters across the entirety of Brazil’s continental territory with 8.5 million km2. This is thus a notable scenario of
decision-making within a “big data” context, since Cemaden must cope with datasets characterized by volume, velocity, variety and veracity. It must process a considerablevolumeof data, since it monitors around 1000 municipalities with recurrent disaster problems using more than 4750 rainfall gauges, about of 550 humidity and rainfall sensors, 9 weather radars, and almost 300 hydrological stations. Data from
http://dx.doi.org/10.1016/j.dss.2017.03.001
2 F. Horita et al. / Decision Support Systems xxx (2017) xxx–xxx
ARTICLE IN PRESS
these sources have differentvelocities, such as near real-time (in-situ sensors with a reading in each 5 min), every 12 h(weather radars), and unsystematic (semi-automated rainfall gauges). Furthermore, they are provided in avarietyof formats such as numerical obser-vations, satellite images, and unstructured text. Furthermore, this different sources are disconnected and prone to errors of different types (e.g., sensor errors) and inconsistencies, requiring the anal-ysis of theirveracity. Additionally, the monitoring natural hazards is a scenario characterized by frequent changes in the information requirements (e.g., new sensors may become available, or existing sources are rendered ineffective), organizational complexity (e.g., it involves several organizational roles, decisions and activities) and tight time pressure — decisions made may have significant conse-quences to mitigate material and human losses. In summary, these features amount to a highly relevant case for the study of the challenges and opportunities for integrating big data sources into decision-making.
The existing standards and notations from business modeling (i.e., BPMN and DMN) could potentially be used in this context. However, these fail to clearly represent the connection between the information required to make a decision and the data sources. To address this need, we have supplemented the existing standards and notations (i.e., BPMN and DMN) by conducting a design sci-ence research to develop and evaluate the oDMN+Framework for
connecting decision-making to useful data sources. Based on the lessons learned from the case study within Cemaden, this frame-work extends our previous frame-work[13]– which has presented the observation-aware Decision Model and Notation (oDMN) – with the aim of improving the knowledge basis and thus supporting the generalization.
Therefore, this article makes the following key contributions:
• Case study: Lessons were learned from a case study carried out in the Cemaden, which is a notable scenario of decision-making within a “big data” context.
• Extended model and notation: The oDMN of Horita et al.[13]is extended here by simplifying the notation and using a layer-based structure that makes it easier to understand all the elements. The extended model is now called oDMN+which is
an improved generalization based on the lessons learned from the case study.
• Modeling process: The modeling process is proposed to system-atically employ the oDMN+for the case study. This fills a gap
both in the modeling practice and in literature, which is lacking clear procedures and guidelines about how to model the con-ceptual elements of decision-making (e.g., activities) within a specific application context.
This paper is structured as follows.Section 2outlines the related literature while Section 3 describes the research methodology employed in this research that forms the basis of the oDMN+
Frame-work set out inSection 4.Section 5describes the case study used for evaluating the framework andSection 6discusses the lessons learned from this case study and contributions achieved in this research. Finally,Section 7summarizes our conclusions and makes recommendations for future work.
2. Literature review
2.1. Connection of decision-making with data sources
Although the use of data for supporting decision-making might be regarded as an established area in the literature, it has attracted further attention in the past few years due to the growing inter-est in data science, and thus more research has been carried out in this area[7]. Another group of studies seeks to analyze the use
of different data sources (e.g., the external data server and sensors) to support decision-making in different scenarios[10,32,35]. Within this group, Vera-Baquero et al.[33]outlined an architecture for inte-grating data from different organizations, which included a data server for improving the analysis of business performance manage-ment. Social media messages have also been employed to support organizational tasks like marketing trends[18,19], or disaster man-agement[34]. For instance, Mandviwalla and Watson[20]described an organization as a mix of capitals (human, economic, social, sym-bolic, and organizational), which is generated through a social media strategy. Moreover, Kleindienst et al.[15]integrated social media analytics and the business goals of an organization by breaking down these goals into critical success factors that make it possible to find out the information requirements. Although these works addressed an important issue, they failed to provide a method for establishing a connection with the information needed for the decision-making, as well as for providing a representative model that describes this connection.
2.2. Modeling the connection of decision-making with data sources
Business processes can be defined as “a chain of functionally connected activities using information and communication tech-nologies, which lead to a closed outcome providing a measurable benefit for a customer”[22]. The Business Process Model and Nota-tion (BPMN) is a standard model and notaNota-tion that defines a set of conceptual elements for modeling these processes. BPMN has been applied in different areas, such as customer services[28]and busi-ness management[8]. Sackmann et al.[27]proposed an extension to BPMN for including elements to represent place-related infor-mation, such as water hydrants or ambulances. Although process modeling notations are valuable to represent organizational activ-ities that involve decision-making, they do not include an explicit consideration of the decisions involved.
Decision Model and Notation (DMN) overcomes this gap by pro-viding conceptual features (e.g., business rules and required infor-mation) for modeling decisions, and thus establishing a relationship between business processes and decision-making[23]. Some first examples of studies that have employed DMN can be found in the literature[2,14]. DMN and related studies are certainly an impor-tant step for providing a further understanding of decision-making in organizations. However, it does not take into account the kind of data sources that could provide the modeled information requirements to support decision-making. This problem can be partially solved by resorting to the Observations and Measurements (O&M) standard. In short, O&M provides an abstract view of observations that orig-inate from various data sources, as well as being able to integrate the data sources to the requirements of the information[24]. The use of BPMN, DMN and O&M presents a relevant alternative for con-necting the business process of an organization to data sources, as showed in our previous work[13]. However, they do not describe a process for obtaining information about conceptual elements from decision-makers of the application context.
2.3. Systematic modeling of the connection of decision-making with data sources
The process used for eliciting the conceptual elements from decision-makers and generating model diagrams of their business processes play an essential role in business process management. These modeling processes are particularly important since many organizations lack a clear understanding of the details (activities, sequence, decisions) of their work practices.
F. Horita et al. / Decision Support Systems xxx (2017) xxx–xxx 3
ARTICLE IN PRESS
a tool-based re-engineering[30]. In contrast, Front et al.[9]adopted a design approach, which was iterative and end-user centered and involved multiple perspectives of specific business processes for supporting the design of useful process perspectives. Although the existing literature provides useful guidelines for eliciting concep-tual elements and modeling the business process of an organization, it does not include specific guidance for the modeling of business decisions or the relationship between decisions and data sources.
3. Research design and methods
This research project rests on the hypothesis that a model arti-fact can be used as an effective means of describing the connection of the decision-makers’ tasks with the data sources. For this reason, we carried out a design science research (DSR) method for design-ing and evaluatdesign-ing an artifact. We understand an artifact followdesign-ing Hevner et al.[11]as “a thing that can be transformed into a material (e.g., model) or process (e.g., method)”. In this paper, Hevner’s guide-lines[11]were adopted for ensuring the quality and rigor of our DSR method, as it is detailed inTable 1.
The left-hand side ofTable 1shows the activities involved in the DSR method while the right-hand side displays their descriptions. It is worth mentioning that this paper itself can be regarded as the “communication of research”, since it fulfills Hevner’s Guideline 7 — Communication of Research.
4. oDMN+Framework: a framework for connecting
decision-making with data sources
4.1. oDMN+: an extended model and notation
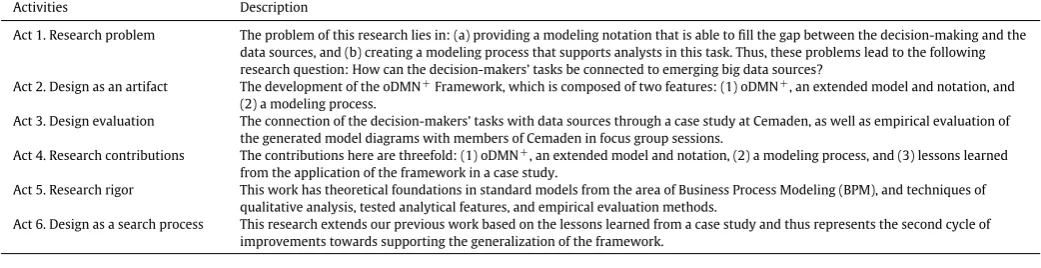
In order to give a first idea of the practical use of oDMN+,
Fig. 1displays an example that makes use of the model to repre-sent the decision-making involved in the request of a new product. On the top ofFig. 1, there is a business process and its tasks that are modeled using the BPMN notation. Within this, a specific task (“Define the appropriate supplier”) involves a decision (“Appropriate supplier”), which is modeled on the bottom using the DMN nota-tion and Extended O&M notanota-tion. The decision requires an item of information (“Product data”) and the outcome of another decision (“Supplier reputation”). It also employs a decision table (“Supplier reputation rules”) for processing the required items of information. The value of these items is provided by an external data source (“Supplier data”). The decisions are modeled into three categories. Firstly, the required components of the decision (the shapes in white) are defined at the topmost table on the right-hand side (“Appropriate supplier”). Then, the items of information provided by the input data and their values (the shapes in light gray) are defined in the middle table (“Product data”) while the decision rules of the business knowl-edge are determined at the table on the left-hand side (“Appropriate
supplier rules”). Finally, the observations provided by the data source (the shapes in dark gray) are shown in the table at the bottom. The data source combines observations with properties, which in turn are related to the properties defined for the decision.
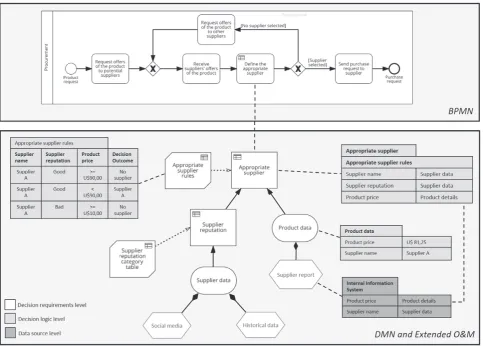
The graphical representation is useful for providing a common understanding among the different stakeholders; however, a formal definition of this notation requires of a metamodel that describes its elements and their relationships, shown inFig. 2. The elements are separated in accordance with their functional objectives through a layer-based structure, which consists of three layers: (1) the business process, (2) the decision, and (3) the data. All new elements proposed in this research are highlighted in gray. T he other elements, depicted in white, were proposed before as part of BPMN, DMN, and O&M. For simplification, only the elements of BPMN and DMN that are related to the oDMN+were presented.
4.2. The modeling process
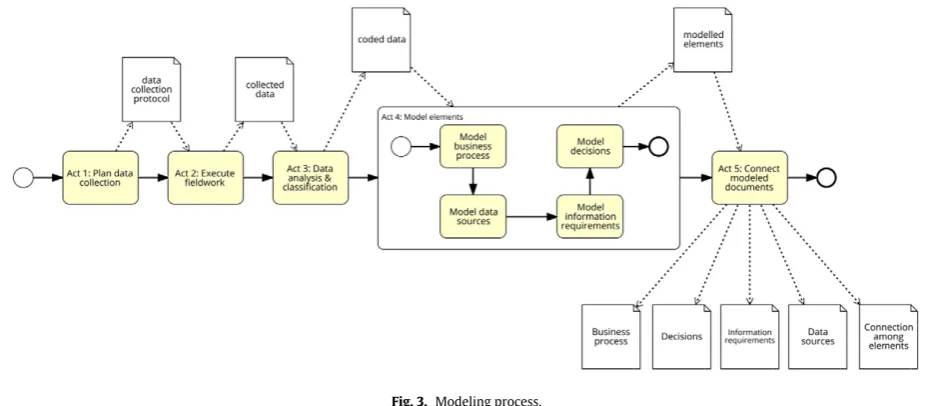
The practical use of oDMN+ consists of identifying important
conceptual elements of a particular application context and trans-lating them into a model diagram. To support this, we propose a modeling process (Fig. 3), which defines a systematic sequence of five activities for employing oDMN+.
[image:4.595.42.563.617.751.2]The aim of Activity 1,plan data collection, is to produce a pro-tocol that defines the method for data collection and the analytical features for guiding the modeling process in practice. The analytical features are a key factor for determining the conceptual elements of the application context (e.g., the activities)[12]. Furthermore, they would be later used as a basis for the coding technique. Activity 2,execute fieldwork, implements the previously defined instruments of data collection, e.g., conducting interviews within an application context. After the fieldwork, the collected data are used in Activ-ity 3,data analysis and classification, which consists of employing a coding technique for supporting the analysis and classification of the data. Coding is an analytical technique employed for extracting quantitative data from qualitative datasets, such as the transcrip-tions of interviews[29]. As a result, all the coded data will be used as input for Activity 4,model elements. The modeling of elements is achieved by four tasks, each of which is responsible for producing a particular model diagram. The business process modeling should be first defined. After this, the data sources that supply useful data for decision-making should be identified. Having obtained the data sources, a catalogue of the information requirements is compiled. In the last task, the decisions are first listed by conducting an anal-ysis of the activities. Then, both the business knowledge and its input data are planned in a way that provides a solid background for the decision-making. Altogether, these will be used in the final activity for interconnecting the modeled elements. The final aim of Activity 5,connect modeled elements, is to interconnect all the modeled elements that were found in the previous activity. This
Table 1
DSR method.
Activities Description
Act 1. Research problem The problem of this research lies in: (a) providing a modeling notation that is able to fill the gap between the decision-making and the data sources, and (b) creating a modeling process that supports analysts in this task. Thus, these problems lead to the following research question: How can the decision-makers’ tasks be connected to emerging big data sources?
Act 2. Design as an artifact The development of the oDMN+Framework, which is composed of two features: (1) oDMN+, an extended model and notation, and
(2) a modeling process.
Act 3. Design evaluation The connection of the decision-makers’ tasks with data sources through a case study at Cemaden, as well as empirical evaluation of the generated model diagrams with members of Cemaden in focus group sessions.
Act 4. Research contributions The contributions here are threefold: (1) oDMN+, an extended model and notation, (2) a modeling process, and (3) lessons learned
from the application of the framework in a case study.
Act 5. Research rigor This work has theoretical foundations in standard models from the area of Business Process Modeling (BPM), and techniques of qualitative analysis, tested analytical features, and empirical evaluation methods.
4 F. Horita et al. / Decision Support Systems xxx (2017) xxx–xxx
[image:5.595.52.536.56.402.2]ARTICLE IN PRESS
Fig. 1.Example of usage: Procurement.
means attributing the activities to the appropriate decisions, and then connecting these decisions to their required data, by defin-ing the required information, which this required data belongs to, and ultimately determining the data sources that might provide the required information. This activity then summarizes all the modeled elements in specific model diagrams. The next section presents the evaluation of the oDMN+Framework at Cemaden.
5. Case study
5.1. The Cemaden
In Brazil, preventive countermeasures have been taken to miti-gate loss and damage, as well as to improve the coping strategies of communities against floods, droughts, and landslides. One of these countermeasures was to set up Cemaden (in 2011), which aims to develop, implement, and operate monitoring systems for the issuing of warnings of imminent natural disasters to the National Center for Disaster Risk Management (CENAD, in Portuguese), and thus support disaster management in Brazil.
As mentioned before, the current monitoring systems of Cemaden collect data from around 1000 municipalities with recurrent dis-aster problems using more than 6500 sensors (e.g., hydrological stations and semi-automated rainfall gauges). This sensor network has been supplemented with different crowdsourcing projects with a view to increasing the volume, type, and quality of the available data. Among these projects, the “Pluviômetros nas Comunidades”
(Rainfall Gauges in the Communities) (http://www.cemaden.gov.br/ pluviometros-nas-comunidades/) is a project that seeks to involve vulnerable communities in the monitoring of environmental vari-ables. This means that people collect data from semi-automated rainfall gauges installed in the region of these communities and share them with the center via a web-based system. Around 1000 of these gauges have been installed in different communities in Brazil. Furthermore, Cemaden works in collaboration with several other institutions, e.g., the Brazilian Geological Survey (CPRM, in Por-tuguese). These provide further data about different environmental variables, which thus supplement the existing data of the center. All these data are displayed on a video wall located in a monitoring con-trol room that is used by members of Cemaden to assist them in decision-making (Fig. 4), e.g., deciding on whether to issue a warn-ing. These members are divided into different monitoring teams that work around the clock in six-hour shifts. These teams comprise five to seven members, and include at least one specialist in each of the following areas of expertise: hydrology, meteorology, geology, and disaster management.
F. Horita et al. / Decision Support Systems xxx (2017) xxx–xxx 5
[image:6.595.129.479.57.422.2]ARTICLE IN PRESS
Fig. 2.oDMN+metamodel.
5.2. The modeling process at Cemaden
In Activity 1, as a part of the data collection protocol, we defined how participatory observation and interviews could be employed in this case. These were chosen because, participatory observa-tion allows data to be obtained during the decision-makers’ daily
activities while, interviews make it possible to find out the personal perspectives of the decision-makers.
In Activity 2, the data was collected by one of the authors on January 19th–22nd, 2016 and February 1st, 2016 at Cemaden in São José dos Campos, Brazil. Participatory observations were first car-ried out as an instrument for gathering data about the day-to-day
[image:6.595.69.533.541.744.2]6 F. Horita et al. / Decision Support Systems xxx (2017) xxx–xxx
[image:7.595.122.464.56.247.2]ARTICLE IN PRESS
Fig. 4. The monitoring control room of Cemaden.
activities and interactions of the subjects. Additionally, individual and face-to-face interviews were also conducted to obtain data about the individual business activities of the subjects (e.g., the activities they carried out or the data sources that were used). This included 10 semi-structured interviews with members of the monitoring room – comprising 2 geologists, 2 hydrologists, 2 meteorologists, and 4 dis-aster analysts – all of whom completed a questionnaire that was prepared in the data collection protocol. Since the interviewees were working within strict time constraints, the interviews took no more than 30 min, while the participatory observations lasted for 2 h. Therefore, the methods of data collection in this research were twofold: (a) direct observation of the daily activities of the members in the monitoring room, and (b) 10 semi-structured interviews with these members.
After the data had been collected, we started on Activity 3. The interviews were then transcribed verbatim and a coding scheme was adopted for the analysis and classification that was based on the analytical features proposed by Horita et al. [12]. This anal-ysis was supported by the NVivo Data Analanal-ysis Software (http:// www.qsrinternational.com/what-is-nvivo). An in-depth analysis of the content defined by each coding category was then undertaken. For example, the coding category “Open Warning” and “Execute Group Meeting” – sub-elements of the coding category “Activity” – became activities of the business process while the coding category “Satellite” – sub-element of the coding category “Stationary Sensors” – was turned into a data source. The generated coded data were used in Activity 4 for modeling the conceptual elements of the case study, i.e., we modeled the business process of the monitoring room, its derived decisions, information requirements, and data sources. This activity was supported by the Signavio Modeling Platform (http:// www.signavio.com/). Finally, we concluded with Activity 5 in, which we decided to model the connection between the elements by means
of a general diagram editor since the Signavio Platform does not provide a means of including the customized features.
5.3. The modeling results of Cemaden
5.3.1. Modeled business process
With the aid of the coded data, we began with the modeling of the business process using BPMN.Fig. 5displays a simplified version of the business process diagram generated, which represents the pro-cess of issuing a warning that is executed inside the monitoring room of Cemaden — an expanded version can be found in Horita et al.[12]. The business process starts when there is a new shift of a moni-toring team. In the first activity, the weather conditions are analyzed and all the areas under surveillance are determined, i.e., those areas that are susceptible to an adverse situation. With a focus on these areas, the conditions of the rivers and mountains are continuously analyzed so as to be able to predict events involving landslides or floods. When a potential disaster has been detected, the whole team will gather together for further discussions about the potential event (e.g., if one member of the team is not absolutely certain about the occurrence of the event). In case the available data is not enough for determining the event and the warning cannot be opened, further data have to be gathered. Otherwise, the warning can be opened with all the data so that evidence can be provided to forecast the poten-tial event. Finally, the warning file os revised and communicated to CENAD.
5.3.2. Modeled decisions
It should be mentioned that all the tasks based on a decision, are highlighted in the business process, e.g., the “Open a warning” task marked on the top-left of the rectangles (seeFig. 5). Follow-ing this, this decision is expressed in greater detail by showFollow-ing the
[image:7.595.78.514.656.732.2]F. Horita et al. / Decision Support Systems xxx (2017) xxx–xxx 7
[image:8.595.106.499.56.308.2]ARTICLE IN PRESS
Fig. 6. Decision of opening a warning.
connection between business knowledge, required information, and data sources, as shown inFig. 6.
The decision requirements level of the DMN and Extended O&M were used for modeling the way these elements were intercon-nected. The “Warning” decision employs a business knowledge “Warning rules” and requires information from two other deci-sions (“Possibility of Occurrence” and “Potential Impact”). These decisions require particular business knowledges (“Possibility of occurrence category table” and “Potential impact category table”) for processing the required information, whereas the “Possibility of Occurrence” also requires information from another decision (“Weather Condition”), which employs further business knowledge (“Weather condition rules”). The Weather data, Threshold data, Infrastructure data, Community data and Risk data have been defined as the input data for these decisions. These input data, in turn, can be provided by different data sources, e.g., weather radar are suitable data sources for supplying the required information about weather conditions. Similarly, data about thresholds and the infrastructural facilities of an area can be gathered from the CPRM reports. Through the DMN’s decision logic level, it is also possible to model more
detailed information about the required business knowledge and the information requirements.
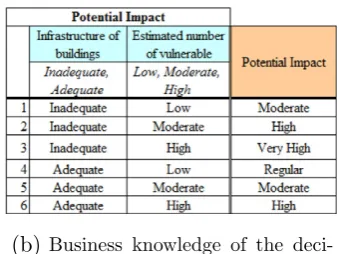
Fig. 7a displays the data for the “Potential Impact” decision that employs a business knowledge (“Potential impact” category table) and requires two items of information (the infrastructure of build-ings, and the estimated number of vulnerable inhabitants). The definition of the potential impact is achieved by a cross-comparison of the items of information, as displayed inFig. 7b. For example, when the number of buildings is unsuitable for a particular area and its estimated number of vulnerable inhabitants is very high, the potential impact on the area is very high.
[image:8.595.328.498.584.711.2]The cross-comparison of items of information takes into account their specific values in a particular area, e.g., the infrastructure with regard to buildings is unsuitable at the city. These items of informa-tion are some of the items that comprise the informainforma-tion require-ments catalogue. The connection between decisions’ about items of information and their values are defined by the input data.Fig. 8a shows the value of the item of information “Situation of buildings” as unsuitable while Fig. 8b shows that the estimated number of vulnerable inhabitants is “moderate”.
[image:8.595.121.494.587.729.2]8 F. Horita et al. / Decision Support Systems xxx (2017) xxx–xxx
[image:9.595.112.474.59.150.2]ARTICLE IN PRESS
Fig. 8.Input data of the decision “Potential Impact”.
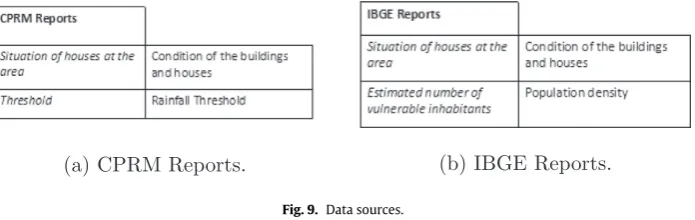
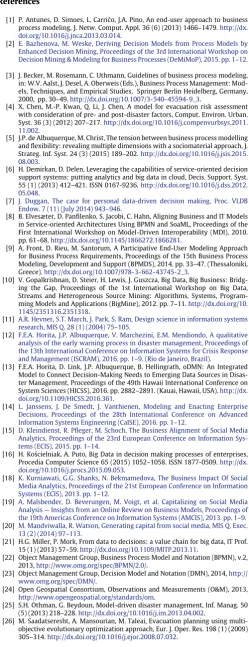
Since the items of information are provided by specific data sources, such as official reports,Fig. 9outlines data sources, which include their items of information. For example, reports from CPRM may provide information about the location of buildings (Fig. 9a). These items of information are also connected to decision prop-erties, e.g., the population density and the rainfall threshold. This association thus highlights the connection between the information requirements of decisions (“Infrastructure with regard to buildings”) and items of information (“Location of buildings”) provided by the data sources (CPRM Reports). The next section presents the results of an evaluation of the generated model diagrams at Cemaden.
5.4. Evaluation of the generated model diagrams at Cemaden
Two focus group sessions were held on August 23rd, 2016 at Cemaden. The analysis of the collected data revealed that the partici-pants supported the idea that the decision-making could be speeded up by the generated model diagrams, since they would serve as guidelines for taking actions. The reasons are that“decision-makers will be trained to know how the existing processes and decisions should be carried out, and thus be prepared for making better decisions or even improving them”, as a geologist mentioned. In this way, they will know what their activities are and what information they have to look for. However, it was noted that these model diagrams should provide guidelines for action but not constrain the activities of the monitoring team owing to the intrinsic dynamics of disaster man-agement.
The identification of emerging data sources that would be useful for decision-making was another important result of the generated model diagrams. Existing sensors still require supplementary data to enable them to estimate the overall situation in a vulnerable area, mainly because of the limited type of data that these sensors share and the restricted coverage of the monitored area. As a result, when asked about the modeled data sources, the participants stated that the information provided by ordinary citizens is of particular value for understanding the situation in their area. All this information can support the analysis of a warning that is examined when it is opened in the monitoring room, as a disaster analyst pointed out:
“This information [from social media] is more useful for the monitoring of a warning in a place where it was opened.”
However, a geologist mentioned that social media messages “should not be determining factors that directly influence decision-making”, since there are serious concerns about their quality and reliability. In contrast, messages sent by official organizations such as civil protection services or the police department, are useful because they can report on current incidents in the area, e.g., which areas are more damaged. This would support the activities of the disas-ter analysts, especially those that are concerned with assessing the degree of vulnerability of an area. Hence, the analysis of the gen-erated model diagrams has enabled practitioners to find alternative data sources that can be adopted to meet the requirements of the decision-makers. Furthermore, owing to the intrinsic dynamics of this study, finding the most useful data sources for particular deci-sions plays an important role in providing more accurate information and for speeding up the decision-making.
Another statement often made by the participants was the need to continuously update the reference values of the information parameters that comprise a business rule per location. This can be attributed to the intrinsic changes of the reference variables, which affect decision-making over a period of time, e.g., the number of inhabitants or buildings in a particular region. The environmen-tal conditions in different locations are also worth noting, e.g. the flood threshold changes from the Central region of São Paulo to the Serrana region of Rio de Janeiro. This led to a valuable discussion about how to address this issue. There was a common agreement that the reference values of the information parameters should not be defined when modeling the decisions, largely because they will often change depending on the nature of the location. Instead, a reference table could be created to connect the information param-eters of a business rule with their respective reference values, e.g., a rainfall decision table (business rule) could establish that the mod-erate level of rainfall (information parameter) for Rio de Janeiro is 50 mm per hour (reference value), while in Recife it is 30 mm per hour. Likewise, a hydrologist raised an interesting comment about information regarding changing parameters when making decisions:
“It is not only a matter of quantitative factors but also of parame-ters; other parameters should be taken into account and not only the water level.”
Hence, another important outcome of the generated model dia-grams that was raised during the discussions held in the focus group
[image:9.595.121.469.637.747.2]F. Horita et al. / Decision Support Systems xxx (2017) xxx–xxx 9
ARTICLE IN PRESS
sessions was determining the information parameters for decision-making. These parameters and reference values should be used to define the decision rules, which in turn “are of significant value for supporting the decision-making” according to a meteorologist. This is even more important when involved in critical tasks, which need to be discussed in depth by all the members of the monitoring team. In effect, the analysis of the generated model diagrams dur-ing the focus group sessions showed that these diagrams can allow decision-makers to establish the information parameters for their decision-making, as well as how the business rules should be formu-lated.
Finally, the model diagrams generated by our framework enabled the participants to determine, which tasks were most urgent; for example, the “Open a warning” and “Identify potential events” tasks. These tasks require further discussion by the monitoring team both about the decision-making tasks and the conditions for using data sources, the reliability and type of used data, and the decision rules that are employed. Evidence of this is provided by the following statements:
“When the team gathers there is a decision-making [to open a warning], which is a critical task . . . I have often asked the other members: ‘Is it going to rain?’ because I was not confident enough about the data that I received.”
These statements showed that the model diagrams generated by our framework have allowed decision-makers to identify both non-critical and urgent tasks that could affect their decisions. This also helps the monitoring teams to understand their business process.
6. Discussion
The results obtained from this study have important implica-tions for practice and research on decision-making with big data. In the first place, the results suggest that practitioners and researchers should not only focus on the information requirements when making a decision, but also go beyond this and understand how current data sources can be used to meet those requirements. This is particularly important because decision-making often involves a large volume of data that are shared in different formats and supplied by differ-ent sources. Therefore, a clear understanding of the data sources that affect decisions could improve decision-making either by speeding it up or by allowing people to acquire information that is more accu-rate. In this way, this research supplements existing studies that are confined to studying the use of big data in decision-making with-out recognizing the importance of data sources[21,35,37]. Moreover, this research can support the task of “specifying the authorized source” as described in the decision-making process proposed by Ko´scielniak and Puto [16]when the decisions of an organization are based on big data. In this task, practitioners can identify, which authorized data sources may affect their decision-making.
The findings of this research also suggest that practitioners and researchers need to be aware that decisions and their requirements (e.g., business rules) have an impact on the flexibility of organiza-tions, i.e., on their capacity to adapt to new conditions and situations. In the case of decision-making that relies on big data sources, this is even more challenging because new sources can emerge in real-time, while existing sources may be rendered ineffective. As a result, the business rules and information requirements should be able to adapt to this new set of data sources. When addressing this issue, the findings of our case study imply that it is very important to design mechanisms to support a flexible system for matching infor-mation requirements with the corresponding reference values. This finding makes it easier to understand the multiple dimensions of flexibility in the modeling of a business process that was provided by de Albuquerque and Christ[5], insofar as it adds new dimensions
of flexibility that correspond to different data sources, decisions, information requirements, and business rules.
Another factor is that the results obtained in this research sug-gest that decision support systems in the context of big data, provide features that allow end-users to control the visualization of data sources of interest. This is important since the required informa-tion and data sources often change; for example, decisions about resource allocation require data about available modes of trans-port, which are not required when defining a marketing strategy. This research thus supplements existing studies by adopting an approach that involves multiple levels of visualization for display-ing big data [34]. Furthermore, the required information for the decisions modeled with our approach can be regarded as a significant extension of previous works[15,32]that offers a basis for the cre-ation of innovative analytical algorithms or better ontologies for big data. Moreover, our approach can support the design of “information services” and “analytical services” as in the conceptual architecture of Demirkan and Delen[6]for service-oriented DSS. In these services, our results suggest that a supplementary service (or component) should be provided for managing the connection between a decision and its business rules, information requirements, down to its related data sources. As a result, it is expected that service-oriented DSS can provide information that is better suited to the needs of the decision-makers.
In addition, the study findings showed that the oDMN+ is
successful not only in linking the decision-makers’ tasks and the emerging big data sources its objectives but also in supplementing the existing standard notations (e.g., BPMN) for making a connec-tion between decision-making and data sources. It thus adds to existing work on the question of making a connection between decision-making and data sources [15,18–20]because it provides the Extended O&M that efficiently represents the abstraction of the data sources and connects it to the information required by a deci-sion. Moreover, it supports the modeling of the required information of decisions, which can be understood as a relevant contribution to previous works [15,34]. This is because these works are only focused on analyzing the necessity of considering required informa-tion in decision-making while, at the same time, they do not provide a systematic way of describing the connection of decision-making and its required information. In contrast, the generated model dia-grams act as guidelines both to enable decision-makers to recognize all the useful information for specific tasks and to determine the impact of information for the existing tasks. These findings can also assist in supporting and improving the use of the analytical mod-els proposed in previous studies[4,26]. This can be done by pointing out the data sources that can provide the information required by decision-makers. For example, social media platforms might provide information about the consumers’ attitudes and intention in a spe-cific area. Hence, this data can be used in supporting the planning of marketing actions in the area. It is thus expected that decision-making can be improved because decision-makers are provided with more valuable information. The oDMN+ adds to the
previ-ous research on metamodeling for disaster management[25,27]and decision-making[2,14] by describing all variables associated with decision-making.
10 F. Horita et al. / Decision Support Systems xxx (2017) xxx–xxx
ARTICLE IN PRESS
Finally, although the case study was centered on disaster manage-ment, the oDMN+Framework could be useful in several other
appli-cation domains for understanding the connection between their big data sources and decision-making. For example, possible application domains include the police patrolling and crime monitoring, health-care, marketing, and smart cities. The application of the oDMN+
Framework in these areas is conceivable, since the framework has been showed useful in three different application domains so far (i.e. humanitarian logistics in our previous work[13], procurement in
Fig. 1, and disaster management in the case study presented above). However, while these examples demonstrate the potential of the framework, its rigorous evaluation through the systematic appli-cation in several other scenarios is still required to establish the generality of the framework, which is beyond the scope of this work.
7. Conclusion
This paper has applied and extended a modeling framework to a practical scenario with the aim of connecting the decision-makers’ tasks with data sources by means of two essential features: (a) the oDMN+, an extended integrated model and notation, and (b) a
modeling process to employ oDMN+in practice. The application of
oDMN+ in a case study involving the decision-making at a
Brazil-ian early warning center (Cemaden) demonstrated the potential of oDMN+Framework as an underlying approach for the
understand-ing of how business processes could be aligned to data sources. This is because decision-makers can understand, which information is required for each task, and then find out what information is lack-ing or predict the impact of changes in information. The results of this application also showed that the extended oDMN+
effec-tively describes the connection between the decision-makers’ tasks with the data sources by modeling the conceptual elements from decision-makers. However, this was only possible after the Extended O&M had been defined, since it seeks to model the relationship between the input data and data sources (i.e., from the DMN to the data sources). The evaluation results indeed provided evidence of the effectiveness of the modeling process in obtaining conceptual elements from the decisions-makers in the context of an application. Future works could include the design of a supporting tool that makes the usage of oDMN+easier when it is applied to a particular
domain. The use of oDMN+ for improving the data collection and
for the design of decision support systems is an area that requires further research too. Finally, applications of oDMN+Framework in
different organizational settings and scenarios should be performed for providing further evidence on the generality of the framework and improve the knowledge basis.
8. Data access statement
Due to ethical concerns, supporting data cannot be made openly available. Further information about the data and conditions for access are available at the University of Warwick data archive:http:// wrap.warwick.ac.uk/87038.
Acknowledgements
This research was partially funded by the Engineering and Physi-cal Sciences Research Council (EPSRC) through the Global Challenges Research Fund. The authors would like to express thanks for the financial support provided by CAPES (Grant No. 88887.091744/2014-01). FEAH is grateful for the financial support from CNPq (Grant no. 202453/2014-6). JPA acknowledges financial support from Heidel-berg University (Excellence Initiative II/Action 7). EMM is granted by CNPq (Grant no. 307637/2012-3). The authors are also grateful to the
Editor, Prof. Dr. James Marsden, and the anonymous reviewers for their helpful suggestions.
References
[1] P. Antunes, D. Simoes, L. Carri´co, J.A. Pino, An end-user approach to business process modeling, J. Netw. Comput. Appl. 36 (6) (2013) 1466–1479.http://dx. doi.org/10.1016/j.jnca.2013.03.014.
[2] E. Bazhenova, M. Weske, Deriving Decision Models from Process Models by Enhanced Decision Mining, Proceedings of the 3rd International Workshop on Decision Mining & Modeling for Business Processes (DeMiMoP), 2015. pp. 1–12.
[3] J. Becker, M. Rosemann, C. Uthmann, Guidelines of business process modeling, in: W.V. Aalst, J. Desel, A. Oberweis (Eds.), Business Process Management: Mod-els, Techniques, and Empirical Studies, Springer Berlin Heidelberg, Germany, 2000, pp. 30–49.http://dx.doi.org/10.1007/3-540-45594-9_3.
[4] X. Chen, M.-P. Kwan, Q. Li, J. Chen, A model for evacuation risk assessment with consideration of pre- and post-disaster factors, Comput. Environ. Urban. Syst. 36 (3) (2012) 207–217.http://dx.doi.org/10.1016/j.compenvurbsys.2011. 11.002.
[5] J.P. de Albuquerque, M. Christ, The tension between business process modelling and flexibility: revealing multiple dimensions with a sociomaterial approach, J. Strateg. Inf. Syst. 24 (3) (2015) 189–202.http://dx.doi.org/10.1016/j.jsis.2015. 08.003.
[6] H. Demirkan, D. Delen, Leveraging the capabilities of service-oriented decision support systems: putting analytics and big data in cloud, Decis. Support. Syst. 55 (1) (2013) 412–421. ISSN 0167-9236.http://dx.doi.org/10.1016/j.dss.2012. 05.048.
[7] J. Duggan, The case for personal data-driven decision making, Proc. VLDB Endow. 7 (11) (July 2014) 943–946.
[8] B. Elvesæter, D. Panfilenko, S. Jacobi, C. Hahn, Aligning Business and IT Models in Service-oriented Architectures Using BPMN and SoaML, Proceedings of the First International Workshop on Model-Driven Interoperability (MDI), 2010. pp. 61–68.http://dx.doi.org/10.1145/1866272.1866281.
[9] A. Front, D. Rieu, M. Santorum, A Participative End-User Modeling Approach for Business Process Requirements, Proceedings of the 15th Business Process Modeling, Development and Support (BPMDS), 2014. pp. 33–47. (Thessaloniki, Greece).http://dx.doi.org/10.1007/978-3-662-43745-2_3.
[10] V. Gopalkrishnan, D. Steier, H. Lewis, J. Guszcza, Big Data, Big Business: Bridg-ing the Gap, ProceedBridg-ings of the 1st International Workshop on Big Data, Streams and Heterogeneous Source Mining: Algorithms, Systems, Program-ming Models and Applications (BigMine), 2012. pp. 7–11.http://dx.doi.org/10. 1145/2351316.2351318.
[11] A.R. Hevner, S.T. March, J. Park, S. Ram, Design science in information systems research, MIS Q. 28 (1) (2004) 75–105.
[12] F.E.A. Horita, J.P. Albuquerque, V. Marchezini, E.M. Mendiondo, A qualitative analysis of the early warning process in disaster management, Proceedings of the 13th International Conference on Information Systems for Crisis Response and Management (ISCRAM), 2016. pp. 1–9. (Rio de Janeiro, Brazil).
[13] F.E.A. Horita, D. Link, J.P. Albuquerque, B. Hellingrath, oDMN: An Integrated Model to Connect Decision-Making Needs to Emerging Data Sources in Disas-ter Management, Proceedings of the 49th Hawaii InDisas-ternational Conference on System Sciences (HICSS), 2016. pp. 2882–2891. (Kauai, Hawaii, USA).http://dx. doi.org/10.1109/HICSS.2016.361.
[14] L. Janssens, J. De Smedt, J. Vanthienen, Modeling and Enacting Enterprise Decisions, Proceedings of the 28th International Conference on Advanced Information Systems Engineering (CaISE), 2016. pp. 1–12.
[15] D. Kleindienst, R. Pfleger, M. Schoch, The Business Alignment of Social Media Analytics, Proceedings of the 23rd European Conference on Information Sys-tems (ECIS), 2015. pp. 1–14.
[16] H. Ko´scielniak, A. Puto, Big Data in decision making processes of enterprises, Procedia Computer Science 65 (2015) 1052–1058. ISSN 1877-0509.http://dx. doi.org/10.1016/j.procs.2015.09.053.
[18] K. Kurniawati, G.G. Shanks, N. Bekmamedova, The Business Impact Of Social Media Analytics, Proceedings of the 21st European Conference on Information Systems (ECIS), 2013. pp. 1–12.
[19] A. Malsbender, D. Beverungen, M. Voigt, et al. Capitalizing on Social Media Analysis — Insights from an Online Review on Business Models, Proceedings of the 19th Americas Conference on Information Systems (AMCIS), 2013. pp. 1–9.
[20] M. Mandviwalla, R. Watson, Generating capital from social media, MIS Q. Exec. 13 (2) (2014) 97–113.
[21] H.G. Miller, P. Mork, From data to decisions: a value chain for big data, IT Prof. 15 (1) (2013) 57–59.http://dx.doi.org/10.1109/MITP.2013.11.
[22] Object Management Group, Business Process Model and Notation (BPMN), v.2, 2013,http://www.omg.org/spec/BPMN/2.0/.
[23] Object Management Group, Decision Model and Notation (DMN), 2014,http:// www.omg.org/spec/DMN/.
[24] Open Geospatial Consortium, Observations and Measurements (O&M), 2013,
http://www.opengeospatial.org/standards/om.
[25] S.H. Othman, G. Beydoun, Model-driven disaster management, Inf. Manag. 50 (5) (2013) 218–228.http://dx.doi.org/10.1016/j.im.2013.04.002.
[image:11.595.304.554.102.751.2]F. Horita et al. / Decision Support Systems xxx (2017) xxx–xxx 11
ARTICLE IN PRESS
[27] S. Sackmann, M. Hofmann, H. Betke, Towards a Model-Based Analysis of Place-Related Information in Disaster Response Workflows, Proceedings of the 10th International Conference on Information Systems for Crisis Response and Management (ISCRAM), 2013. pp. 78–83. (Baden Baden, Germany).
[28] K. Saeedi, L. Zhao, P.R.F. Sampaio, Extending BPMN for Supporting Customer-Facing Service Quality Requirements, Proceedings of the 2010 IEEE Interna-tional Conference on Web Services (ICWS), 2010. pp. 616–623.http://dx.doi. org/10.1109/ICWS.2010.116.
[29] J. Saldaña, The Coding Manual for Qualitative Researchers, 2nd ed., Sage Publications Ltda, London, 2015.
[30] F.M. Santoro, M.R.S. Borges, J.A. Pino, CEPE: Cooperative Editor for Processes Elicitation, Proceedings of the 33rd Annual Hawaii International Conference on System Sciences (HICSS), 2000. pp. 1–10.http://dx.doi.org/10.1109/HICSS. 2000.926587.
[31] F.M. Santoro, M.R.S. Borges, J.A. Pino, Acquiring knowledge on business pro-cesses from stakeholders’ stories, Adv. Eng. Inform. 24 (2) (2010) 138–148.
http://dx.doi.org/10.1016/j.aei.2009.07.002.
[32] K. Taylor, C. Griffith, L. Lefort, R. Gaire, M. Compton, T. Wark, D. Lamb, G. Falzon, M. Trotter, Farming the web of things, IEEE Intell. Syst. 28 (6) (2013) 12–19.
http://dx.doi.org/10.1109/MIS.2013.102.
[33] A. Vera-Baquero, R. Colomo-Palacios, O. Molloy, Business process analytics using a big data approach, IT Prof. 15 (6) (2013) 29–35.http://dx.doi.org/10. 1109/MITP.2013.60.
[34] S. Vieweg, C. Castillo, M. Imran, Integrating social media communications into the rapid assessment of sudden onset disasters, Soc. Inform. 8851 (2014) 444– 461.http://dx.doi.org/10.1007/978-3-319-13734-6_32.
[35] S.F. Wamba, S. Akter, A. Edwards, G. Chopin, D. Gnanzou, How ‘big data’ can make big impact: findings from a systematic review and a longitudinal case study, Int. J. Prod. Econ. 165 (2015) 234–246.http://dx.doi.org/10.1016/j.ijpe. 2014.12.031.
[36] Z. You, Y.-W. Si, D. Zhang, X. Zeng, S.C. Leung, T. Li, A decision-making frame-work for precision marketing, Expert Syst. Appl. 42 (7) (2015) 3357–3367.
[37] K. Zhou, C. Fu, S. Yang, Big data driven smart energy management: from big data to big insights, Renew. Sust. Energ. Rev. 56 (2016) 215–225.http://dx.doi. org/10.1016/j.rser.2015.11.050.
Flávio E. A. Horitais a PhD student at the Institute of Mathematics and Computing Sciences (ICMC) of the Uni-versity of São Paulo (USP), São Carlos, Brazil. He received his MSc in Computer Science from State University of Londrina, Londrina, Brazil in 2013. He spent one-year research stay as a visiting PhD student at the European Research Center for Information Systems (ERCIS) of the University of Münster, Münster, Germany. His research project relates to the area of decision-making in disaster management. Particularly, he focuses on the modeling of decision-makers’ tasks and decisions, the development of spatial decision support systems, and integration of het-erogeneous big data sources (static and mobile sensors data and volunteered geographic information).
João Porto de Albuquerque is an Associate Professor
at the Centre for Interdisciplinary Methodologies in the University of Warwick, Coventry, United Kingdom. He received his PhD in Computer Science from the State Uni-versity of Campinas, Campinas, Brazil in 2006. He is also a core member of the Warwick Institute for the Science of Cities and an associate member of the Human-Centred Computing Group of the Department of Computer Sci-ence. His research centers on the study of collaborative and geospatial relationships in sociotechnical information systems and his current research combines quantitative, qualitative and spatial methods to investigate relation-ships between collaboratively-produced information (e.g. volunteered geographic information from social media, collaborative maps, and citizen sensing) and other official data sources (e.g. environmental sensors and socioeconomic data). He is particularly interested in developing innovative methods to improve our understanding about urban contexts and supporting decision-making with a view to make cities more resilient against disasters and extreme events triggered by natural hazards.
Victor Marcheziniis a researcher at the Brazilian National Center of Monitoring and Early Warning of Natural Disas-ters (CEMADEN) in the Ministry of Science, Techn., Innova-tion & CommunicaInnova-tion (MCTIC), São José dos Campos/SP, Brazil. He received his PhD in Sociology from the Fed-eral University of São Carlos, São Carlos, Brazil in 2013. He was a researcher at the Center of Social Research and Study in Disasters of the São Carlos Federal University (NEPED/UFSCar) and Natural Disaster Analyst at Brazil-ian National Center of Monitoring and Early Warning of Natural Disasters (CEMADEN/MCTI). He is focused on the study of sociocultural dimensions of early warning sys-tems applied to natural hazards.
Eduardo M. Mendiondois a Professor at the São