Early smoke detection of forest fires based on SVM
image segmentation
Ding Xiong*, Lu Yan
School of Electrical and Information Engineering, Hunan International Economics University, Changsha, China
*Corresponding author: [email protected]
Citation: Xiong D., Yan L. (2019): Early smoke detection of forest fires based on SVM image segmentation. J. For. Sci., 65: 150–159. Abstract: A smoke detection method is proposed in single-frame video sequence images for forest fire detection in large space and complex scenes. A new superpixel merging algorithm is further studied to improve the existing ho-rizon detection algorithm. This method performs Simple Linear Iterative Clustering (SLIC) superpixel segmentation on the image, and the over-segmentation problem is solved with a new superpixel merging algorithm. The improved sky horizon line segmentation algorithm is used to eliminate the interference of clouds in the sky for smoke detec-tion. According to the spectral features, the superpixel blocks are classified by support vector machine (SVM). The experimental results show that the superpixel merging algorithm is efficient and simple, and easy to program. The smoke detection technology based on image segmentation can eliminate the interference of noise such as clouds and fog on smoke detection. The accuracy of smoke detection is 77% in a forest scene, it can be used as an auxiliary means of monitoring forest fires. A new attempt is given for forest fire warning and automatic detection.
Keywords: Support Vector Machines (SVM); single frame; horizon detection; superpixel merging; forest fire prevention
Intelligent image processing of forest fires is a new field of research (Liu et al. 2018; Wang, Chen 2019). In order to avoid the spread of fire, the real time and accuracy of fire detection are crucial. In addition, the prediction of the fire spread and the fire location are also conducive to timely firefighting (Zhao et al. 2018). In the forest, due to the obstruc-tion of trees, the appearance of smoke tends to be earlier than that of the flame. Therefore, the study of smoke detection can be an early warning of forest fires based on digital images, and the fire location is visually indicated. Jakovčević et al. (2011) made a comprehensive summary of existing forest image smoke detection algorithms based on video
imag-es: general fires can be detected from the spectral, shape and motion characteristics of smoke, and then other detection means are used to assist detection. For example, the smoke is to blur the background of the image, the spatial wavelet analysis is used to detect smoke. In recent years, many scholars have studied the self-similarity of smoke, i.e. the fractal theory is used to detect smoke (Fujiwara, Terada 2004; Yan 2011). However, the most traditional for-est fire smoke detection algorithms only consider fire detection in an ideal background of the image, and the image is analysed at the pixel level. It is not necessarily applicable to smoke recognition in com-plex environments such as forests.
Journal of Forest Science, 65, 2019 (4): 150–159 Original Paper
https://doi.org/10.17221/82/2018-JFS
Image segmentation is a key step from image pro-cessing to image recognition. A single pixel does not usually have any semantic information. If the analysis is performed from a single pixel, the stabil-ity of the algorithm is poor. Therefore, the image segmentation technology can be used to segment the forest image into several regions of uniform na-ture, and the segmented pixel block is analysed for smoke detection. Nowadays, superpixel tion is widely used in the field of image segmenta-tion. The superpixel generation algorithm can be divided into two categories: graph theory and gra-dient descent. The SLIC superpixel segmentation algorithm is based on gradient descent, it has bet-ter dependence on the boundary and the algorithm is simple and efficient (Chunyao et al. 2014). In the subsequent processing, direct processing of su-perpixel blocks can reduce the amount of computa-tion and improve the robustness of the algorithm.
The damage caused by fire to humans is enormous. If an alarm is detected early in the fire, the loss can be greatly reduced. The traditional temperature-sensing smoke fire detection technology is suscep-tible to environmental factors (such as spatial height and width, air flow rate, dust, humidity, etc.), and the false alarm rate is high. Image-type fire detection has the characteristics of non-contact detection, and has become a new research field of fire detection tech-nology in recent years. The existing image-based fire detection is mostly based on algorithms such as fuzzy neural networks and BP neural networks. Because the neural network algorithm has the disadvantages of learning, slow convergence and is easy to fall into local minimum points, the sensitivity and stability of fire detection are reduced (Hui et al. 2019). The sup-port vector machine (SVM) adopts the principle of structural risk minimization and takes into account the training error and generalization ability (Cor-tes, Vapnik 1995; Mei, Zhang 2018), which can solve the practical problems of small samples, non-linearity, high dimensionality and local minimum points, it becomes a research hotspot in the field of machine learning.
A forest fire smoke detection method is proposed for single-frame still images in the present paper. For the first time, the superpixel segmentation tech-nique is applied to the field of forest fire detection. A new superpixel merging algorithm is proposed to solve the over-segmentation problem. The improved sky horizontal line segmentation algorithm is used to eliminate the interference of the sky part to the
detection. Finally, the SVM is used to classify the su-perpixel block, the influence of the fixed threshold is avoided by the algorithm adaptability. The algo-rithm does not involve the motion characteristics of smoke, and it breaks through the limitation of the conventional forest fire smoke detection algorithm that requires camera fixation (Celik et al. 2006); it is suitable for the case where the camera performs dynamic panoramic sampling on the forest.
MATERIAL AND METHODS SLIC superpixel segmentation
A superpixel is a small area consisting of a series of pixels that are adjacent in position and have simi-lar characteristics. SLIC is an improvement of the k-means clustering algorithm. The distance between pixels is defined according to colour and space. The computational complexity is reduced by limiting the search space, and the computational complexity is linear with the number of pixels N, it is independent of the number of superpixels K. The algorithm steps are as follows (Achanta et al. 2012):
Initialization
K cluster centres are initialized for colour im-ages in CIELAB space. To avoid placing the clus-ter centre on the edge or noise point, the clusclus-ter centre is moved to the lowest gradient of the 3 × 3 neighbourhood.
Allocation
In the allocation process, each pixel i is associat-ed with its nearest cluster centre basassociat-ed on similar-ity. The distance calculation is reduced by limiting the search distance (searching only the 2S × 2S area near the centre of the superpixel), it is the key to algorithm acceleration.
Update
Once each pixel is categorized to the nearest cluster, the cluster core is updated with the average of the [ l a b x y ]T vectors for all pixels in the region.
near-est superpixel. Where, the measure of similarity is given by the Eq. 1:
2 2
2 2
2 2
2
) ( ) ( '
) (
) (
) ( ) ( ) (
s s c
c
i j i
j s
i j i j i j c
N d N
d D
y y x x d
b b a a l l d
+ =
− + − =
− + − + −
= (1)
In the Lab colour space, the Lab colour model con-sists of three elements: brightness (L) and a, b related colours. L represents Luminosity, and the range of L ranges from 0 (black) to 100 (white). Letter a repre-sents a range from magenta to green (a is a negative value indicating green and a positive value indicating magenta), and b is a range from yellow to blue (b is a negative value indicating blue and a positive value in-dicating yellow). Advantages of Lab colour space: (1) Unlike RGB and CMYK colour spaces, Lab colours are designed to approximate human physiological vision. It is dedicated to perceptual uniformity, and its L component closely matches human brightness perception. It can therefore be used to make an ac-curate colour balance by modifying the output gra-dation of the a and b components, or by using the L component to adjust the brightness contrast. These transformations are difficult or impossible in RGB or CMYK. (2) Lab is considered a device-independent colour model because it describes how colours are displayed rather than the amount of specific colou-rants required to produce colours from devices such as monitors, printers, or digital cameras. (3) The co-lour gamut is wide. It not only contains all the gam-uts of RGB, CMYK, but also the colours they can’t express. The colour that the human eye can perceive can be expressed by the Lab model. In addition, the Lab colour model is also amazing in that it compen-sates for the uneven colour distribution of the RGB colour model, because the RGB model has too much transition colour between blue and green, and lacks yellow between green and red. And other colours. If we want to preserve the widest colour gamut and rich colours in the processing of digital graphics, it is best to choose Lab.
If the picture has a total of N pixels and is pre-segmented into K super-pixels of the same size, then the size of each super-pixel is N/K, and the dis-tance (step size) of adjacent seed points is approxi-mately S = sqrt(N/K). Dc stands for colour distance, ds stands for spatial distance, and Ns is the maxi-mum spatial distance within the class, it is defined as
Ns = S = sqrt(N/K), which is suitable for each cluster. The maximum colour distance Nc varies from picture to picture and from cluster to cluster, so a fixed con-stant m (value range [1, 40], generally 10) is used in-stead. (xi, yi) is the coordinates of the ith pixel in the picture. To unify these two measures, it needs to be normalized. D' is the similarity of the normalized pix-el points (Achanta et al. 2012).
Superpixel merging
After segmenting the forest image with the su-perpixel segmentation algorithm, the target smoke region is divided into similar superpixel blocks, which may cause overcutting, as shown in Fig. 2. In order to solve the problem that the smoke target is divided into multiple parts due to over-segmen-tation, it is necessary to perform region merging in the over-segmented image. The classical method of region merging is the region adjacency graph (RAG) and the nearest neighbour graph (NNG) (Haris et al. 1998). The concept is clear, but the implementation process is not simple.
A new superpixel merging algorithm is proposed in this paper: the current pixel block is orderly tra-versed, the over-segmentation problem of super-pixel is solved by the iterative combination of the current pixel block and the adjacent pixel block, the complete smoke area is obtained, and Matlab is used to execute the program simulation. The spe-cific algorithm is as follows:
Algorithm 1: Smoke superpixel merging algorithm
Input: Over-segmented image Output: superpixel merged image /*Initial*/
Label=0, label_change=0 For each superpixel
Returns the label of the current block If the current block has been marked Jump out of the loop
End if
Take the superpixel block label adjacent to the current block
Journal of Forest Science, 65, 2019 (4): 150–159 Original Paper
https://doi.org/10.17221/82/2018-JFS
Algorithm 1: to be continued
For each adjacent block
If adjacent blocks are not marked
End this cycle
Else
If the current block is similar to the adjacent block
The current block is labelled with the label of the adjacent block
End the entire cycle; End if
End if End for
If the current block is not marked
Label the current block with label, label_ change=1;
End if
/*Detects unmarked blocks in adjacent blocks*/ For each adjacent block
If adjacent blocks have been marked
End this cycle
Else
If the current block is similar to the adjacent block
Mark adjacent blocks with the label of the current block
End if
End if End for
/ *Check if the label changes */ If label_change=1
Label plus 1; label_change reset to 0 End if
End for
After superpixel initialization segmentation, the “label” in the algorithm is the region label which is as-signed to each superpixel block, and the label is a new label which is assigned to each merged pixel block after superpixel combining. In order to obtain the neighbouring block information of the current pixel block, the current pixel block (A) can be expanded by a 3 × 3 structural element (B) to obtain the contour C = A + B – A, and all adjacent blocks of the current block are determined by searching the area label of C.
The similarity between superpixels is measured by the Bhattacharyya coefficient (hereinafter referred to as the Barthel coefficient) between the grayscale his-tograms (Eq. 2).
∑
== N u
u Q u RHist Hist 1
ρ
(2)Where HistR and HistQ refer to the normalized grey histogram of the regions R and Q, and u rep-resents the u-th element in the region. The larger the Barthel coefficient, the higher the regional similarity.
Horizontal line segmentation
When shooting a forest picture, the sky part is often taken. Due to the similar spectral characteristics of clouds and smoke, clouds are identified as suspected regions when spectral features are used for suspected region extraction. In order to reduce the interference of the sky part, the sky horizontal line segmentation algorithm is introduced here. Detecting the horizon is very intuitive for people, but it is a great challenge for the computer. The change of climate, the influ-ence of different lighting in the day, the differinflu-ence of the terrain will change the appearance of the sky and the ground, so a robust horizontal line detection al-gorithm should study the relative differences between the sky and the ground, it is not their absolute appear-ance. In the existing research on the detection of the horizontal line, the premise of most algorithms is to assume that the horizon line is horizontal (Qun et al. 2010). This paper refers to and improves the algo-rithm of the literature (Ettinger, Nechyba 2002), the detection of horizons is adapted for different shapes. The thought is as follows.
Image binarization
The blue channel of the original image is taken, the threshold is automatically determined accord-ing to the maximum inter-class variance, and the image is binarized.
Extract horizontal edges
The horizontal edges of the binarized image are extracted with the Sobel vertical gradient template
1 2 1
0 0 0
1 -2 1
-. –
1 2
–1
0 0 0
1 2 1
https://doi.org/10.17221/82/2018-JFS
Detecting the horizon
The image is divided into x-segment vertical strips, x is depending on the actual size of the im-age. In each column, each row is processed, the value of the row vector is added to one point row by row, and several points with larger accumulated values are selected as candidate points, as shown in Fig. 1a, then the J value is obtained for the can-didate points. The cancan-didate point with the largest J value is the edge point to be found, as shown in Fig. 1b. 2 3 2 1 2 3 2
1 ) ( )
( | | | | 1 g g g s s s g s J λ λ λ λ λ
λ + + + + +
+ + =
∑
∑
(3) Where:horizons is adapted for different shapes. The thought is as follows.
Image binarization
The blue channel of the original image is taken, the threshold is automatically determined
according to the maximum inter-class variance, and the image is binarized.
Extract horizontal edges
The horizontal edges of the binarized image are extracted with the Sobel vertical gradient
template
1 2 1 0 0 0 1 -2 1-.
Detecting the horizon
The image is divided into x-segment vertical strips, x is depending on the actual size of the
image. In each column, each row is processed, the value of the row vector is added to one
point row by row, and several points with larger accumulated values are selected as candidate
points, as shown in Fig. 1(a), then the J value is obtained for the candidate points. The
candidate point with the largest J value is the edge point to be found, as shown in Fig. 1(b).
2 3 2 1 2 3 2
1 ) ( )
( | | | | 1 g g g s s s g s
J
(3)
Where:
g s n i g i g g n i s i s s g g i g i g i g i s s i s i s i s i x n u x n u n i b g r x n i b g r x 1 1 1 1 } , , 2 ,1 { ], [ } , , 2 ,1 { ], [ (4)
s i
,
g i
,i
∈
{1,2,3} represent the eigenvalues of the matrices
s
and
g, respectively.
s stands for the sky and g stands for the ground.
Horizon fitting
Straight-line fitting of edge points in different column bands to fill the entire horizon.
Smoke recognition
(4)
s i
λ
, g iλ
,i∈{1,2,3} represent the eigenvalues of thematrices
∑
s and∑
g , respectively. S stands for the sky and g stands for the ground.Horizon fitting
Straight-line fitting of edge points in different column bands to fill the entire horizon.
Smoke recognition
In order to detect the smoke area, the pixel blocks are classified after the superpixel is divided. In gen-eral, the model classifier or heuristic threshold can be used for classification (Genovese et al. 2011). Con-sidering the adaptability of the system, the support
vector machine (SVM) is used for smoke recognition. The principle of SVM was described in many papers (Weidong et al. 2001; Chen et al. 2005; Guohe 2011). In this paper, only LIBSVM is used to classify superpixel blocks according to the characteristics of spectral signals, namely smoke pixel blocks and non-smoke pixel blocks (Chang, Lin 2011).
Support Vector Machine (SVM) was first pro-posed by Vapnik (Cortes, Vapnik 1995). Its main idea is to map the input vector to a high-dimension-al feature space through some predefined nonlinear mapping, and create a hyperplane as the decision surface in this space to maximize the isolation edge between the positive and negative examples in the identified sample. SVM-based fire identification in-cludes the following steps:
(1) Performing a suspected flame area detection in the fire image, and extracting the fire information feature component in the suspected area;
(2) Selecting a training sample and a test sample by the extracted feature components;
(3) Select the appropriate kernel function and pen-alty factor, and use the training samples to establish the SVM classification model;
(4) Input the test sample into the classification model, and the classification accuracy rate is the fire recognition rate.
The RGB colour space is based on three basic colours of R (red), G (green), and B (blue), and it is superimposed to different degrees to produce rich and wide colours, so it is commonly called the three primary colour mode. The RGB colour space is the most basic, most common, hardware-orient-ed colour space in image processing. The collecthardware-orient-ed colour images are generally saved by being divided into R, G, and B components. However, images in the natural environment are susceptible to natural light, leaf occlusion, and shadows, i.e. they are sen-sitive to brightness. The components of the RGB colour space are closely related to the brightness, as long as the brightness changes, the three compo-nents will change accordingly. Therefore, the RGB colour space is suitable for display systems, but it is not suitable for image processing. The HIS colour space is proposed for better digital processing of colours. H is the hue, S is the saturation, and I is the intensity.
[image:5.595.74.272.94.174.2]There are many relevant features for research, such as spectral features, texture features, geomet-ric features, etc., but considering the complexity of the forest environment, the uncertainty of the Fig. 1. Horizontal line detection: (a) candidate point
selec-tion, (b) division of the horizon
The value of the row vector is added to a point
Journal of Forest Science, 65, 2019 (4): 150–159 Original Paper
https://doi.org/10.17221/82/2018-JFS
smoke shape and the limitation of the monitoring distance, only the spectral information features of the pixel block are analysed here. There is a clear difference in spectral information between the smoke itself and the forest background. In the RGB and HIS colour spaces, the mean values of the su-perpixel blocks R, G, B, M-N, S, and I, the mean square error of the grey value of each pixel block are extracted as input features of the pattern clas-sifier. Where M and N are the maximum and mini-mum values of R, G, and B, M-N is the difference between the maximum and minimum values. 46 smoke pixel blocks and 53 background pixel blocks are selected as the training set. In Table 1, the nor-malized differences are shown between the three typical smoke areas and the three typical non-smoke areas. The difference in the mean values of the three colour channels of the smoke area in Table 1 is smaller than that of the non-smoke area, and its saturation is low, and the colour is close to greyish white (large I value), which is consistent with the description of the nature of smoke in the classical algorithm (Celik et al. 2000).
Hue H (Hue) is measured by the angle, ranging from 0° to 360°. It is calculated from the red coun-terclockwise direction, red is 0°, green is 120°, and blue is 240°. Their complementary colours are: 60° for yellow, 180° for cyan, and 300° for magenta. The colour changes sequentially from 0° to 359°. When the angle reaches 360°, it is red, and the angle re-turns to 0°, so the total is 360°, every change of 1°, the hue will have a slight change. The saturation S indicates the extent to what the colour is close to the spectral colour. A colour can be thought of as the result of mixing certain spectral colours with white. The greater the proportion of the spectral colour, the closer the colour to the spectral colour, and the higher the saturation of the colour. The sat-uration is high and the colour is deep and colourful. The white colour component of the spectral colour is 0, and the saturation is the highest. Usually, the
value ranges from 0% to 100%. The larger the value, the more saturated the colour. Intensity I is the rel-ative darkness of a colour, it is usually measured as a percentage of 0% (black) to 100% (white).
MEASURED AND PERFORMANCE ANALYSIS
Experimental platform and image data source The computer in this experiment was configured as AMD AthlonTM II X2 250 processor with 3.0 Hz clock speed and 2 GB memory. The experimental simulations were performed on a PC, and the simula-tion software was Matlab (MathWorks, Natick, USA). The analysed picture data in this paper are all from the Chinese Xiaoxing’anling forest area. The picture collection methods include CCD camera acquisition and SLR camera acquisition. The im-ages in the actual project were captured only by the CCD camera with a resolution of 1920 × 1080. Picture smoke is produced by an artificial simula-tion experiment in the autumn fire season, it has the typical sense.
Superpixel segmentation and merge analysis In order to increase the operation speed, the size of the processed picture in Fig. 2 is adjusted to be 960 × 540. Fig. 2 shows the result of setting the su-perpixel initialization segmentation under different k-values. The order of labelling of the pixel blocks is from top to bottom and from left to right. They are judged and combined according to the merging algorithm proposed in Superpixel Merging.
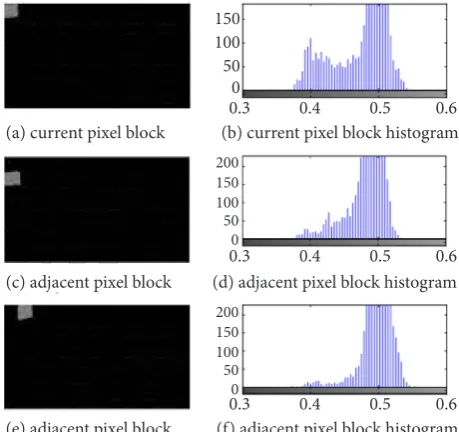
[image:6.595.63.290.668.757.2]In the process of superpixel merging, the simi-larity is measured according to the Barthel coeffi-cient of the adjacent hyperpixel block histogram. In Fig. 3a is a pixel block labelled 0 in the initializa-tion partiinitializa-tion, it is labelled as 0 in the superpixel merging algorithm, which is recorded as the cur-rent pixel block. Fig. 3c and e are the adjacent pixel blocks of Fig. 3a, respectively. Fig. 3b, d and f are histograms corresponding to the superpixel blocks in Fig. 3a, c, and e. In this example, it is assumed that the threshold of the Barthel coefficient satisfy-ing the superpixel block mergsatisfy-ing condition is 0.4, i.e. when the Barthel coefficient of the grey histo-gram of the two-pixel block region is larger than Table 1. Partial characteristic parameters (in %)
M-N S I
0.4, it can be considered that the two pixel blocks are similar. As can be seen from the experiment, in Fig. 3, the histograms b and d have the Barthel coefficient of 0.8093, and the histograms b and f have Babb’s coefficient of 0.7455, they indicate the current pixel block and the adjacent pixel block, re-spectively. If they are all similar, the adjacent pixel block is labelled with the label of the current pixel block.
The superpixel block number is obtained by ini-tializing the division, it continues to be traversed. Since the pixel block with the label 1 (it is shown in Fig. 3c) has been given label=0, the loop is skipped.
In terms of segmentation accuracy, recall rate and F-value, why the proposed algorithm is superior to the literature (Haris et al. 1998) and (Ettinger,
Nechyba 2002), the main reason is that the rough centralized knowledge is used to classify.
Continue traversing, for initializing the pixel block labelled 2 in the partition (like in Fig. 4), it is compared with the surrounding pixel block, if it is similar to the pixel block labelled 1, it is assigned to label=0. Otherwise, give it a new label, label=1, and its similarity is determined to the surrounding pixel blocks. By analogy, iterative merging of pixel blocks is performed.
In Fig. 5, the result of the superpixel combination is shown after selecting the appropriate similarity judgment threshold. It can be visually seen that the smoke area has been segmented, but for the com-puter, the pattern classification is still needed to identify the smoke.
Horizon test results analysis
The process analysis of the horizon detection is shown in Fig. 6. In Fig. 6b, the binarization threshold of 120 is shown with the largest inter-class variance, and a binarization figure is Fig. 6c. In this example, the image is divided into 12 column bands for analy-sis. In each column band, the ordinates of the candi-date points with the largest J value are 513, 497, 505, 505, 505, 505, 521, 529, 545, 561, 569, 577. The image resolution is 1920 × 1080.
For an ideal picture, the dividing line is obvious be-tween the sky part and the ground part, as shown in Fig. 7a. However, for most of the actual picture data, the distribution of pixels in the area where the sky and the ground are covered by the mist is closer to the sky part, so according to the criterion of this pa-per, it is often divided into the sky part, as shown in (a) k = 104
[image:7.595.363.470.95.155.2](b) k = 28
Fig. 2. Superpixel segmentation
Fig. 3. Similarity measure
Fig. 4. Current pixel block
Fig. 5. Superpixel merging (a) current pixel block (b) current pixel block histogram
(c) adjacent pixel block (d) adjacent pixel block histogram
(e) adjacent pixel block (f) adjacent pixel block histogram 0.3 0.4 0.5 0.6 0.3 0.4 0.5 0.6 0.3 0.4 0.5 0.6 150
100 50 0
200 150 100 50 0
[image:7.595.65.284.96.239.2] [image:7.595.61.291.513.729.2]Journal of Forest Science, 65, 2019 (4): 150–159 Original Paper
https://doi.org/10.17221/82/2018-JFS
Fig. 7b and d. For this article, it can just eliminate the interference of the mist at the junction of the sky and the ground on smoke detection and improve the ac-curacy of detection.
For the case where the sky and ground line is bent, as shown in Fig. 7c, d, the sky and ground lines in the actual illustration are formed by straight fit-ting the edge points in the adjacent divided column bands, they are not very close to the actual sky and ground line. In the judgment of the actual smoke index, it is necessary to give a weight value based on the distance between the smoke and the sky-ground line. It is closer to the sky-sky-ground line, the detected smoke is more likely the mist of the sky or the junction of the sky and the ground, and its smoke risk index is the lower weight value.
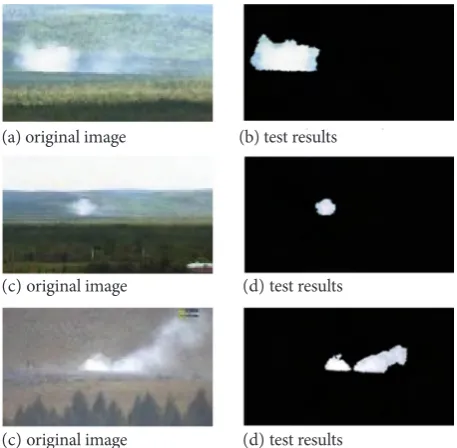
Automatic smoke detection result The forest fire pictures were collected and ana-lysed in different environments, after image seg-mentation 40 smoke pixel blocks and 60
non-smoke pixel blocks were taken as test sets. Since there is no public fire smoke database, most of the test charts come from actual shooting, and a small part comes from the Internet. Here, the probabil-ity of detection is defined as the probabilprobabil-ity of cor-rectly determining the smoke area and the non-smoke area. The false alarm rate is the probability of misidentifying the non-smoke area as the smoke area, the missed detection rate is the probability of misidentifying the smoke area as the non-smoke area.
[image:8.595.314.522.97.249.2] [image:8.595.64.291.98.248.2]The SVM type is set to standard SVM (C_SVM), the kernel function is a universal radial basis (RBF) kernel function. Fig. 8 shows a three-dimensional illustration of parameter optimization with cross-validation, the penalty factor c = 128 and the kernel function g = 5.6569. For a more detailed description Fig. 6. Horizon line detection process
Fig. 7. Sky horizontal line segmentation results Fig. 9. Original smoke map and segmentation results Fig. 8. 3D mesh parameter optimization
(a) original image (b) blue channel
(c) binarization (d) edge detection
(a) original image (b) haeven and earth detection
(c) haeven and earth line detection (d) h. and e. line detection
(a) original image (b) test results
(c) original image (d) test results
(c) original image (d) test results Best c = 128 g = 5.6569 CV Accuracy = 77%
Acc
urac
y (%)
100 90 80 70 60 50 40 30
10 5
0 –5
–10 –5
0 5
10
lbg
[image:8.595.304.533.512.736.2] [image:8.595.62.291.588.725.2]of the LIBSVM parameters, please refer to Chang, Lin (2011).
In this experiment, the detection accuracy was 77%, the false alarm rate was 14%, and the missed detection rate was 9%. To reduce the impact of dif-ferent lighting conditions, difdif-ferent forest environ-ments and different shooting conditions, it is also necessary to adjust the number of training samples, the amount of features are increased, and the rel-evant parameters of LIBSVM are adjusted. In prac-tical applications, training samples need to be col-lected according to actual scenarios for training, it increases the system robustness. The test results of some pictures are shown in Fig. 9.
CONCLUSION
Since the smoke occurs earlier than the flame, smoke detection is critical for early forest fire de-tection. Traditional forest fire smoke detection al-gorithms have to combine the static and dynamic characteristics of smoke, but in reality, the camera is not always static, which makes it difficult to extract dynamic features. In this paper, we study the smoke detection in single-frame video images. Firstly, the SLIC superpixel segmentation algorithm groups pixels according to the similarity of position and colour, which reduces the complexity of subsequent processing and reduces the influence of noise points on detection. After detection of the boundary line between the sky and the ground, the interference of the largest interferer – clouds is eliminated for smoke detection, which is crucial for reducing the false detection rate. Finally, the SVM classifier with strong classification ability is used to classify the su-perpixels. Compared with the traditional method of setting the fixed threshold detection, the pattern classifier can reduce the false detection rate and test the correct detection of forest fire smoke.
In this paper, only the spectral information fea-tures of smoke are used as input to the SVM clas-sifier. Further, texture features and shape features can be combined to increase the accuracy of detec-tion. In addition, the smoke detection algorithm proposed here is suitable only for the case where the daytime light is good, and the night-time fire detection requires the use of an infrared camera for flame detection.
SVM recognizes fires with good effects. SVM has a significant effect on small sample and
nonlin-ear problems, and overcomes the shortcomings of neural network over-learning and falling into local minimum points. SVM-based fire detection over-comes the shortcomings of traditional fire detec-tion algorithms, improves fire identificadetec-tion rate, and has high reliability. The research of this tech-nology has important theoretical significance and practical value in the field of fire detection.
References
Achanta R., Shaji A., Smith K. (2012): SLIC superpixels compared toctate-of-the-art superpixel methods. IEEE Transactions on Pattern Analysis & Machine Intelligence, 34: 2274–2282 .
Celik T., Demirel H., Ozkaramanli H. et al. (2007): Fire detec-tion using statistical color model in video sequences, Journal of Visual Communication and Image Representation, 18: 176–185.
Celik T., Ozkaramanli H., Demirel H. (2007): Fire and smoke detection without sensors: Image processing based ap-proach. 15th European Signal Processing Conference (EUSIPCO 2007), Poznan, Poland, September 3–7, 2007: 1794–1798.
Chang C.C, Lin C.J. (2011): LIBSVM: A library for support vector machines. ACM Transactions on Intelligent Systems and Technology, 2: 389–396.
Chen P., Lin C., Bernhard S. (2005): A tutorial on ν-support vector machines. Applied Stochastic Models in Business and Industry, 21: 111–136.
Chunyao W. et al. (2014): A Review of research on superpixel segmentation algorithms. Computer Applications, 31: 6–12. Cortes C., Vapnik V. (1995): Support vector networks. Machine
Learning, 20: 273–295.
Ettinger S.M., Nechyba M.C. (2002): Towards flight autonomy: vision-based horizon detection for micro air vehicles. In: Proceedings of the Florida conference on recent advances in robotics, Miami, May 18–21, 2002: 1–8.
Fujiwara N., Terada K. (2004): Extraction of a smoke region using fractal coding. In: IEEE International Symposium on Communications and Information Technology, Sapporo, Japan, October 26–29, 2004: 808–814.
Genovese A., Labati R.D., Piuri V. et al. (2011): Wildfire smoke detection using computational intelligence techniques. In: IEEE International Conference on Computational Intelli-gence for Measurement Systems and Applications (CIMSA). Ottawa, Canada: IEEE Press, September, 19-21, 2011: 1–6. Guohe F. (2011): SVM classification kernel function and
Journal of Forest Science, 65, 2019 (4): 150–159 Original Paper
https://doi.org/10.17221/82/2018-JFS
Haris K., Efstratiadis S.N., Maglaveras N. et al. (1998): Hy-brid image segmentation using watershed and fast region merging. IEEE Trans on Image Processing, 7: 1684–1699. Hui T., Halidan A. et al. (2019): Multi-type flame detec-tion combined with Faster R-CNN. Journal of Image and Graphics, 24: 73–83.
Jakovčević T., Braović M., Stipaničev D. et al. (2011): Review of wildfire smoke detection techniques based on visible spectrum video analysis. In: International Symposium on Image and Signal Processing and Analysis, Dubrovnik, Croatia: IEEE Press, September 4–6, 2011: 480–484. Liu K., Wei Y.X. et al. (2018): Design of forest fire
identifica-tion algorithm based on computer vision. Forest Engineer-ing, 34: 89–95.
Mei J.J., Zhang W. (2018): Early fire detection algorithm based on vibe and machine learning.Acta Optica Sinica, 38: 52–59.
Qun H., Yong S. et al. (2010): A horizon detection al-gorithm based on variance between classes. Acta Aeronautica Si-nica, 31: 2056–2061.
Wang H.T., Chen Y.L. (2019): A smoke image segmentation algorithm based on rough set and region growing. Journal of Forest Science, 65: 120–131.
Weidong C. et al. (2001): Research on support vector ma-chines. Computer Engineering and Applications, 37: 58–61.
Wang T., Liu Y., Xie Z.P. (2011): Flutter analysis based video smoke detection. Journal of Electronics & Information Technology, 35: 1024–1029.
Zhao W., Yu F.F. et al. (2018): Fire image recognition simu-lation of unmanned aerial vehicle forest fire protection system. Computer Simulation, 35: 459–464.