ORIGINAL ARTICLE
Functional gene group analysis identifies synaptic gene
groups as risk factor for schizophrenia
ES Lips
1, LN Cornelisse
1, RF Toonen
1, JL Min
1, CM Hultman
2,3, the International Schizophrenia
Consortium
13, PA Holmans
4, MC O’Donovan
4, SM Purcell
5,6,7,8, AB Smit
9, M Verhage
1, PF Sullivan
10,
PM Visscher
11and D Posthuma
1,121Department of Functional Genomics, Center for Neurogenomics and Cognitive Research, Neuroscience Campus Amsterdam, VU University, Amsterdam, The Netherlands;2Department of Medical Epidemiology and Biostatistics, Karolinska Institutet, Stockholm, Sweden;3Department of Neuroscience, Psychiatry, Ullera˚ker, Uppsala University, Uppsala, Sweden;4School of Medicine, Department of Psychological Medicine, School of Medicine, Cardiff University, Cardiff, UK;5Department of Psychiatry, Massachusetts General Hospital and Harvard Medical School, Boston, MA, USA;6Stanley Center for Psychiatric Research, Broad Institute of MIT and Harvard, Cambridge, MA, USA;7Broad Institute of Harvard and Massachusetts Institute of Technology, Cambridge, MA, USA;8Center for Human Genetic Research, Massachusetts General Hospital, Boston, MA, USA;9Molecular and Cellular Neurobiology, Center for Neurogenomics and Cognitive Research,
Neuroscience Campus Amsterdam, VU University, Amsterdam, The Netherlands;10Department of Genetics, University of North Carolina, Chapel Hill, NC, USA;11Queensland Statistical Genetics Laboratory, Queensland Institute of Medical Research, Brisbane, QLD, Australia and12Department of Medical Genomics, VU Medical Center, Neuroscience Campus, Amsterdam, The Netherlands
Schizophrenia is a highly heritable disorder with a polygenic pattern of inheritance and a population prevalence of B1%. Previous studies have implicated synaptic dysfunction in schizophrenia. We tested the accumulated association of genetic variants in expert-curated synaptic gene groups with schizophrenia in 4673 cases and 4965 healthy controls, using functional gene group analysis. Identifying groups of genes with similar cellular function rather than genes in isolation may have clinical implications for finding additional drug targets. We found that a group of 1026 synaptic genes was significantly associated with the risk of schizophrenia (P= 7.61011) and more strongly associated than 100 randomly drawn,
matched control groups of genetic variants (P< 0.01). Subsequent analysis of synaptic subgroups suggested that the strongest association signals are derived from three synaptic gene groups: intracellular signal transduction (P= 2.0104), excitability (P= 9.0104) and
cell adhesion and trans-synaptic signaling (P= 2.4103). These results are consistent with a
role of synaptic dysfunction in schizophrenia and imply that impaired intracellular signal transduction in synapses, synaptic excitability and cell adhesion and trans-synaptic signaling play a role in the pathology of schizophrenia.
Molecular Psychiatryadvance online publication, 20 September 2011; doi:10.1038/mp.2011.117
Keywords: GWAS; ISC; GAIN; gene group analysis; synapse; genome-wide association
Introduction
Schizophrenia is a chronic and debilitating brain
disorder that affects B1% of the population.1 It is
characterized by delusional beliefs, hallucinations, disordered speech and deficits in emotional and social behavior (see, for example, Mowry et al.2) and is highly familial with heritability estimates of 81%.3
The genome-wide association (GWA) studies have explained only a small amount of genetic variance in schizophrenia and are limited in power because of the many tests performed and do not necessarily lead to knowledge about molecular mechanisms of a clinical trait. In addition, the strongest associated variants— when part of a pathway—might not be the best drug target for therapeutic intervention, and identifying variants in the same cellular pathway or functionally related gene group may help in finding additional drug targets. Recent GWA studies for schizophrenia have implicated the major histocompatibility
com-plex on 6p21.2–22.1, neurogranin (NRGN) and
tran-scription factor 4 (TCF4).4–6 In addition, they have
provided molecular genetic evidence for a substantial polygenic component, implicating a large number of Received 12 January 2011; revised 21 July 2011; accepted 1
August 2011
Correspondence: Professor Danielle Posthuma, Center for Neuro-genomics and Cognitive Research (CNCR), De Boelelaan 1085, 1081 HV Amsterdam, The Netherlands.
E-mail: [email protected]
13Please see Appendix for consortium authorship.
single-nucleotide polymorphisms (SNPs) of very
small effect in the etiology of schizophrenia.4 Some
of these exceed genome-wide significance, but the currently available sample sizes are insufficient to
detect these effects.7 Therefore, SNPs in the
51081106 band are a mix of SNPs, some of
true effect and some that are false positives. Exactly what is the mix of true/false positives is currently unknown. Gene set or pathway analysis involves testing for the combined effect of multiple SNPs, which individually may have a very small effect that does not reach significance. By using a competitive testing scheme, associations of gene sets with a disease are corrected for false positives.
It seems likely that the substantial polygenic component involves SNPs that are not distributed randomly across the genome but are distributed across genes that share a common biological function
or pathway.8–11 Recent pathway analyses provided
evidence for the importance of the cell adhesion
molecule pathway in schizophrenia,12 as well as
the glutamate metabolism, transforming growth
fac-tor-b signaling and tumor-necrosis factor receptor-1
pathways.10
Pathway analysis is predicated upon accurate pathway definitions and validated assignment of genes to pathways. However, many of the available databases used for pathway definitions are not optimally annotated and the same pathways can be differentially defined across databases. Classically defined pathways are usually not independent, as the same genes, especially the end points, are often active in different pathways. Consequently, genetic variation that affects the expression or function of genes in different pathways may have similar consequences, have similar impact on pathogenesis and show similar disease association. Genes may also be grouped according to shared cellular function (see, for example, Ruano et al.11). Such ‘functional gene grouping’ goes across the traditionally defined biolo-gical pathways as it groups genes based on similar cellular function, and not based on a cascade of induced events, as in biological pathways. We recently proposed such a functional gene grouping approach to test for the combined effect of genetic variants in genes with shared cellular function in the synapse using a manually curated database of gene function based on both experimentation and data
mining.11Using this approach, it was found that one
relay element involved in many pathways (G pro-teins) was associated with cognitive traits, a strong association, which had remained unnoticed by tradi-tional single-marker analysis.11
Numerous statistical methods are available to evaluate the enrichment of selected pathways or functional gene groups for selected traits, including,
for example, the Gene Set Enrichment Analysis,13,14
testing for overrepresentation of categories of genes,9
the SNP ratio test,12 hypergeometric tests (see, for
example, Jiaet al.10) or theS-log(P) method combined with permutation.11Most of these methods correct for
linkage disequilibrium between SNPs, the number of SNPs per gene, gene size and multiple testing of independent pathways. Permutation is generally used to determine how likely a given result is if the null hypothesis of no association is true. However, the more genes are present in the defined gene group, the more likely it becomes to observe smallerP-values. In addition, generally these methods do not test how unique a certain result is given the polygenic nature of many studied traits. The latter involves testing whether a given pathway is significantly associated with a trait because it (1) includes a lot of genes and the trait is polygenic in nature or (2) because of the biological function of the pathway. This can be resolved by testing for association of matched-control gene groups in comparison with the targeted gene groups or pathways.
The purpose of the current study is to apply a functional gene group approach to detect well-annotated functional gene groups that are important to the risk of schizophrenia. The synaptic hypothesis of schizophrenia15–18is one of the leading hypotheses in the field of schizophrenia. Recent genetic findings underscore the importance of synaptic dysfunction in
schizophrenia.6,12 Therefore, we formally tested
whether the group of genes involved in pre- and post-synaptic functioning is related to schizophrenia, and whether this group is more strongly related than randomly drawn matched sets of genes, using a
‘competitive’ control method.19 Apart from testing
all synaptic genes for an association with the risk of schizophrenia, we also tested 17 subgroups of synaptic functioning, defined based on data mining
and experimentation.11 We used the data genotyped
within the International Schizophrenia Consortium
(ISC) case–control sample4 and the Genetic
Associa-tion InformaAssocia-tion Network (GAIN) schizophrenia data set.
Materials and methods
Participants and genotyping
The ISC case–control sample includes 3322 cases and 3587 controls (European ancestry), derived from seven different collection sites and is described in
detail elsewhere.4 Subjects were genotyped on
Affy-metrix 5.0 or 6.0 SNP arrays (AffyAffy-metrix, Santa Clara, CA, USA), and 300 523 SNPs passed quality control for the ISC_affy5 sample (3353 subjects) and 717 126 SNPs for the ISC_affy6 sample (3556 subjects).
The GAIN schizophrenia case–control sample has
been described elsewhere5,20 and has been
down-loaded from dbGAP (phs000021.v2.p1). Briefly, this sample included 1351 cases and 1378 controls of European ancestry. All individuals were genotyped on the Affymetrix 6.0 array, and 727 872 SNPs were available for analysis. The quality control procedures
followed those described in Shiet al.5The GAIN and
two ISC (affy5 and affy6) are independent and non-overlapping, and together contain 9638 individuals (4673 cases/4965 controls) of European ancestry.
Defining functional gene groups
Synaptic functional gene group definition was based on cellular function as determined by previous protein identification and data mining for synaptic
genes and gene function.11 Genes were considered
‘synaptic’ based on proteomic analysis of synaptic
preparations.21 In case of presynaptic genes, an
additional expert curation was performed because only few analyses of highly purified preparations are currently available for the presynaptic proteome,
except synaptic vesicles.22Hence, presynaptic genes
not covered by Takamori et al.22 were manually
curated using published functional data and a cumulative scoring paradigm with the following set of weighted criteria: null mutation produces a synaptic phenotype; activation of the gene product (for example, receptor) or blockade thereof directly modulates synaptic function; and immunoelectron microscopy detects gene product in the synapse. More than 500 PubMed entries were manually screened. Although this approach introduces a bias toward well-studied genes, this is inherent to creating functional gene groups, as functional grouping is by definition limited to those genes for which functional data are available. Synaptic genes were subdivided into 17 functional groups based on shared cellular function (a full listing of genes assigned to functional groups is provided in the Supplementary Material, Table S4).
SNP assignment
All SNPs that survived quality control in the ISC and GAIN samples were mapped to genes on the basis of NCBI (National Center for Biotechnology Information) human assembly build 36.3 and dbSNP release 129 (following Holmans et al.9). For the definition of the gene boundaries we downloaded the ‘seq_gene.md’ file from the FTP website of NCBI. From this list of
records we deleted genes coded as pseudo in the
column ‘feature_type’. Subsequently, we selected the
records with gene as ‘feature_type’ and reference as
‘group_label’. For these records, we assigned SNPs to genes when annotated between ‘chr_start’ (transcrip-tion start site) and ‘chr_stop’ (transcrip(transcrip-tion stop site).
Association analysis
SNP association analyses were carried out using additive models of allele counts. For the ISC data set, a correction for clustering within stratum (collection
site) was performed.4Cochran–Mantel–Haenszel tests
implemented in PLINK were used for the association analyses (PLINK, Boston, MA, USA). All analyses were carried out separately for the ISC_affy5, ISC_affy6
and the GAIN data sets. Empirical P-values from the
three data sets were combined by Stouffer’s weighted Z-transform method23to obtain an overallP-value.
Evaluating the combined effect of all SNPs in a
functional gene group: theS-log(P) method
We summed the logarithm of the reciprocal of the P-values (denoted asS-log(P) method)24,25as previously
applied to gene group analysis11 to determine the
significance of the combined effect of SNPs annotated
to genes in a functional group. TheS-log(P) method
combinesP-values from association analyses within a
group of genetic variants, then calculates the –log10of eachP-value, and sums over allP-values in a group to obtain the S-log(P) test statistic. To allow unbiased interpretation of the S-log(P) test statistic, 10 000 permutations were conducted, which are implicitly conditional on linkage disequilibrium, sample size, gene size, the number of SNPs per gene and the number of genes per group, by permuting affection status over genotypes. With this permutation proce-dure, only the relation between any genetic variant and affection status was disconnected, whereas linkage disequilibrium structure was kept intact. In addition, each group of genetic variants included the same (numbers of) SNPs and genes and had the same sample size as the original data set. For each
permutation, we obtained the S-log(P) for each
functional group and then compared the observed
S-log(P) of a group with the empirical P-value
distribution by calculating the proportion ofS-log(P) in the permuted data sets that was higher than the observedS-log(P).
Controlling for known polygenic effect on schizophrenia
The permutation approach described above provides information on how likely a given value of the combined effect of all SNPs in a group of genes is under the null hypothesis of no association of any SNP included in the functional group with the risk of schizophrenia (that is, self-contained testing).19 We additionally applied matched-control methods (that is, competitive testing) that allow to test whether randomly drawn groups of SNPs/genes would pro-vide an equally or more significant (combined)
empirical P-value as compared with the combined
P-value from the group of synaptic genes. We created
control gene groups matched for the number of genes (method 1) and groups that were matched for the effective number of SNPs, which could be drawn from all genic and nongenic SNPs (method 2), from genic SNPs only (method 3), from nongenic SNPs only (method 4) or from genic SNPs in brain-expressed genes only (method 5). The effective number of SNPs denotes the number of independent SNPs that is consistent with the empirical mean and variance of the distribution of the test statistic under the null
hypothesis of no association26 (see Supplementary
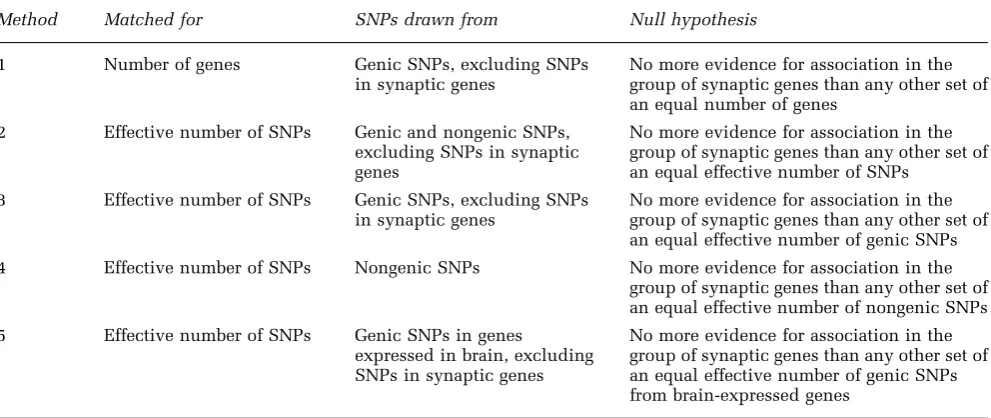
Material, section 2). Matching for the number of genes as well as for the effective number of SNPs in a functional gene group would be ideal but is highly limited as there will only be a few ( < 5) sets of gene groups that can be created when the original group of genes is large (1026 in our case). We thus created matched control groups following the five methods described above, each testing slightly different null hypotheses (see Table 1).
For each of the five competitive test designs, 100 matched control groups were drawn. For each draw we carried out an association analysis of all SNPs in the matched control group in each of the three data
sets, calculated the S-log(P) and then conducted
10 000 permutations of the data set to determine the
empiricalP-value of each of the 100 matched control
groups of genes in each data set, similar to the actual analysis with the group of synaptic genes. These
empirical P-values were combined across the three
data sets using Stouffer’s weighted Z-transform
method.23 For the five control designs, we thus
obtained five sets of 100 combined empirical
P-values. We then calculated how often the true
combined empirical P-value (from the synaptic gene
group) was higher than the combined empirical
P-value from the matched control groups and divided
that by the number of draws. As there were 100
draws, the lowest empirical P-value of the combined
empiricalP-value that could be obtained was < 0.01,
when none of the combined empirical P-values from
the random draws was equal or more significant than
the combined empirical P-value from the synaptic
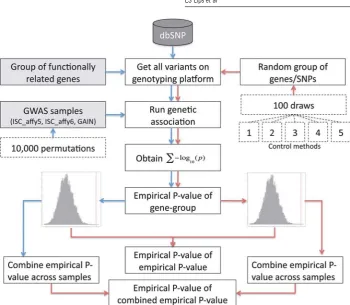
gene group (see Figure 1 for a graphical overview of the steps in data analysis).
Enrichment tests of previously implicated genes To test whether synaptic functional groups contained previously implicated genes more often than by
chance, we retrieved all SNPs with Pp1.0–5 from
all significant loci reported in GWA studies for schizophrenia that were published before 14 February
2011, using the GWAS catalog,27 and mapped
these loci to protein-coding genes (NCBI build v36.3). In addition, we added genes implicated from genome-wide copy number variation studies. Fisher’s exact tests were used to determine the presence of enrichment.
Results
Are synaptic genes significantly associated with the risk of schizophrenia?
No individual SNP reached the threshold for genome-wide significance in any of the three data sets using a genome-wide association analysis for each data set separately (see Supplementary Material, Section 1). Functional gene group analysis of all 1026 synaptic genes jointly resulted in a significant association of the total group of pre- and post-synaptic genes to the risk of schizophrenia. This was true in all three samples separately and highly significant when
combined across samples, with a combined P-value
of 7.61011. For each sample, theS-log(P) obtained from the original analysis with all synaptic genes was in the higher end of the empirical distribution and highly significant with only one of 10 000
permuta-tions exceeding the observed S-log(P) for the ISC_
affy5, ISC_affy6 and GAIN data sets (see Figure 2).
Are synaptic genes more significantly associated with the risk of schizophrenia than randomly drawn groups of genes/genetic variants?
Results from the five control methods show that SNPs in synaptic genes are more strongly associated with the risk of schizophrenia than any other set of randomly drawn genes. For none of the control
methods we found a combined empiricalP-value that
was more significant than the combined empirical
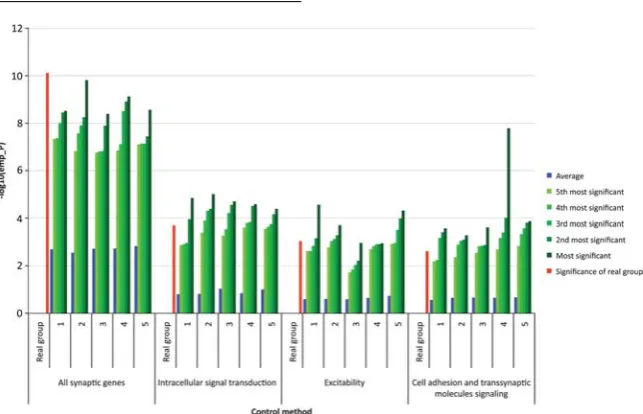
P-value from the synaptic genes (see Figure 3). The
[image:4.595.62.558.95.304.2]‘empiricalP-value of the combined empiricalP-value’ was < 0.01 in all methods, suggesting that the group of synaptic genes is generally more strongly asso-ciated with schizophrenia than other groups of genes that either include the same number of genes, the same effective number of nongenic or genic SNPs, nongenic SNPs only, genic SNPs only, or the same
Table 1 Five applied competitive control methods to test whether synaptic genes are more strongly associated with the risk for
schizophrenia than any other set of randomly grouped genes or single-nucleotide polymorphisms (SNPs)
Method Matched for SNPs drawn from Null hypothesis
1 Number of genes Genic SNPs, excluding SNPs
in synaptic genes
No more evidence for association in the group of synaptic genes than any other set of an equal number of genes
2 Effective number of SNPs Genic and nongenic SNPs,
excluding SNPs in synaptic genes
No more evidence for association in the group of synaptic genes than any other set of an equal effective number of SNPs
3 Effective number of SNPs Genic SNPs, excluding SNPs
in synaptic genes
No more evidence for association in the group of synaptic genes than any other set of an equal effective number of genic SNPs
4 Effective number of SNPs Nongenic SNPs No more evidence for association in the
group of synaptic genes than any other set of an equal effective number of nongenic SNPs
5 Effective number of SNPs Genic SNPs in genes
expressed in brain, excluding SNPs in synaptic genes
No more evidence for association in the group of synaptic genes than any other set of an equal effective number of genic SNPs from brain-expressed genes
effective number of SNPs drawn from brain-expressed genes only (see Supplementary Material, Section 2 and 3).
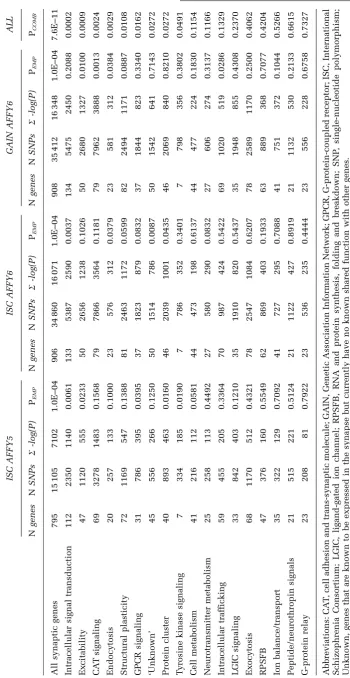
Which synaptic subgroups are most strongly related to the risk of schizophrenia?
We tested 17 synaptic subgroups and one group of synaptic genes that did not share a known function for association with schizophrenia. We found that three synaptic subgroups were significantly associated with increased risk of schizophrenia under the null hypothesis that none of the SNPs in these groups
were associated with schizophrenia: intracellular
signal transduction group (P= 0.0002), genes related
toexcitability(P= 0.0009) and genes involved inCAT
signaling (P= 0.0024) (see Table 2). The matched
control methods for these subgroups resulted in
P-values between 0.02 and 0.04 for the intracellular
signal transduction group, P-values between < 0.01
and 0.03 for the excitability group and between 0.03
and 0.06 for theCAT signalinggroup (see Figure 3 and Supplementary Material, Section 4).
The signal of the most significant functional group
(intracellular signal transduction) was mainly
de-rived from the two ISC samples, whereas the GAIN sample contributed less to the overall evidence of significance of these groups but contributed mostly to
[image:5.595.111.462.54.359.2]association with the CAT signaling group. For the
Figure 1 Overview of steps in data analysis. The arrows in red represent the flow for the real data whereas the blue arrows
represent the flow for the control methods.
350
300
250
200
150
100
50
0
F
requency
F
requency F
requency
350
300
250
200
150
100
50
0 300
200
100
0
ISC_AFFY5 - All synaptic genes ISC_AFFY6 - All synaptic genes GAIN - All synaptic genes
6200 6400 6600 14500 15000 15500 16000
sumlog values sumlog values
14500 15000 15500 16000 16500
sumlog values 6800 7000
Figure 2 Empirical distribution under the null hypothesis of no association between any single-nucleotide polymorphism
(SNP) and the risk of schizophrenia. TheS-log(P) obtained in the original analysis of all synaptic genes is indicated in red.
[image:5.595.102.473.422.537.2]group ofexcitabilitygenes, however, all three samples independently showed nominally significant or sug-gestive evidence. Quantile-quantile (Q-Q) plots
(Sup-plementary Figures S3a–c) of the significant
functional groups in the three samples show that for each functional group a multitude of SNPs in multi-ple genes, each of small effect, contribute to the overall significance, suggesting that the association cannot be explained by only a few genes in the group but rather by the joint effect of many genes in the functional group.
Synaptic subgroups include genes associated previously with schizophrenia
We tested whether the synaptic functional groups included genes for schizophrenia previously impli-cated from GWAS or copy number variation studies.
The intracellular signal transduction group includes
NRGN that was one of the most significant genes
identified in the SGENEþ-based GWAS,6but was not
below the genome-wide threshold in the ISC or MGS
GWAS.5 The excitability group contains CACNA1C,
which was one of the two most significant genes
identified in a recent GWAS for bipolar disorder,28
and was recently also associated with
schizophre-nia.29 From the group of genes involved in CAT
signaling, four genes were implicated previously in
schizophrenia. Enrichment analysis of previously implicated genes in schizophrenia from GWAS and copy number variation studies indicated significant,
although moderate, enrichment of previously asso-ciated genes in the total group of synaptic genes (P= 0.02) using Fisher’s exact test (see Supplementary Material, Section 5). This enrichment was mainly
because of enrichment in the CAT signaling group
(P= 0.0002). However, three out of the four genes in
CAT signaling groupthat were implicated previously
were very large genes. As significant results from GWAS studies may be biased toward large genes, the
enrichment test for theCAT signalinggroup needs to
be interpreted with caution.
Discussion
Our overarching goal was to test whether genetic variation associated with schizophrenia risk accumu-lates in functional gene groups operating in the synapse. We showed that the total group of genes encoding proteins in the synapse was highly asso-ciated with the risk of developing schizophrenia with
a combined P-value of 7.61011. In addition, the
group of synaptic genes was more strongly associated with schizophrenia than any of the matched-control groups of genes (P< 0.01). The functional gene group approach is a novel approach in which genes are grouped according to cellular function, and which goes across traditionally defined biological pathways, also referred to as horizontal versus vertical
group-ing.11 We used a manually curated database of
[image:6.595.148.470.60.267.2]functional gene groups, which tends to include more
Figure 3 Overview of combined empiricalP-values from the total group of synaptic genes and the three subgroups that were
significant after correction for multiple testing, obtained from the analysis based on the actual functional gene groups (‘real’, red bars), the five most significant results from the 100 draws for each control method (green bars) as well as the average combined empirical P-value (blue bars) obtained from five control methods across 100 draws. Note that the combined empiricalP-values for the real group analysis as well as those for each of the 100 draws in 5 control methods are obtained from 10 000 permutations of the data and are the combinedP-values across the three samples. For the ‘all synaptic genes’ group, none of the control methods resulted in a lowerP-value than the real analysis (that is, all empiricalP-values of the empiricalP-values < 0.01), for the intracellular signal transduction group, control methods 1, 2, 3, 4, 5 resulted in empirical
updated annotation information of gene function— especially for genes expressed in brain—than some of the online available databases. We do note, however, that gene function annotation is an ongoing endeavor and that annotation of functional gene groups is therefore continuously improved.
Apart from testing all genetic variants in synaptic genes as a group, we tested subgroups of synaptic functioning and found that three subgroups of synaptic functioning mainly drive the association of
the synaptic gene group with schizophrenia;
intracel-lular signal transduction (P= 0.0002), excitability
(P= 0.0009) andCAT signaling(P= 0.0024). In general, these associations were stronger than associations
with matched-control groups of genes, except forCAT
signaling (method 5,P= 0.06), indicating that at least
some groups of similar size as theCAT signalinggroup and existing of SNPs in brain-expressed genes are more significantly associated with schizophrenia than the CAT signaling group. We do note however that the CAT signaling group overlaps with the cell adhesion molecule pathway from the KEGG (Kyoto Encyclope-dia of Genes and Genomes) database that was previously associated with schizophrenia in the ISC.12
The group of intracellular signal transductionwas
most strongly associated with the risk of
schizophre-nia and includes the NRGNgene, which was one of
the most significant loci identified in the
(indepen-dent) SGENEþ GWAS,6 but—as a single marker
effect—not below the threshold of significance in the individual samples on which the current analysis was based. In the samples included in our study, each
individual SNP in the intracellular signal
transduc-tion group contributed very little to the risk of
schizophrenia. However, combining their contribu-tions resulted in a significant association.
Intracellular signal transduction in neurons and synapses is characterized by a high degree of cross-talk. A great variety of initial steps, such as activation of many different cell membrane receptors, leads to changes in a rather limited number of enzymes that generate second messengers (adenylyl cyclase, phos-pholipases) and a limited number of second messen-gers inside the cell (calcium, cyclic adenosine-monophosphate, cyclic guanosine adenosine-monophosphate, inositol 1,4,5-triphosphate; reviewed in de Jong and Verhage30). Hence, it is plausible that genetic varia-tion in the genes encoding these factors has similar biological consequences and additive contributions to pathogenesis.
The second most significant functional group
(Excitability) regulates steady-state and action
poten-tial-induced ionic currents and membrane potential. Many different channels can contribute but they all allow a limited number of types of biologically relevant ions to pass. Hence, as for the group of intracellular signal transduction genes, it is plausible that genetic variation in the genes encoding these channels have similar biological consequences in cellular excitability, and thus additive contributions to pathogenesis.
For complex traits with evidence for large numbers of variants of small effect size contributing to disease risk—such as schizophrenia,4,31 multiple sclerosis32
and type 1 diabetes mellitus33—it is of crucial
importance to test whether a reported association with a group of genes is merely because of the polygenic nature of the disease or the biological function of that group of genes. Any large group of genes is likely to emerge from pathway or functional gene group analysis merely because of background polygenic effects to the risk of disease. Reporting a significant association with the group of synaptic genes may therefore seem rather trivial, as it merely confirms that synaptic genes are included in the multitude of genes related to schizophrenia. A more interesting question is thus whether the group of synaptic genes is more strongly related to schizo-phrenia than other randomly drawn groups of genes. To test this, we designed five methods in which we created matched-control groups of genetic variants. As the genetic variants were drawn from different pools, every control method tested slightly different null hypotheses, providing insight into how impor-tant an observed association with a group of genes is under a polygenic model of inheritance. We propose that such competitive tests for pathways or functional groups need to be included in any future pathway or functional gene group analysis.
In this study we investigated whether the accumu-lated effects of genetic variants in multiple genes may cause dysfunction of a biological system (for example, intracellular signal transduction), while a single genetic variant is not sufficient to cause disease. The functional gene groups we defined are character-ized by redundancy, which is most likely accom-plished by previous gene duplication. Over time, genetic mutations may arise causing different or less optimal protein function, which may thrive in a gene pool, thus leading to diversity or genetic heterogene-ity. To some extent genes in the same functional group may functionally replace each other when others function suboptimal. Such redundancy and hetero-geneity provide for fail-safe mechanisms, which render functional gene groups—like most other biological systems—robust. Robustness is a property that allows a system to maintain its functions against internal and external perturbations.34,35
Typically, in different individuals a different set of mutations may be responsible for dysfunction. As a consequence, individuals with the same disease may
have completely different genetic backgrounds,
which is consistent with both a polygenic model of disease and a threshold model of disease but seriously hampers single-marker GWAS analysis, as it de-creases the effect sizes of single SNPs/genes. When focusing on a functional gene group, it becomes less relevant which particular genes carry a mutation, whereas the number of genes carrying a mutation before the system starts to dysfunction is much more important. Robustness, inherent to for instance synaptic protein networks, and their underlying
genes, may thus provide biologically meaningful ways to interpret the notion that ‘thousands of genes under-lie complex traits’ and may provide important insights in the biological systems important in disease etiology (see Supplementary Material, Section 6 and 7).
Our current results suggest that multiple genes involved in synaptic functioning are important for schizophrenia, provide support for the synaptic
hypothesis of schizophrenia15–18 and provide
tenta-tive evidence for the involvement of the biological
mechanisms involved in intracellular signal
trans-duction, excitability and cell adhesion and
trans-synaptic signaling molecules in schizophrenia.
Conflict of interest
The authors declare no conflict of interest.
Acknowledgments
Statistical analyses were carried out on the Genetic
Cluster Computer (http://www.geneticcluster.org),
which is financially supported by the Netherlands Scientific Organization (NWO 480-05-003). The geno-typing of the samples was provided through the Genetic Association Information Network (GAIN). The data set(s) used for the analyses described in this manuscript were obtained from the GAIN
Database found at http://view.ncbi.nlm.nih.gov/
dbgap, controlled through dbGaP accession number phs000021.v2.p1. Samples and associated phenotype data for the genome-wide association of schizophre-nia study were provided by the Molecular Genetics of Schizophrenia Collaboration (PI: PV Gejman, Evan-ston Northwestern Healthcare (ENH) and Northwes-tern University, Evanston, IL, USA). We gratefully acknowledge financial support of the NWO/VIDI (452-05-318 to DP), TOP ZonMW (40-00812-98-07-032 to LNC and MV), NWO-ALW Pilot grant (051.07.004 to MV), FP7 HEALTH-F2-2009-241498 (Eurospin consortium), Neuroscience Campus Am-sterdam and the European Union Seventh Framework Program under grant agreement no. HEALTHF2-2009-242167 (‘SynSys’ project). ABS and MV are supported by the Centre for Medical Systems Biology (CMSB). PMV acknowledges funding from the Australian National Health and Medical Research Council (NHMRC grants 389892 and 613672). Collaboration between DP and PMV was supported through a Visiting Professorship grant from the Royal Nether-lands Academy of Arts and Sciences (KNAW).
References
1 Andreasen NC. Symptoms, signs, and diagnosis of schizophrenia. Lancet1995;346: 477–481.
2 Mowry BJ, Holmans PA, Pulver AE, Gejman PV, Riley B, Williams NM et al.Multicenter linkage study of schizophrenia loci on chromosome 22q.Mol Psychiatry2004;9: 784–795.
3 Sullivan PF, Kendler KS, Neale MC. Schizophrenia as a complex trait: evidence from a meta-analysis of twin studies.Arch Gen Psychiatry2003;60: 1187–1192.
4 Purcell SM, Wray NR, Stone JL, Visscher PM, O’Donovan MC, Sullivan PFet al.Common polygenic variation contributes to risk of schizophrenia and bipolar disorder.Nature2009;460: 748–752. 5 Shi J, Levinson DF, Duan J, Sanders AR, Zheng Y, Pe’er Iet al. Common variants on chromosome 6p22.1 are associated with schizophrenia.Nature2009;460: 753–757.
6 Stefansson H, Ophoff RA, Steinberg S, Andreassen OA, Cichon S, Rujescu Det al.Common variants conferring risk of schizophrenia. Nature2009;460: 744–747.
7 Kim Y, Zerwas S, Trace SE, Sullivan PF. Schizophrenia genetics: where next?Schizophr Bull2011;37: 456–463.
8 Torkamani A, Topol EJ, Schork NJ. Pathway analysis of seven common diseases assessed by genome-wide association.Genomics 2008;92: 265–272.
9 Holmans P, Green EK, Pahwa JS, Ferreira MA, Purcell SM, Sklar P et al.Gene ontology analysis of GWA study data sets provides insights into the biology of bipolar disorder. Am J Hum Genet 2009;85: 13–24.
10 Jia P, Wang L, Meltzer HY, Zhao Z. Common variants conferring risk of schizophrenia: a pathway analysis of GWAS data. Schizophr Res2010;122: 38–42.
11 Ruano D, Abecasis GR, Glaser B, Lips ES, Cornelisse LN, de Jong APet al.Functional gene group analysis reveals a role of synaptic heterotrimeric G proteins in cognitive ability.Am J Hum Genet 2010;86: 113–125.
12 O’Dushlaine C, Kenny E, Heron E, Donohoe G, Gill M, Morris D et al.Molecular pathways involved in neuronal cell adhesion and membrane scaffolding contribute to schizophrenia and bipolar disorder susceptibility.Mol Psychiatry2011;16: 286–292. 13 Subramanian A, Kuehn H, Gould J, Tamayo P, Mesirov JP. GSEA-P:
a desktop application for Gene Set Enrichment Analysis. Bioinfor-matics2007;23: 3251–3253.
14 Wang K, Li M, Bucan M. Pathway-based approaches for analysis of genomewide association studies.Am J Hum Genet 2007;81: 1278–1283.
15 Owen MJ, O’Donovan MC, Harrison PJ. Schizophrenia: a genetic disorder of the synapse?BMJ2005;330: 158–159.
16 Harrison PJ, Weinberger DR. Schizophrenia genes, gene expres-sion, and neuropathology: on the matter of their convergence. Mol Psychiatry2005;10: 40–68; image 45.
17 Hayashi-Takagi A, Sawa A. Disturbed synaptic connectivity in schizophrenia: convergence of genetic risk factors during neuro-development.Brain Res Bull2010;83: 140–146.
18 Johnson RD, Oliver PL, Davies KE. SNARE proteins and schizo-phrenia: linking synaptic and neurodevelopmental hypotheses. Acta Biochim Pol2008;55: 619–628.
19 Wang K, Li M, Hakonarson H. Analysing biological pathways in genome-wide association studies. Nat Rev Genet 2010; 11: 843–854.
20 Suarez BK, Duan J, Sanders AR, Hinrichs AL, Jin CH, Hou Cet al. Genomewide linkage scan of 409 European-ancestry and African American families with schizophrenia: suggestive evidence of linkage at 8p23.3-p21.2 and 11p13.1-q14.1 in the combined sample.Am J Hum Genet2006;78: 315–333.
21 Li K, Hornshaw MP, van Minnen J, Smalla KH, Gundelfinger ED, Smit AB. Organelle proteomics of rat synaptic proteins: correla-tion-profiling by isotope-coded affinity tagging in conjunction with liquid chromatography-tandem mass spectrometry to reveal post-synaptic density specific proteins.J Proteome Res2005;4: 725–733.
22 Takamori S, Holt M, Stenius K, Lemke EA, Gronborg M, Riedel D et al.Molecular anatomy of a trafficking organelle.Cell2006;127: 831–846.
23 Whitlock MC. Combining probability from independent tests: the weighted Z-method is superior to Fisher’s approach.J Evol Biol 2005;18: 1368–1373.
24 Fisher RA.Statistical Methods for Research Workers. Oliver and Boyd: London, 1925.
25 Zaykin DV, Zhivotovsky LA, Westfall PH, Weir BS. Truncated product method for combiningP-values.Genet Epidemiol2002;
22: 170–185.
26 Nyholt DR. A simple correction for multiple testing for single-nucleotide polymorphisms in linkage disequilibrium with each other.Am J Hum Genet2004;74: 765–769.
27 Hindorff LA, Sethupathy P, Junkins HA, Ramos EM, Mehta JP, Collins FSet al.Potential etiologic and functional implications of genome-wide association loci for human diseases and traits.Proc Natl Acad Sci USA2009;106: 9362–9367.
28 Ferreira MA, O’Donovan MC, Meng YA, Jones IR, Ruderfer DM, Jones L et al. Collaborative genome-wide association analysis supports a role for ANK3 and CACNA1C in bipolar disorder.Nat Genet2008;40: 1056–1058.
29 Green EK, Grozeva D, Jones I, Jones L, Kirov G, Caesar Set al.The bipolar disorder risk allele at CACNA1C also confers risk of recurrent major depression and of schizophrenia.Mol Psychiatry 2010;15: 1016–1022.
30 de Jong AP, Verhage M. Presynaptic signal transduction pathways that modulate synaptic transmission.Curr Opin Neurobiol2009;
19: 245–253.
31 The Schizophrenia Psychiatric Genome-Wide Association Study (GWAS) Consortium. Genome-Wide Association Study Identifies Five Novel Schizophrenia Loci.Nat Genet, in press.
32 Bush WS, Sawcer SJ, de Jager PL, Oksenberg JR, McCauley JL, Pericak-Vance MAet al.Evidence for polygenic susceptibility to multiple sclerosis–the shape of things to come.Am J Hum Genet 2010;86: 621–625.
33 Wei Z, Wang K, Qu HQ, Zhang H, Bradfield J, Kim Cet al.From disease association to risk assessment: an optimistic view from genome-wide association studies on type 1 diabetes.PLoS Genet 2009;5: e1000678.
34 Kitano H. Biological robustness.Nat Rev Genet2004;5: 826–837. 35 Stelling J, Sauer U, Szallasi Z, Doyle 3rd FJ, Doyle J. Robustness of
cellular functions.Cell2004;118: 675–685.
This work is licensed under the Creative Commons Attribution-NonCommercial-No Derivative Works 3.0 Unported License. To view a copy of this license, visit http://creativecommons. org/licenses/by-nc-nd/3.0/
Supplementary Information accompanies the paper on the Molecular Psychiatry website (http://www.nature.com/mp)
Appendix
The International Schizophrenia Consortium:
Susanne Akterin,9 Kristen Ardlie,3 M. Helena
Azevedo,28Nicholas Bass,6 Douglas HR Blackwood,7
Celia Carvalho,11 Kimberly Chambert,2,3 Khalid
Choudhury,6 David Conti,11 Aiden Corvin,8 Nick J
Craddock,5Caroline Crombie,21David Curtis,20Mark J Daly,2,3,4 Susmita Datta,6 Emma Flordal Thelander,9
Eva Fredriksson,9 Stacey B Gabrie,13 Casey Gates,3
Lucy Georgieva,5Michael Gill,8Hugh Gurling,6Peter A
Holmans,5 Christina M Hultman,9,10Ayman Fanous,11
Gillian Fraser,21Elaine Kenny,8George K Kirov,5James A Knowles,11Robert Krasucki,6Joshua Korn,3,4Soh Leh Kwan,12Jacob Lawrence,6Paul Lichtenstein,9Antonio Macedo,28Stuart Macgregor,14Alan W Maclean,7Patrik
Magnusson,9 Scott Mahon,3 Pat Malloy,7 Kevin A
McGhee,7 Andrew McQuillin,6 Helena Medeiros,11
Frank Middleton,23 Vihra Milanova,16 Christopher
Morley,23 Derek W Morris,8 Walter J Muir,7 Ivan
Nikolov,5N Norton,5Colm T O’Dushlaine,8Michael C O’Donovan,5Michael J Owen,5Carlos N Pato,11Carlos Paz Ferreira,27Ben Pickard,7Jonathan Pimm,6Shaun M Purcell,1,2,3,4 Vinay Puri,6 Digby Quested,19,29 Douglas
M Ruderfer,1,2,3,4 Edward M Scolnick,2,3 Pamela
Sklar,1,2,3,4 David St Clair,12 Jennifer L Stone,1,2,3,4
Patrick F Sullivan,13 Emma F Thelander,9 Srinivasa
Thirumalai,18 Draga Toncheva,15 Margaret Van Beck,7
Peter M Visscher,14 John L Waddington,17 Nicholas
Walker,22H Williams5and Nigel M. Williams5
1Department of Psychiatry, Massachusetts General
Hospital and Harvard Medical School, Boston, MA, USA;
2 Stanley Center for Psychiatric Research, Broad
Institute of MIT and Harvard, Cambridge, MA, USA;
3 Broad Institute of Harvard and Massachusetts
Institute of Technology, Cambridge, MA, USA;
4 Center for Human Genetic Research,
Massachu-setts General Hospital, Boston, MA, USA;
5School of Medicine, Department of Psychological
Medicine, School of Medicine, Cardiff University, Cardiff, UK;
6 Molecular Psychiatry Laboratory, Department of
Mental Health Sciences, University College London Medical School, Windeyer Institute of Medical Sciences, London, UK;
7Division of Psychiatry, School of Molecular and
Clinical Medicine, University of Edinburgh, Edin-burgh, UK;
8 Neuropsychiatric Genetics Research Group,
Department of Psychiatry and Institute of
Molecular Medicine, Trinity College Dublin, Dublin, Ireland;
9 Department of Medical Epidemiology and
Bios-tatistics, Karolinska Institutet, Stockholm, Sweden;
10 Department of Neuroscience, Psychiatry,
Uller-a˚ker, Uppsala University, Uppsala, Sweden;
11 Center for Genomic Psychiatry, University of
Southern California, Los Angeles, CA, USA;
12 Institute of Medical Sciences, University of
Aberdeen, Foresterhill, Aberdeen, UK;
13 Departments of Genetics, Psychiatry, and
Epidemiology, University of North Carolina at Chapel Hill, Chapel Hill, NC, USA;
14 Queensland Institute of Medical Research,
Brisbane, QLD,, Australia;
15 Department of Medical Genetics, University
Hospital Maichin Dom, Sofia, Bulgaria;
16 Department of Psychiatry, First Psychiatric
Clinic, Alexander University Hospital, Sofia,
Bulgaria;
17 Molecular and Cellular Therapeutics and RCSI
Research Institute, Royal College of Surgeons in Ireland, Dublin, Ireland;
18 West Berkshire NHS Trust, Reading, UK;
19 West London Mental Health Trust,
Hammer-smith and Fulham Mental Health Unit and St Bernard’s Hospital, London, UK;
20Queen Mary College, University of London and East London and City Mental Health Trust, Royal London Hospital, Whitechapel, London, UK;
21 Department of Mental Health, University of
Aberdeen, Aberdeen, UK;
22Ravenscraig Hospital, Inverkip Road, Greenock,
UK;
23 State University of New York–Upstate Medical
University, Syracuse, NY, USA;
24Washington VA Medical Center, Washington DC,
USA;
25 Department of Psychiatry, Georgetown
Univer-sity School of Medicine, Washington DC, USA;
26 Department of Psychiatry, Virginia
Common-wealth University, Richmond, VA, USA;
27 Department of Psychiatry, Sao Miguel, Azores,
Portugal;
28 Department of Psychiatry, University of
Coim-bra, CoimCoim-bra, Portugal;
29 Current address: Department of Psychiatry,
University of Oxford, Warneford Hospital, Heading-ton, Oxford, UK