Abstract— FIB-DIC ringcore milling is an attractive
semi-destructive method of measuring microscopic residual stress. Ensuring the accuracy and reliability of DIC analysis of sample surface deformation is critical for correct stress quantification, and relies on achieving reliable correlation between tracking sub-windows in the initial and deformed configurations. One way to improve the correlation is by increasing the image contrast using in-chamber deposition of an array of platinum nano-dots in a specific pattern. We carried out a study of the effect of Pt deposition on the accuracy of DIC analysis by comparing the results from the analysis of an un-patterned surface, and that of a Pt-patterned ring-core milling sequence. The results show that the Pt-patterned ring-core leads to a higher quality DIC analysis compared with the non-patterned case. This is demonstrated by the small relative displacement of markers, small marker ‘cleaning’ ratio, and a narrow distribution and high value of the correlation coefficient. Insufficient surface contrast is therefore identified as the main reason for aberrations and errors in DIC analysis: Pt pattern deposition can be used to ensure improved quality and reliability of DIC analysis. Hence, the utilization of Pt patterning is advised for FIB-DIC ring-core method, particularly for samples with smooth surface.
Index Terms— Digital Image Correlation Analysis, FIB-DIC
Ring-core, Pt Deposition
I. INTRODUCTION
ESIDUAL stresses can arise in various processing operations and can affect significantly both the functional and structural performance of materials and systems [1]. It is critically important to develop accurate and
Manuscript received April 01, 2016; revised April 20, 2016. This work was partially supported by EU FP7 project iSTRESS (604646) as well as by EPSRC via grants EP/I020691, EP/G004676 and EP/H003215.
Hongjia Zhang is a PhD student with Department of Engineering Science, University of Oxford, OX1 3PJ, UK. (e-mail: [email protected]).
Siqi Ying is a PhD student with Department of Engineering Science, University of Oxford, OX1 3PJ, UK. (e-mail: [email protected]).
Enrico Salvati is a PhD student with Department of Engineering Science, University of Oxford, OX1 3PJ, UK. (e-mail: [email protected]).
Alexander Lunt is a PhD student with Department of Engineering Science, University of Oxford, OX1 3PJ, UK. (e-mail: [email protected]).
Tan Sui is a postdoctoral research assistant with Department of Engineering Science, University of Oxford, OX1 3PJ, UK. (e-mail: [email protected]).
*Alexander M. Korsunsky is a professor with Department of Engineering Science, University of Oxford, OX1 3PJ, UK. (tel: +44
reliable methods for residual stress measurement in order to evaluate and predict the boundary between safe deformation behaviour and failure of engineering components [2]. Residual stress measurement techniques can be divided into three types: non-destructive methods such as neutron and x-ray diffraction, semi-destructive methods that involve only minimal interference with the overall structure, and destructive methods that involve major material removal or cross-sectioning. Both semi-destructive and destructive methods rely on modifying the boundary conditions and evaluating the subsequent strain relief [2, 3]. Additionally, depending on the length scale interrogated, residual stress measurements may range from macroscopic to mesoscopic and microscopic levels.
With the rapid development of micro-scale applications in areas such as micro-electromechanical systems (MEMS) and nano-electromechanical systems (NEMS), microscopic residual stress measurement is becoming an ever more important requirement for studying residual stresses within miniature systems at the level of individual grains, thin coatings and features [3], e.g. such as micron-thick through silicon vias (TSV’s). However, despite the growing demand, reliable residual stress measurement at microscopic resolution remains a major challenge [4]. Korsunsky et al. proposed a method that combines incremental ringcore milling by focused ion beam (FIB) with scanning electron microscope (SEM) imaging and digital image correlation (DIC) analysis [3, 5, 6]. FIB-DIC ring-core milling allows minimally destructive measurement of residual stress down to the sub-micron scale. The relatively wide availability of electron and ion microscopy means that the technique benefits from easy access compared with synchrotron x-ray and neutron diffraction instruments that have restricted access. With FIB-DIC routine analysis and determination of residual stress becomes possible [2, 3, 7]. In the present paper FIB-DIC ring-core milling was used to study the residual stress state within samples of polycrystalline Mg AZ31B alloy.
Since stress evaluation relies on strain relief quantification, and the latter depends on reliable tracking of surface displacements, ensuring high contrast imaging of the sample surface is essential. There are several ways to increase the sample surface contrast, e.g. creating roughness, depositing precipitates, sputter coating, etching, etc. A popular way to ‘decorate’ the sample surface is to deposit a pattern of platinum nanodots as contrast features [2-9]. Pt deposition provides the advantage of allowing DIC analysis
Effect of Pt Deposition on Digital Image
Correlation Analysis for Residual Stress
Measurement Using FIB-DIC Ringcore Method
Hongjia Zhang, Enrico Salvati, Siqi Ying, Alexander Lunt, Tan Sui and Alexander M. Korsunsky*
were polished to a fine finish (e.g. for EBSD analysis). Nevertheless, no work has been reported devoted specifically to the study of the effect of Pt patterning on DIC analysis in FIB-DIC ring-core analysis.
In this paper we present a study of the effect of Pt patterning on the quality and robustness of DIC interpretation by comparing the tracking quality respectively for unpatterned and Pt-patterned ring-core features.
II. EXPERIMENT A. Ring-core Milling
Material used in the present study was polycrystalline magnesium alloy AZ31B with the grain size between 2μm to 5μm [10]. It was mechanically polished using SiC paper to grit 1200/4000 finish to remove the oxidized layer and to introduce some scratches on the surface to promote contrast improvement.
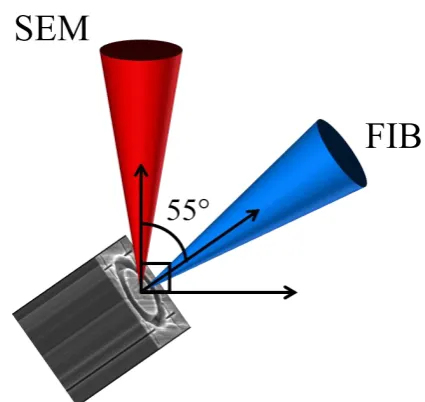
Fig. 1 demonstrates the ring-core milling configuration. By convention, the SEM column is aligned vertically, and the secondary FIB column is tilted at an angle (of 55° in our case) from the SEM column. Sample is also tilted by 55° to present its surface to the FIB at normal incidence [11]. SEM and FIB columns are both focused and aligned to point to the same location at the sample surface to ensure high resolution images could be taken by SEM while FIB is performing incremental milling on the sample surface. Since the images are acquired by the SEM at the oblique angle of 35°, dynamic focusing and tilting correction are used while the images as being acquired.
Fig. 2. illustrates the milling process used for the two ring-core configurations, respectively. Fig. 2.(a) shows the ring-core for which in-chamber Pt pattern deposition was used, and Fig. 2.(b) shows the one without. The inner diameter and annular trench width (Fig. 2.(a) image IV) of both ring-cores were 5μm and 1μm. The two ring-core features were located 10μm apart from each other. Four reference crosses were milled outside the outer circle of each ringcore to aid alignment and drift correction.
Fig. 1. Configuration of SEM and FIB columns for ring-core milling.
The sample surface area within the inner circle corresponds to the gauge volume within which strain relief takes place, and therefore defines the region of interest (ROI) for DIC analysis. FIB was used to remove the material within the trench incrementally: 50 steps in total were recorded with the step size 100nm (for both ring-cores), so that the estimate for the final depth of the trench was ~5μm.
In Fig. 2.(a) and Fig. 2.(b) illustrate a sequence of images collected from the two ring-cores studied. Images shown on the left correspond to Pt-patterned ring-core surfaces that was accomplished using the gas injection system (GIS) that delivered a local flow of volatile organic compound containing Pt, and then electron beam deposited it onto the sample surface. The nanodots are arranged in a pattern of ‘sunflower seeds’ [8] that has the advantage of not containing any repeated motifs translated (shifted) with respect to each other. Images labeled II and III were acquired during milling, whilst the images labeled IV capture the final status.
[image:2.595.321.534.54.255.2](a) (b)
[image:2.595.94.510.545.754.2](a) (b)
[image:3.595.99.499.45.384.2](c) (d)
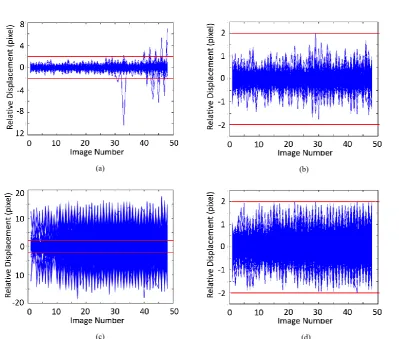
Fig. 3. Relative displacement of each marker with respect to its neighbours, and cleaning process with threshold value of 2 pixels: (a) Pt-patterned ring-core feature before marker ‘cleaning’; (b) Pt-patterned ring-core after ‘cleaning’; (c) non-patterned ring-core before ‘cleaning’; (d) non-patterned
ring-core after ‘cleaning’
10 images were taken for each milling step. Image averaging was performed at the post-processing stage of analysis as each step to obtain one image out of every 10 to reduce noise and improve reliability of analysis. A sequence of 51 images (initial state and images after each of the 50 steps of FIB milling) was obtained for each ring-core.
A. Digital Image Correlation
DIC analysis consists of two steps: the processing step, and the post-processing step. In the experiment described the processing step included two main parts: drift correction and displacement tracking. Drift correction was to correct the SEM image drift through aligning the sequence of images using the unchanging area outside the trench. Displacement tracking was the procedure when displacement in ROI was tracked and strain profile was obtained. Both these tasks were carried out by tracking the displacement of ‘virtual’ DIC markers (called markers in this paper for convenience) located with areas of interest. In this experiment there were in total 4488 markers within ROI for both ring-cores. Post-processing step involved ‘cleaning out’ poorly tracked markers by checking each marker’s relative displacement with respect to its neighbours. Cleaning is done through deleting markers whose relative displacement is larger than a specific value (in units of pixels): when a marker moves significantly further than its neighbours, it normally means that its tracking was somehow deficient. The specific displacement value mentioned above is selected as the cleaning threshold value in the following discussion. Fig. 3.
depicts the marker relative displacement component in the x-direction, as defined in Fig. 2., before and after the cleaning operation with the threshold value of 2 pixels. The horizontal axis in Fig. 3. corresponds to the milling step number.
The correlation coefficient is used in DIC to evaluate the quality of image matching during tracking. It ranges from 0 (no preferred correlation) to 1 (strong correlation). For each tracked marker, the correlation coefficient value is calculated by comparing the current (deformed) image to the original image of the undisturbed sample surface. To examine the reliability and accuracy of DIC tracking, the correlation coefficient value distribution was studied carefully.
III. RESULTS AND DISCUSSION
Fig. 3 illustrates that the tracked markers on the non-patterned ring-core surface were ascribed displacement as large as 15 pixels, whereas for the Pt-patterned ring-core feature the distribution of marker relative displacement was much narrower, mostly lying within 2 pixels. With the cleaning threshold value of 2 pixels adopted, the fraction of markers cleaned (named as marker cleaning ratio) for the Pt-patterned and the non-Pt-patterned ringcore respectively were 0.33% and 40.05%. This indicates that the tracking of a large proportion of markers on the non-deposited ring-core was not correct.
coefficient of for non-patterned ringcore displays a much wider distribution starting from approximately 0.6, while the distribution for the Pt-nanodot patterned ring-core is concentrated within a much narrower range starting from ~0.95. It is fully apparent now that the DIC analysis of the non-patterned ring-core resulted in a much poorer marker tracking quality.
Fig. 4. Histogram of correlation coefficient of all the markers on both of the ringcores
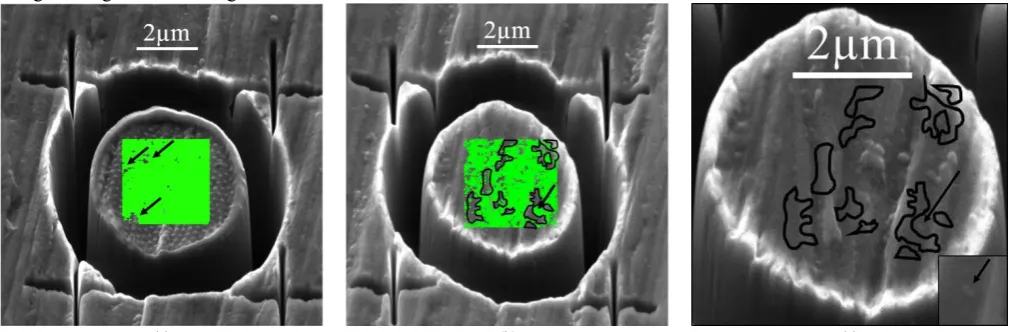
The quality of tracking is dependent on numerous factors i.e. the size of tracking sub-window for each marker, the accuracy of drift correction, and the search distance between markers. However, the most important factor is the contrast of sample surface: it is usually the lack of contrast that leads to poor tracking quality when the sample surface has not been suitably prepared. To study the link between poor tracking quality and the lack of contrast in this case, a comparison of marker distribution after ‘cleaning’ for both ring-core features was made (Fig. 5.). For the Pt-patterned ring-core shown in Fig. 5(a), only a small fraction of markers distributed at several small domains pointed by arrows were removed. On the contrary, several large regions indicated by the black meandering boundary in Fig.5(b) were on the non-patterned ring-core feature surface which had to be removed in the ‘cleaning’ process. Fig. 5.(c) shows a higher magnification image of the central island of the
tracked regions outlined. It is noticeable that all these domains correspond to the locations where the sample surface is ‘smooth’ and has low contrast. At the position where the arrow is pointing in Fig. 5.(b) and (c), no markers were removed, unlike in the surrounding area it where markers were mostly deleted. This is due to the presence of small features at that positon that are shown at high magnification in the bottom right inset in Fig. 5.(c) and indicated by the arrow. The existence of these small features increased the contrast and therefore allowed those markers to be tracked well. This is a direct evidence of the fact that the lack or presence of contrast is the main distinguishing aspect between poor and good tracking quality in DIC analysis. Pt nanodot patterning can clearly play an important role in ensuring the quality of DIC analysis.
IV. CONCLUSION
Two options for FIB-DIC ring-core method implementation were considered, without and with Pt nanodot patterning. FIB milling and SEM image acquisition of sample surface were followed by DIC analysis, and the quality of DIC analysis was evaluated. The results show that DIC analysis of images taken for the Pt-patterned ring-core features returned small marker displacements, small marker cleaning ratio, and a narrow distribution and high value of the correlation coefficient. In contrast, many of the markers tracked at surface of non-patterned ring-core have anomalously large displacements, larger marker cleaning ratio and smaller correlation coefficient with a wider distribution.
It is concluded that the imaging contrast of sample surface is the main issue that affects the marker tracking quality. Pt-nanodot patterning dramatically enhances the surface contrast, and so the DIC analysis quality. It is suggested that Pt patterning can be utilised especially for samples with smooth surface to ensure the reliability and accuracy of DIC analysis.
(a) (b) (c)
[image:4.595.47.552.555.721.2]ACKNOWLEDGMENT
The authors are thankful to the help of providing samples from Xu Song and Kai Soon Fong at Singapore Institute of Manufacturing Technology. We are grateful to Zora Strelcova and Jiri Dluhos (TESCAN Brno, s.r.o., Czech Republic) for their support on operating the Multi-Beam Laboratory for Engineering Microscopy (MBLEM), Dep. of Engineering Science, University of Oxford, UK.
REFERENCES
[1] Noyan, I.C., et al., Residual stress: measurement by diffraction and interpretation. 2013: Springer.
[2] Lunt, A.J., et al., A state-of-the-art review of micron-scale spatially resolved residual stress analysis by FIB-DIC ring-core milling and other techniques. The Journal of Strain Analysis for Engineering
Design, 2015: p. 0309324715596700.
[3] Korsunsky, A.M., et al., Residual stress evaluation at the micrometer scale: analysis of thin coatings by FIB milling and
digital image correlation. Surface and Coatings Technology, 2010.
205(7): p. 2393-2403.
[4] Zhu, R., et al., A micro-scale strain rosette for residual stress
measurement by SEM Moiré method. Science China Physics,
Mechanics and Astronomy, 2014. 57(4): p. 716-722.
[5] Korsunsky, A.M., et al., Focused ion beam ring drilling for residual stress evaluation. Materials Letters, 2009. 63(22): p. 1961-1963.
[6] Sebastiani, M., et al., Depth-resolved residual stress analysis of thin
coatings by a new FIB–DIC method. Materials Science and
Engineering: A, 2011. 528(27): p. 7901-7908.
[7] Lunt, A.J., et al., Intragranular Residual Stress Evaluation Using the Semi-Destructive FIB-DIC Ring-Core Drilling Method.
Advanced Materials Research, 2014. 996.
[8] Salvati, E., et al., Residual Stress Measurement on Shot Peened Samples Using FIB-DIC, in Residual Stress, Thermomechanics & Infrared Imaging, Hybrid Techniques and Inverse Problems,
Volume 9. 2016, Springer. p. 275-283.
[9] Ying, S., et al. On the Cyclic Deformation and Residual Stress in Ni-base Single Crystal Superalloys. in Proceedings of the World
Congress on Engineering. 2014.
[10] Zhang, H., et al. Synchrotron X-ray Diffraction Analysis of Bending Strains in Magnesium Alloy AZ31B Processed by Severe Plastic
Deformation. in Proceedings of the International MultiConference
of Engineers and Computer Scientists. 2016.
[11] Zhang, H., et al. Multi-modal microscopy characterisation of nodal markings in flax fibre. in Proceedings of the World Congress on