The Effects of Energy Efficient Heating Devices on
Business Profit Maximization
Patrick Onotu, Ijike D. Ona, and Uche M. DIMKPAGU, Member, IAENG
Abstract— Energy efficiency is simply using less energy to perform the same work or provide the same service while energy conservation, on the other hand, is using energy only when it is absolutely needed or reducing the use of energy to mitigate waste. The need for energy efficiency and conservation in a business environment cannot be overemphasized. Its impact on the overall availability of active energy delivered to the grid and the financial savings that accrues to the organization thereon make the concept particularly attractive. CUSUM is a statistical tool that is developed to help estimate the effects of energy efficiency and conservation measures implemented in an organization. It indicates any performance changes in the entire system with reference to consumption trend. This is achieved by computing the difference between the baseline (expected) consumption and the actual consumption over the baseline period and used to determine the net savings/losses to date. In this paper, the energy efficiency of two different boilers, based on electric power consumption, were critically analysed using CUSUM technique. The results of the CUSUM analysis showed a significant decrease in electric power consumption after boiler replacement and with significant financial savings that suggest a reasonably short payback period.
Keywords: Energy efficiency, linear regression, CUSUM chart and payback period.
I.INTRODUCTION
HE positive impacts of effective energy conservation and sustainability practice in any business environment cannot be overemphasized: its integration into either a large-scale or small-large-scale business helps save money and the environment at large. Monitoring and Targeting (M&T) is a technique used in energy management to enable an understanding of a company’s energy consumption trend.
Manuscript received April 7, 2016; revised April 11, 2016. This work was carried out based on the data collected from Sheffield Hallam University, United Kingdom.
The Effects of Energy Efficient Heating Devices on Business Profit Maximization.
P. Onotu (Corresponding author, phone number: +2347014086889; e-mail: [email protected]).
I. D. Ona (e-mail: [email protected]) and U. M. DIMKPAGU (e-mail: [email protected]).
All authors are with the Department of Electrical/Electronics Engineering Technology, Akanu Ibiam Federal Polytechnic, Unwana, Eboyi State Nigeria.
It helps to identify critical underlying factors that have significant impacts upon energy consumption and, therefore, a good practice towards the identification of consumption reduction means [1].
In the implementation of M&T, energy consumption data needs to be collected and analysed to provide essential foundation for effective energy management activities leading to the following:
• Detection of avoidable energy waste;
• Quantification of possible energy savings made; • Provision of empirical feedback for energy managers; and
• The ability to set performance targets.
In a successful M&T, a good estimation or prediction of expected consumption in comparison with real values is very vital. This can be achieved by either precedent-based forecasting or activity-based targeting. Carbon Trust stated that the activity-based targeting is most effective and involves the computation of expected consumption with reference to the driving factors [1]. It is most preferable that a linear relationship exist between these two variables for better predictions. Once a characteristic performance line describing this relationship has been determined, a CUSUM analysis can then be performed to evaluate the effectiveness of any changes made to save energy.
This work presents critical analysis of the effects of two types of electric boilers on the power consumption rate of a hotel with guest-days as the driving factor. The power consumption of the first boilers installed in the year 2012 was recorded from January to December. The power consumption of the second boilers installed in the year 2013 were also recorded for the same period and compared to establish variations in the energy efficiency of both boilers and the financial implications.
II.CUSUM ANALYSIS
general, CUSUM chart shows the cumulative sum of deviations of predicted data from a real process data based on linear regression [4].
A.CUSUM Analysis on the Collected Data
Data collected and presented in table 1 reflect the electricity consumption in kWh and the corresponding guests per day (guests-days). The guests-days represent the inputs (independent variable x) while the electricity consumption represent the outputs (dependent variable y). These variables were plotted in a scatter diagram and shown in figure 1 below. This was to enable visual confirmation of the type of relationship that exist between x and y. The range of values was limited to a year before boiler upgrade.
Fig. 1. Scatter diagram of data for the year 2012 (before boiler upgrade).
Figure 1 shows that there is a considerable linear relationship between the guests-days and the corresponding electricity usage. It shows an increase in usage as the number of guest increases but in a random manner. To establish an equation describing this linear characteristics, the gradient (m) and intercept (c) of the standard linear equation (1) are first computed from equations (2) and (3) respectively.
y = mx + c
m = nΣ xy − ΣxΣy
nΣ x2 − Σx 2 2
c =Σy − mΣx
n (3)
The sums of x, y, x^2, xy and y^2 as computed and presented in table 1 are:
Σx=1,040; Σy=46,858; Σ(xy)=2,083,790; Σ(x^2 )=47,956; and Σ(y^2 )=93,359,974.
Substituting these values into equations (2) and (3) for the first 24 days (n = 24) will yield:
TABLE I. DATA COLLECTED BEFORE UPGRADE
Date
Occupancy
X(Guests-days)
Electricity Usage
Y(kWh) XY X^2 Y^2
01/01/12 30 1800 54000 900 3240000
15/01/12 40 2122 84880 1600 4502884
01/02/12 44 2128 93632 1936 4528384
15/02/12 36 1581 56916 1296 2499561
01/03/12 43 1790 76970 1849 3204100
15/03/12 48 1815 87120 2304 3294225
01/04/12 60 2202 132120 3600 4848804
15/04/12 64 2226 142464 4096 4955076
01/05/12 57 2145 122265 3249 4601025
15/05/12 40 1918 76720 1600 3678724
01/06/12 33 1765 58245 1089 3115225
15/06/12 49 2563 125587 2401 6568969
01/07/12 26 1606 41756 676 2579236
15/07/12 41 2154 88314 1681 4639716
01/08/12 42 1986 83412 1764 3944196
15/08/12 28 1374 38472 784 1887876
01/09/12 38 1699 64562 1444 2886601
15/09/12 46 1739 79994 2116 3024121
01/10/12 59 2230 131570 3481 4972900
15/10/12 60 2164 129840 3600 4682896
01/11/12 55 2235 122925 3025 4995225
15/11/12 32 1599 51168 1024 2556801
01/12/12 29 1802 52258 841 3247204
15/12/12 40 2215 88600 1600 4906225
Sum of
Columns 1040 46858 2083790 47956 93359974
m = 24 ∗ 2,083,790 − 1040 ∗ 46,858 24 ∗ 47,956 − 1040 2
=50,010,960 − 48,732,320 1,150,944 − 1,081,600
=1,278,640 69,344
Hence, m=18.43908629kWh/Guest-day.
And from equation (3)
c =46858 −(18.43908629 ∗1040)
24 =
46,858−19,176.64974
24 =
27,681.35026
24
c = 1153.389594kWh
.
Hence, the intercept (c) is a constant representing the electricity usage in kWh at zero guest-days which is the minimum standing (or fixed) usage. If this intercept is assumed zero, then the gradient (m) represent the specific energy usage (kWh/guest-day).
The linear characteristic equation describing the relation in the data of figure 1 can then be written as
y = 18.43908629x + 1153.389594 (4)
The coefficient of determination, R-squared, of the line can be evaluated as
R = nΣ xy − ΣxΣy
nΣ x2 − Σx 2 ∗ nΣ y2 − Σy 2 (5)
0 500 1000 1500 2000 2500 3000
0 20 40 60 80
EL
ECTRICIT
Y
USAGE
(KW
H)
R = (24∗2,083,790)−(1,040∗46,858)
(24∗47,956)−(1,081,600) ∗ (24∗93,359,974)−(468582)
R = 50,010,960−48,732,320
69,344 ∗ 44,967,212 =
1,278,640
1,765,844.373= 0.72409552
therefore, R2= 0.52431
[image:3.595.47.565.62.785.2]
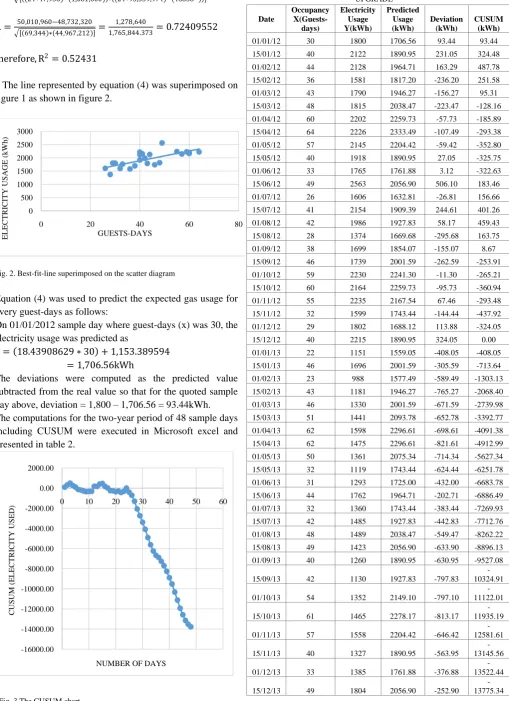
The line represented by equation (4) was superimposed on figure 1 as shown in figure 2.
Fig. 2. Best-fit-line superimposed on the scatter diagram
Equation (4) was used to predict the expected gas usage for every guest-days as follows:
On 01/01/2012 sample day where guest-days (x) was 30, the electricity usage was predicted as
y = 18.43908629 ∗ 30 + 1,153.389594 = 1,706.56kWh
The deviations were computed as the predicted value subtracted from the real value so that for the quoted sample day above, deviation = 1,800 – 1,706.56 = 93.44kWh. The computations for the two-year period of 48 sample days including CUSUM were executed in Microsoft excel and presented in table 2.
[image:3.595.52.562.80.782.2]Fig. 3 The CUSUM chart
TABLE II. DATA COLLECTED BEFORE AND AFTER BOILER UPGRADE
Date
Occupancy
X(Guests-days)
Electricity Usage Y(kWh)
Predicted Usage (kWh)
Deviation (kWh)
CUSUM (kWh)
01/01/12 30 1800 1706.56 93.44 93.44
15/01/12 40 2122 1890.95 231.05 324.48
01/02/12 44 2128 1964.71 163.29 487.78
15/02/12 36 1581 1817.20 -236.20 251.58
01/03/12 43 1790 1946.27 -156.27 95.31
15/03/12 48 1815 2038.47 -223.47 -128.16
01/04/12 60 2202 2259.73 -57.73 -185.89
15/04/12 64 2226 2333.49 -107.49 -293.38
01/05/12 57 2145 2204.42 -59.42 -352.80
15/05/12 40 1918 1890.95 27.05 -325.75
01/06/12 33 1765 1761.88 3.12 -322.63
15/06/12 49 2563 2056.90 506.10 183.46
01/07/12 26 1606 1632.81 -26.81 156.66
15/07/12 41 2154 1909.39 244.61 401.26
01/08/12 42 1986 1927.83 58.17 459.43
15/08/12 28 1374 1669.68 -295.68 163.75
01/09/12 38 1699 1854.07 -155.07 8.67
15/09/12 46 1739 2001.59 -262.59 -253.91
01/10/12 59 2230 2241.30 -11.30 -265.21
15/10/12 60 2164 2259.73 -95.73 -360.94
01/11/12 55 2235 2167.54 67.46 -293.48
15/11/12 32 1599 1743.44 -144.44 -437.92
01/12/12 29 1802 1688.12 113.88 -324.05
15/12/12 40 2215 1890.95 324.05 0.00
01/01/13 22 1151 1559.05 -408.05 -408.05
15/01/13 46 1696 2001.59 -305.59 -713.64
01/02/13 23 988 1577.49 -589.49 -1303.13
15/02/13 43 1181 1946.27 -765.27 -2068.40
01/03/13 46 1330 2001.59 -671.59 -2739.98
15/03/13 51 1441 2093.78 -652.78 -3392.77
01/04/13 62 1598 2296.61 -698.61 -4091.38
15/04/13 62 1475 2296.61 -821.61 -4912.99
01/05/13 50 1361 2075.34 -714.34 -5627.34
15/05/13 32 1119 1743.44 -624.44 -6251.78
01/06/13 31 1293 1725.00 -432.00 -6683.78
15/06/13 44 1762 1964.71 -202.71 -6886.49
01/07/13 32 1360 1743.44 -383.44 -7269.93
15/07/13 42 1485 1927.83 -442.83 -7712.76
01/08/13 48 1489 2038.47 -549.47 -8262.22
15/08/13 49 1423 2056.90 -633.90 -8896.13
01/09/13 40 1260 1890.95 -630.95 -9527.08
15/09/13 42 1130 1927.83 -797.83 -10324.91
01/10/13 54 1352 2149.10 -797.10 -11122.01
15/10/13 61 1465 2278.17 -813.17 -11935.19
01/11/13 57 1558 2204.42 -646.42 -12581.61
15/11/13 40 1327 1890.95 -563.95 -13145.56
01/12/13 33 1385 1761.88 -376.88 -13522.44
15/12/13 49 1804 2056.90 -252.90 -13775.34 0
500 1000 1500 2000 2500 3000
0 20 40 60 80
EL
ECTRICIT
Y
USAGE
(kWh)
GUESTS-DAYS
-16000.00 -14000.00 -12000.00 -10000.00 -8000.00 -6000.00 -4000.00 -2000.00 0.00 2000.00
0 10 20 30 40 50 60
CUSUM
(E
LE
CTRICITY
USED)
The CUSUM chart of figure 3 shows that the CUSUM was varying around a zero mean until the upgrade of the boiler, then there was a sharp deviation from the target beginning from sample day 25 (01/01/013). The CUSUM recorded at the 48th day from figure 3 is -13775.34kWh which also corresponds with the last CUSUM column entry of table 2. The negative sign shows that the value represents total savings made.
B.Financial Savings Achieved
The average consumption per month for the year 2013 is given as
Sum of usage per month Total number of months=
33433 12
= 2786.083kWh month
Therefore, the average consumption is approximately 3000 kWh/month which places the hotel in the industry category. A business quote based on this estimate as provided in the Enugu Electricity Distribution Company (EEDC) industry tariff is ₦30/kWh (excluding VAT) [5]. Then the total savings achieved by the boiler upgrade can be estimated to be
13775.34 * 30=₦413,260.20k.
The total savings per month is therefore:
413,260.20
12 = ₦34,438.33k/month
C.Limitation of the CUSUM Analysis
The coefficient of determination is the proportion of variance defined by a regression model: it a useful measure of how good a predicted dependent variable is from an independent variable [6]. In other words, R-squared determines the success of prediction. Its value lies between 0 and 1 and the closer it is to 1 the better the prediction. R-squared has also been described as a statistical measure of how close a set of data points are to the fitted regression line [7].
From the visual assessment of figure 2, it clear that the data points are poorly distributed around the trend line. This is reflected on the value of R-squared from equation (5) which is R2 = 0.52431. The predictions are therefore quite poor and CUSUM analysis may have presented erroneous savings achieved. But it has helped establish the possibility of savings from the boiler upgrade.
D.Payback Period
The payback period is the length of time required for an investment to recover its initially committed capital with regards to net savings. It is widely used to assess attractiveness of energy efficiency products because it is simple and straightforward and a function of energy price, product cost and net annual energy savings [8].
The limitations are that the time value of money, profitability (returns beyond the payback period) and opportunity cost are not taken into consideration. The effect of the time value of money can be rectified by using discounted payback period which involves evaluating the payback period for when the accumulated present value of the cash flows covers the initial investment cost [9].
The total cost of boiler upgrade is about ₦500,000. Therefore, for a consistent estimated savings of ₦34,438.33k/month, the payback period is calculated as
Payback period =initial investment cost net savings per period =
500,000 34,438.33 ≅ 14.5months
III.CONCLUSION
The need for effective energy conservation through the utilization of energy efficient devices and sustainability practice in any business environment has been clearly discussed. The use of Monitoring and Targeting technique in energy management to identify critical underlying factors that provide significant consumption reduction means has been critically analysed. CUSUM technique has been used as an M&T tool to analyse the electricity consumption data provided. The inherent limitation of CUSUM approach has also been highlighted.
The results of the CUSUM analysis revealed that total savings of 13775.34 kWh is achievable after a boiler upgrade. An investment of ₦500,000 that is capable of significantly reducing the electricity consumption rate for a net savings of ₦34,438.33k/month in a business environment can be considered profitable. The estimated possibility of a total capital recovery in 14.5 months of operation makes it an excellent investment in both short term and long term business plans. In the light of the above, it is highly recommended that business organizations consider employing the services of energy managers for efficient utilization of all kinds of electromechanical appliances. This singular policy, if implemented effectively, could be a cheaper approach to profit maximization.
REFERENCES
[1] Carbon Trust, Monitoring and Targeting: Techniques to help organizational energy management. In-Depth Management Guide. [Online]. Retrieved 2st May, 2015, From http://www.carbontrust.com/media/31683/ctg008_monitoring_and_ta rgeting.pdf
[2] E.S. Page, “Continuous inspection schemes,” Biometrika. Vol. 41, 1954, Pp 100-115.
[3] B. Steve, and C. Mark, “The use of the CUSUM technique in the assessment of trainee competence in new procedures,” International Journal for quality in health care. Vol. 12, No. 5, 2000, pp. 433-438.
[5] Enugu Electricity Distribution Company, “Comparable business quotes for industries,” [Online]. Retrieved 3rd June, 2015, from: http://www.nercng.org/index.php/myto- 2/discos
[6] N.J.D. Nagelkerke, “A note on general definition of the coefficient of determination,” Biometrika. Vol. 78, No. 3. United Kingdom: Biometrika Trust, April 1991.