E q u i t y and the U K National Health Service:
A Review of the Evidence
CAEOL PROPPER University of Bristol
Abstract: I n recent years, there h a s been considerable interest i n the distribution of h e a l t h care and finance in the U K . T h i s paper reviews the accumulating evidence. I t discusses the empirical m e a s u r e s of equity used i n the various studies a n d the issues involved i n the e m p i r i c a l construction of these measures. T h e m a i n findings on both the delivery a n d finance side are presented and a n extension of these cross-sectional analyses to a n investigation of the lifetime equity in delivery and finance based on data from a micro-simulation model is discussed.
I INTRODUCTION
E
quity is widely acknowledged to be an important policy objective i n the health care field. Concern over equity is a prominent issue i n discus sions of health care reform i n many OECD and non-OECD countries. But despite the high profile given to equity by policy makers, u n t i l recently there has been comparatively little research into the equity of particular systems of health care financing and delivery. I n recent years, there has been increasing interest i n equity and health care and a series of papers have discussed both the appropriate equity concepts and the extent to which equity goals are met i n practice.Second, they are empirical studies and attempt to test whether equity goals are met i n practice. Third, they use large-scale nationally representative data sets i n order to carry out these tests. The issues raised w i t h respect to these papers include the appropriate normative goals for equity i n the allocation of health care, the policy goals, the construction of empirical tests of equity, and the strengths and weaknesses of available data and the results derived. Section I I of the paper examines equity i n the distribution of health care resources. Section I I I examines the rather smaller body of evidence on equity i n the distribution of finance for health care. Section I V presents results from an attempt to extend the examination of cross-sectional distributions of health care resources and financing to an analysis of lifetime distributions. The final section raises issues for further research.
I I EQUITY I N THE DELIVERY OF HEALTH CARE The Equity Goal
To investigate whether an equity goal for the delivery of health care is being met, i t is necessary first to define the relevant equity goal. There is currently considerable discussion of the normative question of what ought to be the appropriate equity goal of a health-care system. Culyer and Wagstaff (1993) have argued t h a t equity i n the delivery of health care is an inappropriate goal for public policy. Health care, they argue, is only a means to an end, a way of maintaining health capital. And health care is only useful i n this end when the health care provided is effective. Therefore equity i n the allocation of health care, without regard to the efficiency of, or the need for, this care, is not a helpful policy aim. But even the pursuit of allocation according to need, by which Culyer and Wagstaff mean equality of health care for equal need and inequality of health care for unequal need, may be an inappropriate goal. First, Culyer and Wagstaff show that "allocation accord ing to need" can give rise to different distributions of health care depending which of several definitions of need is adopted. But second, and more impor tantly, they argue th'at the appropriate goals for equity i n health care should be the distribution of health care i n order to equalise health. I f this is accepted as the appropriate goal, then the pursuit of equity i n the delivery of health care according to need may actually be counterproductive. Irrespective of how need is defined, equality of health w i l l not be achieved i f persons i n equal need are treated the same and persons i n unequal need are treated i n proportion to the relevant inequalities.
allocation of health care (van Doorslaer, et al., 1992). While accepting that NHS policy statements tend to be rather vague, one widely quoted equity goal of the NHS is "allocation of health care according to need" (O'Donnell, et al., 1993). Most empirical studies have sought to establish the extent to which this goal is met. Mooney, et al. (1991) have argued that all these empirical studies are misguided because equal treatment for equal need is an inappro priate policy notion. The appropriate notion, they argue, is that of "equality of access". "Equal treatment for equal need" overrides individual preferences, while equalising the costs of access allows individuals to exercise these preferences facing the same price. While again i n normative terms, equality of access might be (an) appropriate notion, i t is far from clear that equality of access is either what is embodied i n policy or is a concept that can be easily measured. I n terms of policy, Le Grand (1982) has argued that some British policy documents seem to imply a commitment to equality of treatment for those i n equal need, others a commitment to equality of access and yet others a commitment to equality of health. The same is true of several other OECD countries (van Doorslaer, et al., 1992). Mooney, et al.'s claim that "equality of access" is the policy goal does not appear to be supported by the policy statements that do exist. For empirical purposes, measurement of the extent of equality of access would require data to be gathered for this specific purpose. Some of the costs of access, such as travel costs and waiting time, and co-payments for pharmaceuticals are relatively easily measured. Acton (1975), for example, has undertaken a study of travel time costs for the USA. To these costs would have to be added other costs, such as the opportunity cost of time taken off work and also psychic costs of worry etc. While this could be attempted i f suitable data were available, no such data has been or presently is i n the public domain and no U K large-scale studies of equality of access have been undertaken.
This paper therefore concentrates on attempts to establish whether there is equity i n the U K allocation of health care, equity being defined as "allo cation according to need". This equity goal is a horizontal equity goal. The achievement of horizontal equity requires that individuals defined as equal should be treated1 as equal. The characteristics of any individual can be
income, socio-economic group or any other measure of ability to pay thus represent departures from this goal. Thus an empirical test of whether the goal is met is whether, after controlling for differences i n need, there are systematic differences i n the amount of care received by persons of different ability to pay. This requires an empirical definition of (a) need, (b) ability to pay and (c) a measure of the extent of (in)equity.
The Definition of Need
There are many possible measures of need. However, all the studies which have examined the distribution of NHS care relative to need and income or socio-economic status across the whole of the U K population have had to rely on a single source of data — the General Household Survey (GHS). The GHS is an annual cross-sectional survey of the U K population and is the only data set which contains measures of ability to pay, measures of health care u t i l isation and measures of need. The GHS contains four self-assessed measures of ill-health (morbidity). These four measures are argued to represent dif ferent facets of need (Blaxter, 1990). They are recorded not as continuous variables but as dummy variables. Individuals give a yes or no reply to four questions about their health. I n empirical analysis, such variables can either be treated as representing an underlying variable which is truly dichotomous or as a measure of a continuous latent variable. Two of the first studies of the distribution of health care (Foster, 1976 and Le Grand, 1978) treated these measures as representing underlying dichotomous variables. The method ology they used to assess equality of treatment (discussed below) is equiva lent to an assumption that individuals who stated that they had no morbidity have no medical need. Later studies (Evandrou, et al., 1992; O'Donnell and Propper, 1991; Propper and Upward, 1992) treated these variables as dichoto mous indicators of a; latent variable, i n which a zero indicated a lower level rather than no need. However, regardless of whether a negative reply is taken to indicate no need, or simply a lower level of need than a positive response, dichotomous indicators convey relatively little information about the underlying latent variable need. The associated research problem is that results may be sensitive to arbitrary assumptions about the relationship between the dichotomous indicator and the underlying latent variable.
The Definition of Ability to Pay
been widely used i n studies of inequalities i n part because the single measure occupational group is highly correlated w i t h a group of other intercorrelated variables, including income, tenure and political attitudes. However, this advantage may t u r n out to be a disadvantage when comparisons over time are sought. I f occupations change over time, so w i l l the numbers i n each class. I t is therefore difficult to compare trends i n class-related events.1 I n
addition, the nature of the correlations between variables may change over time, so that i t is not clear what the variable class is actually measuring.2
Even i n a static setting, i f inequality is found i n the distribution of health care across socio-economic groups, there is no way of knowing which of the variables, class is a proxy for are associated w i t h this inequality. The use of income avoids this drawback. However, all the measures of income used i n studies of the distribution of health care have been current income. This w i l l be composed of transitory and permanent components which cannot be disentangled using cross-sectional data. The larger the transitory component, the more misleading current income may be as a measure of ability to pay.
The Empirical Measure of Equity
Any study of equity i n the allocation of health care according to need requires a measure of this allocation. I t is possible to test for differences i n the allocation of health care across income or class by undertaking m u l t i variate analysis controlling for need. This approach was taken by Puffer (1987) and Evandrou, et al. (1992) for example. Studies which have focused on investigation of equity per se have tended to construct summary measures of departures from proportionality i n the allocation of health care by ability to pay group. Forster (1976) and Le Grand (1978) defined this measure as the ratio of health service utilisation to need within an ability to pay group. More formally, i f there are only two need groups, one w i t h positive need and the other w i t h no need, and there are j ability to pay groups, the measure is
( X j + x ^ / n j (1)
where Xj = health care utilisation by those w i t h need i n group j x^j = health care utilisation by those with no need i n group j nj = number i n need i n ability to pay group j
Implicit i n (1) is an assumption that a value of zero for the dichotomous indicator of medical need implies the individual has zero need.
L T h i s has been a problem for research on inequalities i n health.
2. F o r example, for investigation of mortality, most deaths occur outside the age ranges to which social class classification may be confidently applied ( L e G r a n d , 1993).
Collins and Klein (1980) examined the variation i n utilisation of a single service (use of General Practitioner Services) by individuals of a given need across ability to pay groups. They compared the two ratios
X j / n j and x • / n • (2)
across j ability to pay groups.
O'Donnell and Propper (1991) and Wagstaff, et al. (1991) have shown that i f need is distributed non-randomly by ability to pay group the empirical results w i l l differ according to whether measure (1) or (2) is used. Propper and Upward (1992) and O'Donnell, et al. (1993) used a generalisation of (2) suggested by Wagstaff, et al. (1991). A natural extension to (2) is to calculate a weighted sum across need groups, where the weights are the incidence of need of each type i n the population. The measure is:
£m( xm j/ nm j) nm/ N (3)
where nm = number i n sample i n need group m
xmj / nm j = average utilisation of health care by those i n need group
m and ability to pay group j N = total sample size.
Each of these three measures embodies a value judgement about the weight to be attached to each form of need. I n addition, all three measures are based on the assumption that there is no systematic variation i n extent of need within a need category.
Empirical Findings
Data from the early 1970s appeared to indicate that the NHS was not allo cating health care according to need. Forster (1976) found that the utilisation of publicly-funded health care was positively associated w i t h class for men, though not for women. Using the same methodological approach and data for 1972, Le Grand concluded that the top two socio-economic groups received 40 per cent more health care per person reporting sick than the bottom two socio-economic group's. But later research using more recent data, a variety of definitions of need and different measures of equity reached different conclusions. Collins and Klein (1980), Puffer (1987), Evandrou, etal. (1992) and O'Donnell and Propper (1991) all found considerably smaller and less systematic departures from horizontal equity.
was not possible to disentangle changes over time i n the distribution of health care standardised for need from differences i n methodological approach. I n an attempt to control for differences i n methodological approach, Propper and Upward (1992) used a l l three measures (1), (2) and (3) to examine the distribution of health care standardised for need across income group for four years between 1974 and 1987. I n common w i t h earlier work they used the GHS as the data source. Their results indicated that regardless of the measure of equity used, the hypothesis of differential allocation across income groups was not supported by the data. Table 1 presents their results using Equation (3) to derive percentage shares of NHS health care expen diture standardised for need.3
Table 1: Percentage Shares of Standardised NHS Expenditure 1974-1987
Income Quintile 1974 1982 1985 1987
Bottom 24.6 22.5 22.7 22.7
2nd 21.6 20.3 22.7 21.2
3rd 19.3 21.1 19.7 19.9
4th 17.9 21.7 18.9 19.8
5th 16.6 14.5 16.1 16.3
Concentration index -0.083 -0.092 -0.070 -0.062
Source: Propper and U p w a r d (1992).
The table shows the percentage share of NHS expenditure adjusted for the need received by each income quintile.4 The concentration index presented at
the bottom of each column is a summary measure of the extent of departure from proportionality i n the allocation of medical care standardised for need (Wagstaff, et al., 1991). The index is bounded between - 1 and 1. A positive value indicates a regressive distribution, a negative value a progressive distribution. The magnitude of this index is very similar i n all the columns of Table 1 and indicates little departure from horizontal equity. The signs of these indices indicates that i f there is any departure from horizontal equity i t is not "pro-rich" but "pro-poor".5 The authors also repeated the Le Grand
(1978) analysis using socio-economic groups as a measure of ability to pay and found no systematic variation i n the allocation of care across groups.
Van Doorslaer, et al. (1992) compared the equity of health care delivery i n eight OECD countries using the methodology of Equation (3). This study 3. T h e methodology used also controlled for differences i n the demographic composition of different income groups.
4 A l l the analysis is undertaken using micro-data.
found that the U K distribution is less progressive than that of several other countries and is similar to Spain and the USA.6 However, there appears to be
no obvious relationship between cross-country differences and health-care delivery systems.
I l l EQUITY I N THE FINANCE OF HEALTH CARE
There have been fewer studies of the distribution of payments for health care t h a n of health care utilisation, but i n the last 10 years increasing attention has been devoted to finding out who pays for health care. I n part, the distribution of payments for health care is of concern because i t affects the utilisation of health care. For example, i n health-care systems i n which co-payments are used there is concern that the use of such payments w i l l l i m i t the use of the poorest, who are precisely those individuals who are most i n need of health care. But the widespread search for financing measures to l i m i t the growth i n health care costs (Hurst, 1992) has also prompted a concern for the distributional impact of different forms of health care financ ing. Regardless of the impact of finance on utilisation, a health-care-financing system which required the greatest contributions from the poorest members of society may not be regarded as desirable.
Studies of the distribution of finance, for Britain and elsewhere, have taken as their starting point the premise that health care ought to be financed according to ability to pay (for example, Gottshalk, et al., 1989; Hurst, 1985). But as Wagstaff and van Doorslaer (1993) point out, there are two distinct equity concepts w i t h i n this premise. The first is the concept of vertical equity (the requirement that individuals or families of unequal ability to pay make appropriately dissimilar payments for health care) and the second is the concept of horizontal equity (that individuals or families who are defined as of equal ability to pay make the same contributions). I n systems i n which health care is financed through a combination of public and private insurance, pay-roll taxation, general taxation and out-of-pocket pay ments, an individual's payments for health care can depend upon, inter alia, their employment status, their marital status, their age and their income. I n these systems, the issue of horizontal equity is likely to be particularly impor tant. While both concepts of equity are applicable to the distribution of health care financing, the empirical research undertaken to date has examined vertical and not horizontal equity. This section therefore examines only the issues i n the analysis of vertical equity and the U K results.
Definition of Equity
Measurement of vertical (and horizontal) equity requires a definition of ability to pay. As noted above, empirical analyses of the distribution of health care have used class as well as income as a measure of ability to pay, but empirical studies of the financing side have only used income. Income is the measure most generally used i n analyses of the equity of tax systems. Income has the advantage over occupation that summary measures of departures from equity such as those used i n the analysis of equity i n the distribution of taxation can be computed. These allow different distributions to be compared, both across time and across country. However, which definition of income should be used? Should i t be pre-tax or post-tax income? Pre-tax income may be measured as original income or a gross income. The first includes a l l sources of income which are not provided by the state. The second includes transfers to individuals from the state (such as pension payments) but excludes transfers by individuals to the state, i.e. taxes. Post-tax (disposable) income includes these transfers as well. Should income be adjusted for family or household composition to derive an estimate of per capita ability to pay?
Measurement of vertical equity requires a definition of differential treat ment of unequals. Should the relationship between ability to pay and pay ments for health care be progressive, so that individuals w i t h greater ability to pay, pay more i n proportional terms? I f progressive, how progressive should the yardstick be? Or should the definition be one of proportionality? Or is a regressive system i n which all individuals pay the same for their health care, regardless of their ability to pay, the appropriate yardstick? As Wagstaff and van Doorslaer (1993) point out, typically policy statements do not address such issues.
I n practice, empirical studies are limited by data availability. I n defining income, U K studies have used disposable income,7 gross income,8 and gross
income adjusted for family composition, using weights that are derived from estimation of equivalence scales.9 And i n the absence of a clear yardstick
defined by policy, researchers have generally, either explicitly or implicitly, examined departures from proportionality. I n other words, they have sought to answer the question, do individuals across the income distribution all pay the same proportion of their income to finance health care, or do richer individuals pay more or less?
7. F o r example, Gottshalk, et al. (1989). 8. F o r example, O'Donnell, et al. (1993).
Empirical Measure of Equity in Financing
One method of examining departures from proportionality is to tabulate shares of income received and health care payments made by income decile and compare these. While illustrative, this approach does not allow comparison of the progressivity of sources of finance between health care systems or i n the same health care system over time. To do this requires calculation of a summary measure of progressivity. Wagstaff, et al. (1989) suggested the use of the same summary indices as are used i n the literature on tax progressivity to assess the distribution of taxes relative to income (Lambert, 1989), to assess the distribution of health-care payments. They suggest two indices. Both are based on the difference between the distribu tion of income and the distribution of health care finance. Both are measures of the extent of departure from proportionality i n the distribution of health care finance relative to income. The Kakwani index weights all departures from proportionality equally while the Suits index gives greater weight to departures from proportionality that occur among higher income groups than to departures occurring amongst lower income groups. A negative value for both indices indicates a regressive distribution, a positive value a progressive distribution.1 0 A useful property of both indices is that the overall index for
two or more taxes (types of health-care financing) is the weighted average of the indices for the individual components, where the weights are the proportions of the taxes (types of health care financing) i n total tax (health care financing) revenue.1 1
Empirical Findings
I n the U K the majority of health care is financed through taxation and provided by the N H S . I n 1985 for example, publicly financed NHS expenditure accounted for 76.5 per cent of total expenditure on health (OHE, 1987). A l l of this expenditure is raised through general taxation. (User charges for NHS services are treated as private payments and account for only 3 per cent of total NHS financing.) The share of public finance i n health care i n the U K is one of the highest i n the OECD (OECD, 1989). Gottshalk, et al. (1989) examined the distribution of health care finance i n relation to the distribution of post-tax income i n the U K , American and Dutch health care systems. The results (reproduced i n Table 2) show the U K system to be more progressive than that of the other two countries. Individuals i n the poorest
10. T h e K a k w a n i index ranges from - 2 . 0 (when a l l the pre-tax income is concentrated i n the hands of the richest person and the entire health care financing burden falls on someone else) to 1.0 (when the pre-tax income i s distributed equally and the entire financing burden falls on one person). T h e Suits index ranges from - 1 . 0 (when the entire health care financing burden falls on the poorest person) to 1.0 (when the entire financing burden falls on the richest person).
decile of after-tax income received 2.7 per cent of total disposable income and contributed 1.7 per cent of health service finance (paid 1.7 per cent of allo cated taxes). The highest decile had 23.7 per cent of disposable income and contributed 25.6 per cent of health service finance. The implicit definition of equity i n this analysis is allocation of finance proportional to (post-tax) income. Given this null, the U K system for 1981 is progessive. A similar study by Hurst (1985) also concluded the U K system was progressive.
Table 2: Comparison of Distribution of Health Care Financing: USA, UK, The
Netherlands, 1981
Distribution of Post-tax Income Distribution of Health Care Financing
The The Decile USA UK Netherlands USA UK Netherlands
1 1.4 2.7 0.4 3.9 1.7 1.9
2 2.9 4.0 5.2 4.9 2.5 4.3
3 4.4 5.3 6.6 5.5 4.0 6.1
4 5.7 6.8 7.9 7.0 6.2 8.3
5 7.1 8.2 8.9 8.6 7.9 8.3
6 8.5 9.6 10.1 9.7 9.8 11.5
7 10.1 11.1 11.5 10.9 11.5 12.3
8 11.9 13.0 13.1 12.8 13.5 13.9
9 14.9 15.6 15.5 15.0 17.1 15.4
10 33.1 23.7 20.8 21.8 25.6 16.7
Source: Gottshalk, etal. (1989).
O'Donnell, et al. ( 1 9 9 3 ) used the summary measures suggested by Wagstaff, et al. (1989) to estimate the proportionality of the U K health care financing system. I n carrying out this analysis, O'Donnell, etal., attempted to allocate more forms of health care payments than previous research. For each form of health care payment they calculated Kakwani and Suits' indices and then used the "adding up" property of these indices to estimate the pro-gressivity of the total distribution of health care finance.
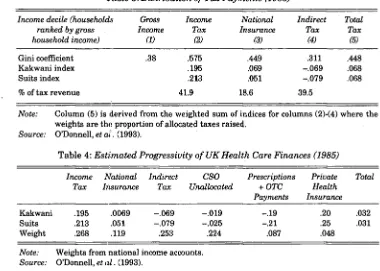
The U K Central Statistics Office (CSO) publishes annual tables showing the distribution of the tax burden by gross household income decile (not adjusted for household composition).1 2 Table 3 presents the summary indices
for all taxes allocated by the CSO. The final column of the table shows these taxes are close to progressive. These taxes account for about 74 per cent of all U K taxes paid by U K residents, so O'Donnell, et al., use the findings of
O'Higgins and Ruggles (1981) on the incidence of the remaining 26 per cent of taxes, and data on the distribution of prescriptions, payments for over-the-counter medicines premia for private health insurance to derive a "guesti-mate" for the overall distribution of health-care financing. This is given i n Table 4 and shows the impact of adding sources of finance other than the taxes allocated by the CSO is to reduce the value of progressivity indices by around 50 per cent. The overall conclusion is that the distribution of total U K health care is slightly progressive.1 3
Table 3: Distribution of Tax Payments (1985)
Income decile (households Gross Income National Indirect Total ranked by gross Income Tax Insurance Tax Tax
household income) (1) (2) (3) (4) (5)
G i n i coefficient .38 .575 .449 .311 .448
K a k w a n i index .195 .069 -.069 .068
Suits index .213 .051 - . 0 7 9 .068
% of tax revenue 41.9 18.6 39.5
Note: C o l u m n (5) is derived from the weighted s u m of indices for columns (2)-(4) where the weights are the proportion of allocated taxes raised.
Source: O'Donnell, et at. (1993).
Table 4: Estimated Progressivity of UK Health Care Finances (1985)
Income National Indirect CSO Prescriptions Private Total Tax Insurance Tax Unallocated + OTC Health
Payments Insurance
K a k w a n i .195 .0069 -.069 - . 0 1 9 -.19 .20 .032
Suits .213 .051 - . 0 7 9 -.025 -.21 .25 .031
Weight .268 .119 .253 .224 .087 .048
Note: Weights from national income accounts. Source: O'Donnell, et al. (1993).
This U K distribution of health-care financing appears to be relatively equitable when compared to that of several other OECD countries. Using the same methodology Wagstaff, et al. (1992) found that tax financed health care systems (the U K , Denmark, Ireland and Portugal) tend to be mildly progressive, while social insurance systems (France, The Netherlands, Spain) and predominantly private insurance systems (USA, Switzerland) tend to be regressive, the latter systems being particularly so.
I V ANALYSES OF THE LIFETIME DISTRIBUTION OF HEALTH CARE RECEIPTS AND FINANCE
The results discussed above are all derived from analyses of cross-sectional micro-data. But cross-sectional snapshots of relative gains and losses from the health care system by income groups (even when standardised for age) may be rather misleading. For example, i f those persons who get most health care at young ages are the same people who get most i n later life,.and these persons are also the poor, then the lifetime distribution of health care receipts is considerably more concentrated than i f those who get health care i n later life are a richer group. Cross-sectional data cannot be used to distinguish between those cases where relative gains are concentrated among the same persons for their whole life and where they are dispersed across different persons. Ideally, what is required is panel data, and this panel must be of considerable length, as health care usage is highest i n the early years and later years of a person's life. A t present, such panel data is not available for the UK. Nor, given the length of panel required, w i l l i t be available for many years.
Micro-simulation models offer an alternative source of such data. These are models which generate data on individuals (micro-data) from simulations based on observed behaviour from cross-sectional and short panel data. Cross-sectional micro-simulation models are widely used i n policy analysis (examples are tax-benefits models used to simulate the effects of tax and social security regimes).1 4 But these models are not suitable for analysis of
lifetime or lifecycle effects. Such analysis requires a model which simulates the behaviour of a cohort over a lifetime or of several cohorts over their lifetime. One such model exists for the U K (Falkingham and Hills, forth coming). This model, called LIFEMOD, simulates the behaviour of a cohort of persons born i n 1985 over their lifetimes. As this model contains, amongst other variables, data on health care receipts, income and taxes paid, i t can be used to study the lifetime distribution of health care payments and receipts. Comparisons can therefore be made between simulated lifetime distributions and those discussed above derived from cross-sectional data.
The Simulation Model
The LIFEMOD model generates simulated data for individuals. The details of the construction of the model are given i n Falkingham and Lessof (1992). What follows here is a brief outline relevant to use of this model to examine lifetime distributions of health care and payments for this care. The model
simulates events for each year of life from b i r t h to death for 4,000 obser vations, 2,000 male and 2,000 female. These events include death, social class of parents, education, labour market participation, fertility and family formation and dissolution, earned and unearned income, direct taxes paid and benefits received from the state, health status and health care u t i l isation. The probability of each event occurring for any observation i n the model is based on econometric analysis of the factors determining the event. Given the value of this probability a Monte Carlo procedure is used to determine whether or not the event occurs.
Data limitations and the specific form of the simulation model shape the events that are simulated i n the model. Most of the estimated probabilities are derived using data from 1985. LIFEMOD is therefore a model of a 1985 steady-state world. I n addition, the probability of any event occurring for an observation i n LIFEMOD can only be a function of events which have already been estimated within the model. The specific health status and health care variables modelled i n LIFEMOD are the same variables as used i n many of the analyses presented i n Sections I I and I I I of this paper. Two measures of health status — chronic and acute morbidity — and one measure of health care expenditure — total NHS expenditure — are simulated. Formally, the simulation process first calculates
p r ( mi j t = l ) = f ( xi t) , j = 1,2, i = 1,400, t = 1,100 (4)
where myt = 1 i f morbidity j occurs for individual i , year t
0 otherwise
X jt = variables including age, work status, socio-economic status,
and1 an autocorrelated error to reflect correlation i n health
status over time
j = chronic or acute morbidity
A Monte Carlo process is used to assign a value of 1 or 0 to the two health status indicator variables. Conditional on the realisations of these two events, the level of NHS expenditure for observation i i n year t is determined by
E(expi t) = pr(expi t)0lzi t)* E(expi tlexpi t)0) (5)
where expi t = total NHS expenditure person i year t
zi t = variables including age, work status, socio-economic status
and predicted morbidity.
ind-vidual socio-economic characteristics. A Monte Carlo process is used to determine the realisation of this event. I f this event is realised, the level of NHS expenditure is determined by the second term i n Equation (5). This realisation of this second term is deterministic and depends only on age and gender (further details i n Propper and Upward, 1993).
The functional forms of Equations (4) and (5) are based on econometric estimates of the incidence of acute and chronic morbidity and of the prob ability of incurring NHS expenditure i n a given year, derived from the 1985 GHS. Thus the incidence of an event is modelled as the 1985 incidence. As there is no health care supply side i n the G H S ,1 5 and so none i n LIFEMOD,
the vector zi t contains no measures of health care supply. However, as only
the first term of Equation (5) — the probability of use of the NHS — is modelled as a function of individual behaviour i n LIFEMOD, and as i n i t i a l contact w i t h the medical care providers is generally argued to be the result of demand side factors, the omission of supply side variables does not seem inappropriate. A limited relationship between health status, income and employment is modelled i n LIFEMOD. Because of lack of adequate cross-section data and the consequent form of the model i n which income is estimated prior to health status and care, while health status i n year t is modelled as a function of employment status and income i n year t, income and employment status are not modelled as a function of health. Finally, behavioural response to policy change is assumed to be zero.1 6
Lifetime Equity in the Delivery of UK Health Care
LIFEMOD data was used to replicate the cross-sectional analysis of equity presented i n Table 1 above using lifetime data. Expenditure was standard ised for need using the methodology i n Equation (3) of Section I I . The income definition used was gross household income, adjusted for household com position, using the same equivalence scale as Propper and Upward (1992). Taxes were levied according to the tax and social security regime i n operation i n 1985. For each observation, a lifetime total of health care standardised for need was derived by summing annual expenditure standardised for need over the length of life of that observation. A lifetime average was formed by divid ing the lifetime total by the number of years of life of that observation. These annualised values were then averaged across annualised lifetime income
15. Nor is there any other data set that can be used to l i n k supply side characteristics to individuals (i.e. to the demand side).
groups (annualised income being obtained i n the same way as annualised health care) to obtain the lifetime distribution of health care standardised for need by income group (Propper, forthcoming).1 7 Table 5 presents the per
centage shares of annualised lifetime health care standardised for need by annualised lifetime income deciles.1 8 The results indicate no clear pattern of
association w i t h income. They suggest that i f equity is defined as "allocation according to need" over the lifetime, the distribution of NHS expenditure appears to be fairly equitable. Similar results are obtained from an analysis of lifetime totals of health care expenditure standardised for need (Propper, forthcoming). The lifetime distribution is not dissimilar to the cross-sectional distribution between the mid 1970s and the late 1980s presented i n Table 1. These results are subject to the caveat that they are generated by a
micro-Table 5: Percentage Shares of Annualised Lifetime Health Care Expenditure
Standardised for Need using LIFEMOD Data
Individuals Ranked by Annualised Equivalent Cross Income
Annualised Lifetime Income Decile
Standardised by both Acute and Chronic Morbidity
Standardised by Chronic Morbidity Only
Bottom 9.62 9.68
2nd 9.89 9.93
3rd 10.03 10.04
4th 9.97 9.80
5th 9.93 9.92
6th 10.23 10.12
7th 10.08 10.07
8th 9.99 9.99
9th 10.48 10.45
Top 9.98 10.00
N = 3 9 8 3 .1 9
17. T h e m e a n incidence of ill-health in L I F E M O D is slightly higher than in the cross-sectional data; the average incidence of chronic morbidity in L I F E M O D among adult men being 35 per cent and among adult women being 40 per cent whereas the proportions i n the 1985 G H S are 35 and 38 per cent respectively. T h e average incidence for adult men and women of acute sickness in L I F E M O D is 11 per cent for men and 15 per cent for women: the G H S figures are 10 and 14 per cent respectively. T h i s is because observations in L I F E M O D have longer duration of life than those in current cross-sectional data and ill-health is positively associated with age. T h e average lifetime incidence of morbidity and health care receipt (all variables adjusted for length of life) across individuals ranked by lifetime income are weakly pro-poor; that is, over a lifetime the poor are both sicker and receive a higher share of N H S health-care expenditure.
18. A n n u a l i s a t i o n (dividing by y e a r s of life) could m a s k significant differences in incidence of ill-health and lifetime receipt of health care, but does not appear to do so here. The distribution across income groups of total lifetime incidence of morbidity and health care received is similar to the distribution of annualised morbidity and health care.
simulation model that can only be as good as the data on which i t is based. As the data are based on the GHS, both the need and the utilisation measures are subject to the same caveats as the cross-sectional analyses using this data (discussed i n Section V below).
The Lifetime Distribution of Finance
LIFEMOD data can be used to replicate part of the O'Donnell, et al. (1993) analysis of the cross-sectional distribution of finance for health care. As only direct taxes (income tax and national insurance contributions) are modelled i n LIFEMOD, the LIFEMOD results can only be compared to columns (2) and (3) of Table 3. The same incidence assumptions are made as i n the cross-sectional analyses (employers' contributions to National Insurance are passed on to consumers and that direct taxes are borne by the payer). Table 6 pre sents the distribution from LIFEMOD of annualised lifetime income, income tax, and national insurance contributions by annualised lifetime income decile. Both the Kakwani and the Suits indices indicate that lifetime distri bution of finance from income tax is progressive while that from national insurance is neutral.2 0 Comparison with the cross-sectional results i n Table 3
indicates the following. First, the lifetime distribution of taxes over the life time has the same pattern as the cross-sectional distribution. Second, the life time distribution of gross income, income tax and national insurance is more
Table 6: The Distribution of Annualised Lifetime Income and Payments Individuals Ranked by Annualised Equivalent Gross Income
Annualised Lifetime Income Decile
Percentage of Income
Percentage of Income Tax
Percentage of National Insurance
Bottom 4.91 2.23 3.55
2nd 6.51 4.20 5.99
3rd 7.28 5.21 6.96
4th 8.33 6.84 8.46
5th 8.86 7.78 9.18
6th 9.42 8.66 10.01
7th 10.60 10.63 11.37
8th 11.71 12.52 12.61
9th 13.53 15.70 14.33
Top 18.85 26.21 17.54
Gini 0.20 0.35 0.23
K a k w a n i 0.11 0.03
Suits Index 0.14 0.01
N=3983.
equal than the cross- sectional distribution (the Gini coefficients are smaller i n the lifetime data). Third, the lifetime distribution of finance for health care relative to income is less progressive than the cross-sectional distribution, as both the Suits and the Kakwani indices are smaller i n Table 6 .2 1
Net Incidence
Tables 5 and 6 replicate cross-sectional analyses and so provide compari son of the simulated lifetime distributions w i t h cross-sectional distributions. LIFEMOD data can also be used to examine net incidence of health care receipts and payments — the difference between what individuals pay to the state for health care i n terms of taxes and what they receive from the state for health care (Propper, forthcoming). This analysis allows comparison of health-care receipts; and payments w i t h the net distribution of other state transfers, such as education, pensions or social security payments (Falking-ham and Hills, forthcoming). Table 7 presents the net lifetime distribution of payments for, and receipts of, health care under the assumption that all health care is financed proportional to direct taxation. The average net gain across all observations was set to zero, so the amount of direct tax paid by each observation was scaled down so that average lifetime payment for health care equalled the value of health care received. Under these assumptions, Table 7 indicates that individuals i n the bottom six deciles of lifetime income would be net gainers, whilst those i n the top 4 deciles would be net losers. The main determinant of this lifetime redistribution from poor to rich is the income tax system.2 2
There has been no comparable analysis using actual cross-sectional data, but the t h i r d column of Table 7 presents the results using LIFEMOD data as a single cross section. The comparison shows that the cross-sectional distribution is considerably more extreme. The distribution of lifetime net benefits by lifetime income is more equal than the cross-sectional distri bution. This provides confirmation of the more general picture: that taking a lifetime perspective reduces the extent of redistribution i n the health-care-financing system.
21. Note there are no standard errors for the indices.
Table 7: Net Incidence of Average Annual Health Care Transfers by Lifetime
Annualised Income Derived from LIFEMOD
Individuals Ranked by Annualised Equivalent Gross Income
Annualised Lifetime Average Net Incidence Average Incidence of Income Docile (£pa rounded) Annual Transfers
(£pa rounded)1
(1) (2) (3)
Bottom 214 171
2nd 147 278
3rd 109 347
4th 95 358
5th 55 210
6th 21 75
7th - 2 3 - 7 8
8th - 6 8 - 2 2 8
9th - 1 6 6 - 3 8 6
10th - 3 8 3 - 7 5 1
O b s e r v a t i o n s ranked by annual gross equivalised income.
N=3987 for cols (1) and (2). N=234071 for col (3).
V DISCUSSION
The body of evidence reviewed i n this paper provides three "stylised facts". First, i f equity i n the distribution of health care is defined as "equal treat ment for equal need" then the U K health care system broadly meets this goal and has met this goal since (at least) the mid 1970s. Second, i f equity i n the distribution of payments is defined as "contribution according to ability to pay", then the U K system broadly meets this goal, i n that the health-care-financing system i n total is quite close to proportional. I f the goal is a system that is more progressive, then the use of indirect taxation and user charges to finance health care reduces the extent of progressivity. Third, the system of financing health care used i n the U K is one of the most progressive of a number of OECD countries.
The finding on the delivery side that the NHS distributes health care more or less according to need emerges from a growing number of U K studies using large scale data, and the consistency of results is some indication of robust ness. I t is also echoed i n results from other OECD countries (van Doorslaer, et al., 1992). Yet the finding of small differences across income groups fits slightly uneasily w i t h evidence from some smaller-scale studies that poorer individuals receive less or different health care than better off individuals (cf. BMJ, 30 A p r i l 1994).2 3 One explanation could be that the smaller-scale
studies capture only part of the picture. But the answer is likely to be more complicated and to be linked to the extent to which differences i n the extent of need and amount of medical care can be measured using annual cross-sectional large scale data sets.
First, the methodology used i n all the studies of equity discussed above embody the assumption that w i t h i n a particular morbidity group, any vari ation i n the extent of morbidity is random — i n other words that there is no systematic variation i n severity across individuals i n a particular need category.2 4 This assumption is made because there is no evidence i n most
years of the General Household Data to the contrary. Analysis of another large-scale data set, the Health and Lifestyles Survey (Cox, et al., 1987) showed t h a t poorer individuals are more likely to suffer more severe morbidity for chronic conditions, although for several types of morbidity, differences between poorer and richer were not statistically significant once differences across income group i n demographic composition were taken into account (O'Donnell and Propper, 1991). Analysis of the 1974 GHS also showed that poorer individuals had more chronic conditions (Propper and Upward, 1992). If, w i t h i n each need group, the poor are sicker, then the large-scale measures reported here w i l l overestimate the extent of redistri bution from higher to lower income groups.
Second, the results may be quite sensitive to the way i n which morbidity groups are defined from the data. As was noted above, the Le Grand (1978) approach assumed that those recorded as having no morbidity were not i n need. This assumption w i l l affect the results. While the methodology used i n later studies does not make this assumption, binary variables are used to represent an underlying latent variable, ill-health. Were more detailed measures of this latent variable to become available, the results could change. The results could also be sensitive to how these more detailed measures were used to defined need groups (for example, i f a n-point scale
23. T h e finding of a negative relationship between income and health i s common to both studies of the distribution of health care and those of the distribution of health.
were used to define fewer than n need categories).
Third, the measures of utilisation used i n the large-scale studies assume that each individual recorded as receiving a type of medical care (primary care, inpatient or outpatient hospital care) receives on average the same amount. I f there are systematic differences across income groups such that the rich get more, then the studies reported here w i l l once again overestimate the distribution from higher to lower income group. On the other hand, i f the poor get more, then the studies w i l l underestimate the extent of redistri bution. Fourth, the General Household Survey does not cover those i n institutional care. This is a group who are both i n greater need and receive greater health care than those not i n institutional care. I n younger age groups, they w i l l have lower income than those not i n institutional care. Given this, i t cannot be established a priori how the addition of this popu lation would change the aggregate picture, but given that this group are recipients of a considerable amount of care, a fuller picture should include those i n institutions. A l l these caveats to the relatively consistent picture that emerges from aggregate data are issues for further research i f and when suitable data become available. But finally, the studies reviewed here have provided a relatively consistent description of the distributions of health care resources and finance. More research is needed, particularly on the delivery side, to understand the factors that determine these distributions.
REFERENCES
A C T O N , J . P . , 1975. "Non-monetary Factors i n the Demand for Medical Services; some Empirical Evidence", Journal of Political Economy, Vol. 83, pp. 595-614.
A T K I N S O N , A . B . , and H . S U T H E R L A N D (eds.), 1989. Models for the Analysis of
Taxation and Benefits, London: London School of Economics.
B L A X T E R , M . , 1990. "A Comparison of Measures of Inequality i n Morbidity", i n J . Fox (ed.), Health Inequalities in European Countries, London: Gower.
B M J , 1994. British Medical Journal, No. 6937, p. 308.
C O L L I N S , E . , and R. K L E I N , 1980. "Equity and the N H S : Self Reported Morbidity, Access and Primary Care", British Medical Journal, Vol. 281, pp. 111-115.
C O X , B . D . , M . B L A X T E R , and A . L . T . B U C K L E (eds.), 1987. The Health and Lifestyle
Survey, London: Health Promotion Research Trust.
C U L Y E R , A . J . , and A. W A G S T A F F , 1993. "Equity and Equality i n Health and Health Care", Journal of Health Economics, Vol. 12, pp. 431-457.
E V A N D R O U , M . , J . F A L K I N G H A M , J . L E G R A N D , and D . W I N T E R , 1992. "Equity in Health and Social Care", Journal of Social Policy, Vol. 21, p.' 4.
F A L K I N G H A M , J . , and J . H I L L S , (forthcoming). "Lifetime Income and the Welfare State", i n J . F a l k i n g h a m and J . H i l l s (eds.), The Dynamic of Welfare, Harvester Wheatsheaf.
Micro-simulation Models for Public Policy Analysis: New Frontiers, London: London
School of Economics.
F O R S T E R , D . P . , 1976. "Social C l a s s Differences i n Sickness and General Practitioner Consultations", Health Trends, Vol. 8, pp. 29-32.
G O T T S H A L K , P., B . W , O O L F E , and R. H A V E M A N , 1989. "Health C a r e Financing i n the U S , U K a n d T h e Netherlands: Distributional Consequences", i n Changes in
Revenue Structures, Proceedings of the 42nd Congress of the International Institute
of Public Finance, Athens, pp. 351-373.
H U R S T , J . , 1985. Financing Health Care in the United States, Canada and Britain, Nuffield/Leverhulme Fellowship Report, K i n g Edward's Hospital F u n d for London. H U R S T , J . , 1992. The Reform of Health Care: A Comparative Study of Seven OECD
Countries, Paris: O E C D (Health Policy Studies 2).
L A M B E R T , P . , 1989. The Distribution and the Redistribution of Income: A
Mathematical Analysis, Oxford: B a s i l Blackwell.
L E G R A N D , J . , 1978. "The Distribution of Public Expenditure: the Case of H e a l t h Care", Economica, Vol. 45, pp. 125-142.
L E G R A N D , J . , 1982. The Strategy of Equality, London: George Allen and Unwin. L E G R A N D , J . , 1993. "Equity i n the Distribution of Health Care: the B r i t i s h Debate",
i n E . v a n Doorslaer, A. Wagstaff and F . Rutten (eds.), Equity in the Finance and
Delivery of Health Care: An International Perspective, Oxford: Oxford University
Press.
M O O N E Y , G , J . H A L L , C . D O N A L D S O N , and K . G E R A R D , 1991. "Utilisation as a Measure of Equity: Weighing Heat?", Journal of Health Economics, Vol. 10, pp. 475-480.
O ' D O N N E L L , O., and C . P R O P P E R , 1991. "Equity and the Distribution of N H S Resources", Journal of Health Economics, Vol. 10, pp. 1-20.
O ' D O N N E L L , O., C . P R O P P E R , and R . U P W A R D , 1993. "Equity i n the Delivery and Finance of H e a l t h C a r e i n Britain", i n E . van Doorslaer, A. Wagstaff and F . Rutten (eds.), Equity in the Finance and Delivery of Health Care: An International
Perspective, Oxford: Oxford University Press.
O ' H I G G I N S , M . , a n d P. R U G G L E S , 1981. "The Distribution of Public E x p e n ditures and Taxes amongst Households i n the United Kingdom", Review of Income
and Wealth, Vol. 27, No. 2, pp. 298-326.
O E C D , 1989. " H e a l t h C a r e E x p e n d i t u r e a n d O t h e r D a t a : a n I n t e r n a t i o n a l Compendium", Hedlth Care Financing Review, Annual Supplement, pp. 111-194. O F F I C E O F H E A L T H E C O N O M I C S ( O H E ) , 1987. OHE Compendium of Health
Statistics (6th edn), London: O H E .
P R O P P E R , C , and R . U P W A R D , 1992. "Need, Equity and the N H S : the Distribution of Health Care Expenditure 1974-87", Fiscal Studies, Vol. 13, No. 2, pp. 1-21. P R O P P E R , C , a n d B . U P W A R D , 1993. Modelling Health and Health Care over the
Lifetime, London: London School of Economics W S P Research Note 27.
P R O P P E R , C . (forthcoming). "For Richer, for Poorer, i n Sickness and i n Health: The Lifetime Distribution of H e a l t h Care", i n J . F a l k i n g h a m and J . H i l l s (eds.), The
Dynamic of Welfare, Harvester Wheatsheaf.
T O W N S E N D , P., and N . D A V I D S O N , (eds.), 1992. Inequalities in Health, Harmonds-worth: Penguin.
V A N D O O R S L A E R , E . , and A. W A G S T A F F , 1993. "Equity i n the Financing of Health C a r e : Methods and Findings", i n E . v a n Doorslaer, A . Wagstaff and F . Rutten (eds.), Equity in the Finance and Delivery of Health Care: An International Per
spective , Oxford: Oxford University Press.
V A N D O O R S L A E R , E . , A. W A G S T A F F , et al., 1992. "Equity i n the Delivery of Health Care; Some International Comparisons", Journal of Health Economics, Vol. 11, pp. 389-411.
V A N D O O R S L A E R , E . , A. W A G S T A F F , and F . R U T T E N (eds.), 1993. Equity in the
Finance and Delivery of Health Care: An International Perspective, Oxford: Oxford
University Press.
W A G S T A F F , A . , and E . V A N D O O R S L A E R , 1993. "Equity i n the F i n a n c e a n d Delivery of H e a l t h C a r e : Concepts a n d Definitions", i n E . v a n Doorslaer, A . Wagstaff and F . Rutten (eds.), Equity in the Finance and Delivery of Health Care:
An International Perspective, Oxford: Oxford University Press.
W A G S T A F F , A . , E . V A N D O O R S L A E R , and P. P A C I , 1989. "Equity i n the Finance and Delivery of Health Care: Some Tentative Cross Country Comparisons", Oxford
Review of Economic Policy, Vol. 5, No. 1, pp. 89-112.