Volume 5, No. 2
June 2000
Exchanges
South American Monsoon Modulation by SST Anomalies
Links between climate variability in the Rio de la Plata basin (area encircled by the red curve) and SST anomalies for the southern warm season (December-February). Green shading corresponds to precipitation (mm/month), black arrows to 925 hPa winds, thick blue arrows to maxima in vertically integrated moisture transport, and the blue hatched region to the Pantanal. The configuration of SST anomalies corresponds to enhanced precipitation in
ENSO
SSTA > 0
SSTA > 0
SSTA < 0
-Editorial
In this issue of Exchanges we feature one of CLI-VAR’s Principal Research Areas: “Variability of the Ameri-can Monsoon Systems” (VAMOS). VAMOS focuses on the complex issues raised by the need for better understand-ing and prediction of the second largest monsoon system on Earth. VAMOS also aims to improve the human and logistical capabilities required to address those complex issues and to enhance awareness of the societal impacts of the variability of monsoonal circulations over the Ameri-cas.
The VAMOS panel has held a series of planning meetings with the scientific community active in this field of research, and is now entering the implementation phase of an ambitious project that will last through the end of CLIVAR in 2010. The planning of the initial field experi-ments is practically completed and the first field observa-tions are expected to take place towards the end of 2002 in central South America and southwestern North America.
VAMOS strategy is based on encouraging partner-ships between interested scientists and organisations in different countries of the Americas. Two major international programmes on the American climate, the Land-Biosphere-Atmosphere in Amazonia (LBA) and the Pilot Research Array in the Tropical Atlantic (PIRATA) have been con-tributing to VAMOS since the very beginning. The Pan American Climate Studies (PACS) and Eastern Pacific In-vestigation of Climate (EPIC) of the USA are two national programmes represented in the VAMOS panel; other na-tional programmes may come on board as they develop. The Inter American Institute (IAI) and International Re-search Institute for Climate Prediction (IRI), both interna-tional institutions crucial to multi-nainterna-tional efforts in the Americas, are represented in the panel. VAMOS has estab-lished close ties with another major WCRP effort: GEWEX. These ties are formalised by the representation of GCIP in the panel and will be tightened by the planned work on the Rio de La Plata basin of South America.
Overall, the VAMOS project is expected to be one of the keys to CLIVAR’s success. We certainly have to ac-knowledge Carlos Roberto Mechoso for his enormous ef-forts and enthusiasm as VAMOS panel Chair. The high degree of readiness of VAMOS could not have been achieved without his leadership in scientific and organisa-tional aspects, as well as without the outstanding commit-ment of the other panel members.
Although VAMOS is the main overarching theme of this issue much more has been happening. The SSG co-chairs Anthony Busalacchi and Jürgen Willebrand summa-rise this in their report based on the discussions at the CLI-VAR Scientific Steering Group that met recently in Hawaii.
Then, the VAMOS section starts off with an over-view of the VAMOS project by C. R. Mechoso. This is fol-lowed by descriptions of selected project components, which are illustrated with recent scientific findings.
An important article in the general section of the newsletter is that by John Gould about the CLIVAR 'Track-ing Project': an initiative to provide comprehensive, up-to-date information about the programme to the community.
After 5 years we feel that it is time to renovate the layout of Exchanges and we started with some modest modifications in this issue. We hope that you will enjoy it and encourage you not only to read but also to contribute to Exchanges with short and interesting scientific highlight of research relevant to CLIVAR.
For the next issue, that will appear in late summer we would like to highlight the synthesis of climate research: bringing observations and simulations together, e.g. through advanced assimilation techniques, intercomparisons, or detection and attribution. We strongly encourage you to submit your contribution to the editor of CLIVAR Exchanges ([email protected]) not later than July 31.
Andreas Villwock
The CLIVAR Web-site has moved to Southampton !
Since beginning of May the main CLIVAR Web-site is now located in Southampton accessible under:
http://www.clivar.org/
CLIVAR SSG activities
Antonio J. Busalacchi
NASA/GSFC, Greenbelt, MD, USA [email protected] Jürgen Willebrand
Institut für Meereskunde, Kiel, Germany [email protected]
Co-Chairs CLIVAR Scientific Steering Group
The ninth meeting of the CLIVAR SSG was hosted by the International Pacific Research Center at the East-West Center on the University of Hawaii Campus, May 2-5, 2000. The SSG wishes to express its sincere appreciation for the fine meeting support from the IPRC, and it was pleased to see the progress that has been made in the de-velopment of this new research center with research goals very much in line and supportive of CLIVAR.
The SSG was briefed on a number of significant ac-complishments over the past year and plans for the com-ing year with respect to CLIVAR implementation of mon-soon studies, ocean observations, and coupled model stud-ies. When considering the fact that the International CLI-VAR Conference was held only 18 months ago in Paris, considerable progress has been made at the international level and within various countries under the auspices of CLIVAR. CLIVAR has developed recently a tracking sys-tem to monitor these various international contributions, and more information on this resource can be found on page 23. This ninth meeting of the CLIVAR SSG was one of the first SSG meetings in which a majority of the chairmen of the CLIVAR working groups and panels were in attend-ance. In view of the broad scope of CLIVAR, there was con-siderable discussion of plans to further strengthen the links and communication among the various elements across the programme. The presence of the SSG panel chairs contrib-uted greatly to the deliberations of the SSG and the overall approach to CLIVAR implementation.
Among the highlights of the past year was the CLI-VAR co-sponsorship of Ocean Observing System for Cli-mate Conference (a.k.a. Oceanobs ’99) in Saint Raphael, France. Under the leadership of Neville Smith and Chet Koblinsky, a consensus was developed regarding the ap-proach to sustained ocean observations in support of op-erational and CLIVAR research requirements. With respect to these CLIVAR requirements, and as a means of consoli-dating a number of the CLIVAR principal research areas, CLIVAR is proceeding with implementation via ocean sec-tor or basin panels that consider the range of observations, modelling, and process studies needed to address CLIVAR goals and objectives. On April 13 and 14, the first meeting of the CLIVAR Atlantic Panel was held in Natal, Brazil (see also article on page 23). The panel discussed the extent of activities within the Atlantic bearing on studies of the North Atlantic Oscillation, the Atlantic thermohaline circulation, and the tropical Atlantic variability. From the perspective
of CLIVAR implementation, it is important not to consider these principal research areas as separate areas onto them-selves, but rather to consider the context of the multiple factors or processes that determine the major modes and signals of climate variability and prospects for predictabil-ity within the region. In view of the prospects for predict-ability at low latitudes in the region, CLIVAR is encourag-ing interested countries to develop a coordinated approach to implementing a tropical Atlantic observing system build-ing on the success of the PIRATA programme and the re-port of the COSTA meeting, chaired by Sylvia Garzoli, in May 1999.
At the SSG meeting, Bob Weller reported on a plan-ning meeting held just prior to the SSG for the purpose of the development of a Pacific Implementation Workshop to be held in Hawaii in early 2001. Similarly, Doug Martinson is also in the process of planning an implementation meet-ing for the Southern Ocean to be held in Perth, Australia, in November 2000. Against this backdrop of the Ocean Obs’99 Conference and the ocean sector implementation panels, the SSG agreed that the present CLIVAR Upper Ocean Panel should become the CLIVAR Ocean Observa-tions Panel. The new panel would be charged to oversee implementation of sustained and near sustained ocean ob-servations in support of CLIVAR research. This would in-clude oversight for research purposes of the ENSO observ-ing system, for example. It was decided that increased em-phasis should be placed on ocean assimilation and air-sea fluxes.
Over the past year CLIVAR has seen significant progress made by a number of its monsoon related ele-ments. This is just one aspect of CLIVAR that intersects with other elements of the World Climate Research Pro-gramme. The CLIVAR monsoon initiatives have much to offer and are also in a position to gain much from the Glo-bal Energy and Water Experiment (GEWEX). The CLIVAR SSG was very pleased that Soroosh Sorooshian, the GEWEX Chairman and Ron Weaver of the GEWEX SSG were able to attend the SSG meeting. At the SSG meeting Bill Lau, Stuart Godfrey, and Peter Webster reported on the AA Monsoon Panel meeting held this past December and the strategy that is being developed for a sustained monsoon observing system. The SSG welcomed the progress made by AA Monsoon Panel and encouraged the group to de-velop further their plans in conjunction with GEWEX and the Coordinated and Enhanced Observing Period (CEOP). The SSG also saw a potential need for a process study to resolve some of the outstanding questions concerning intraseasonal oscillations associated with the AA monsoon system with a particular view to improving atmospheric model performance. The SSG encouraged the AA Monsoon Panel to develop an implementation plan in this regard and take advantage of the November meeting in Perth of regional Indian Ocean laboratory directors.
sea-strengthen cooperation across the full range of the WCRP activities. At the present time, CLIVAR is coordinating with CLIC for the implementation in the Southern Ocean. Moreover, CLIVAR, particularly through the co-location of the project offices, is working closely with WOCE to en-sure a successful conclusion of WOCE (e.g. the joint Vari-ability Workshop to be held in Japan this autumn) and a smooth transition where appropriate of such aspects as WOCE data centres. Lastly, a programme such as CLIVAR benefits from an appropriate injection of new ideas and energy together with the stability provided by overlapping committee membership. We wish to acknowledge the ef-forts of Allyn Clarke and Chongyin Li, who contributed so much over the past several years as members of the SSG, and take this opportunity to welcome Francis Zwiers and Guoxiong Wu as new members of the SSG.
Introduction to VAMOS
Carlos Roberto Mechoso
Department of Atmospheric Sciences University of California, Los Angeles, USA [email protected]
1. Overall goals and strategy
The goal of VAMOS in the Americas is to improve the 1) understanding of the monsoons in the context of the global climate system, 2) capacity for seasonal to interannual climate predictions, and 3) assessment of an-thropogenic climate change impacts. The VAMOS Panel’s strategy to achieve these goals is based on the 1) identifica-tion of scientifically important climate phenomena with demonstrated potential for predictable components, 2) en-couragement of partnerships between scientists in inter-ested countries and contributions to the development of national and international research plans, and 3) promo-tion of broad participapromo-tion in field programmes, both to bring local expertise to an international setting and to en-hance scientific exchange and capacity building.
2. The American monsoon experiments
The Panel has focused on the definition of key prob-lems within the framework of VAMOS goals, and on the formulation of hypotheses for guidance of future empiri-cal and modelling research as well as on the design of field experiments. A unifying view has started to emerge as simi-larities and differences between North and South Ameri-can monsoon systems have been further clarified.
The current plans are centred on two internation-ally coordinated efforts to improve prediction of warm sea-son precipitation over South and North America:
a) Monsoon Experiment South America (MESA), and b) North American Monsoon Experiment (NAME). son precipitation within the Americas. As reported later in
this issue, this will include process studies under the stra-tus deck off the west coast of South America, field studies of the South American low level jet, all culminating with a coordinated study of the climatology and hydrology of the Rio de la Plata basin.
With respect to Africa, the CLIVAR Africa Study group published its report on African climate variability in 1999. Subsequently a CLIVAR African task team was es-tablished to develop an initial implementation plan for achieving CLIVAR’s objectives with regard to Africa. A draft of the task team report was reviewed by the SSG, which decided that upon completion of the plan, a formal CLIVAR African Climate Panel would be established to foster and oversee implementation. One of the early tasks for this Panel would be the compilation of an inventory of data sources relevant to achieving those objectives stated in the plan
The modelling groups within CLIVAR continue to be very active, and this past year has seen considerable amount of effort in support of the IPCC process. An im-portant aspect of this process are issues of attribution and detection of climate change which were reported on by the Working Group on Climate Change Detection which is jointly sponsored by CLIVAR and the WMO Commission for Climatology. This past year, the Working Group on Sea-sonal-to-Interannual Prediction evaluated various predic-tions of 1997-98 El Niño/La Niña sequence and the role that intraseasonal oscillations may have played in the tim-ing and amplitude of this extreme event. Durtim-ing the course of the SSG, there was discussion that certain aspects of CLIVAR science, with respect to the fundamental basic re-search and modelling activities, have matured to the point that CLIVAR should broaden and deepen its interactions with the applications sector. A step in this direction was taken at this meeting by way of the discussions regarding the UNESCO programme on Hydrology for the Environ-ment, Life, and Policy (HELP) which was represented by Jim Shuttleworth. The SSG saw a need to strengthen its links with programmes such as HELP and with organisa-tions such as the IRI, IAI, CLIMAG, Food and Fibre, and CLIPS. Interactions of this nature would naturally lead to recommendations for joint projects with the CLIVAR mod-elling working groups such as predictability case studies for the recent floods in Mozambique on the short time scale, and the Sahel rainfall on the longer decadal time scale. It was decided that the SSG will devote a full session to this general topic at one of its next meetings.
The principal objectives of MESA and NAME are
1) a better understanding of the key components of the American monsoon systems and their vari-ability,
2) a better understanding of the role of those systems in the global water cycle,
3) improved observational data sets, and
4)improved simulation and monthly-to-seasonal prediction of the monsoon and regional water resources.
MESA and NAME are both organised in three stages or tiers. The latter experiment is described by W. Higgins in this issue of Exchanges. We will concentrate on MESA in this report.
3. MESA
Over South America, the summer circulation is dominated by the mon-soon system. Important geographi-cal factors determining the evolution of this system are the large land mass
bisected by the equator, very high mountains to the west that effectively block air transport in the zonal direction, and surface cover that varies from tropical forests in Amazonia to high altitude deserts in the Bolivian Altiplano. Plentiful moisture supply from the Atlantic maintains a pre-cipitation maximum over central Brazil. A major seasonal feature of the monsoonal circulation over South America is the South Atlantic Convergence Zone along the eastern boundary of the La Plata Basin. A low-level north-erly/northeasterly jet that flows east of the Andes (SALLJ) is described in the papers by J. N. Paegle and E. H. Berbery, and Nicolini and Saulo.
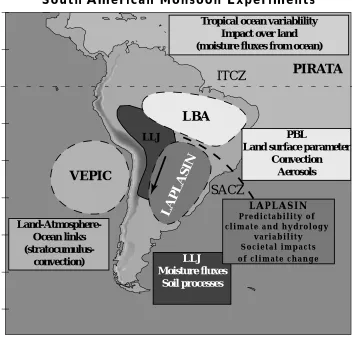
An important component of MESA’s Stage 1 focuses on the SALLJ and the moisture corridor between the An-des and the Brazilian Altiplano. The main objective of this component is to better understand the role of the SALLJ on the moisture transports, their variability and links to remote and local climate anomalies. Stage 1 also comprises VEPIC (VAMOS-EPIC: Eastern Pacific Investigation of Cli-mate Processes in the Coupled Ocean-Atmosphere System), which targets the links between continental convection and marine stratocumulus along the chilean coast.
MESA’s Stage 2 will be a study of the hydroclimatology of the La Plata River Basin, whose im-portance is emphasised in the paper by E. H. Berbery and C. R. Mechoso. The current consensus is that climate vari-ability in the La Plata Basin has remote influences (see the
paper by A. Grimm). Positive precipitation anomalies in the basin tend to correspond to warm events in the tropi-cal Pacific, warm sea surface temperature (SST) anomalies in the western South Atlantic, and cold SST anomalies in the north tropical Atlantic (see Fig. 1, cover page). The cur-rent consensus also states that, at least during the mon-soon season, the major contribution to the moisture flux into the basin comes through a “moisture corridor east of the Andes”. There is also evidence that precipitation in the basin is inversely correlated with the intensity of the SACZ. Understanding the mechanisms at work for these connec-tions is a principal goal of MESA. Figure 2 is a schematic of MESA Stage 2. Stage 3, towards the end of the decade, will link the Rio de La Plata basin project (PLATIN) to the cli-mate monitoring efforts under development by the South American countries along the Pacific coast. Data gathered in these programmes will be made available in a VAMOS database.
4. VAMOS and GEWEX
MESA and NAME will provide an important linkage be-tween CLIVAR and GEWEX. The GEWEX Continental-scale International Project (GCIP) has promoted much re-search into aspects of the North American monsoon sys-tem, which will continue and expand under the new GEWEX Americas Prediction Project (GAPP). Similarly, the GEWEX Coordinated Enhanced Observing Period (CEOP) will coincide with the first MESA field programmes.
Fi-SACZ
ITCZ
PIRATA
VEPIC
LLJ
LBA
LAPLASIN
PBL
Land surface parameter Convection
Aerosols Tropical ocean variablility
Impact over land (moisture fluxes from ocean)
LLJ Moisture fluxes
Soil processes
Land-Atmosphere-Ocean links
(stratocumulus-convection)
L A P L A S I N
P r e d i c t a b i l i t y o f c l i m a t e a n d h y d r o l o g y
v a r i a b i l i t y S o c i e t a l i m p a c t s o f c l i m a t e c h a n g e
[image:5.595.204.556.73.411.2]S o u t h A m e r i c a n M o n s o o n E x p e r i m e n t s
nally, PLATIN will be the first large-scale, international project to be jointly sponsored and developed by CLIVAR and GEWEX. As a result of such collaborations, the MESA and NAME will contribute decisively to establish a long-term climate and hydrology monitoring capability through-out the Americas by the end of the decade.
5. Acknowledgement
On behalf of the VAMOS panel, it is a pleasure to acknowl-edge the excellent support provided by the ICPO repsentative, Andreas Villwock, and the encouragement re-ceived from John Gould and Valery Detemermann.
Low-level Jets over the Americas
Julia Nogués-Paegle
University of Utah, Salt Lake City, Utah, USA [email protected]
Ernesto Hugo Berbery
University of Maryland, College Park, Maryland, USA [email protected]
1. Introduction
Warm-season precipitation processes over North and South America are strongly modulated by Low-level Jets (LLJ’s). The LLJ structure is particularly important since this wind system transports moisture rapidly over large distances, e.g., east of the Rockies and Andes mountains. This moisture often condenses and precipitates in the re-gion of low-level convergence situated downstream of the LLJ core. Here, explosive mesoscale convective complexes (MCCs) occur preferentially at night.
[image:6.595.304.556.298.739.2]Although both North and South American observa-tions display extensive areas of nocturnal convection dur-ing the sprdur-ing and summer seasons over vast agriculturally productive plains east of the mountains, general circula-tion models have been unable to reproduce the nocturnal precipitation maxima (Ghan et al., 1996). Consequently, models used for climate simulation, as well as for gener-ation of global gridded data sets, systematically misrepre-sent this basic element of summer precipitation. It is plau-sible that the deficiency constrains accuracy of longer-term climate simulations, as several observational studies have suggested a correlation of longer-term rainfall fluctuations with areas of strong diurnal convection cycles. Limited area models (LAMs) and variable resolution global models have reported greater success in short-to-medium term simulations of diurnal convective cycles. It is not yet clear whether this is simply due to their better resolution of at-mospheric dynamics or to more detailed depiction of sur-face characteristics such as topography. It is also plausible that accurate simulations of nocturnal convection depend upon accurate simulations of the LLJ and its strong diur-nal cycle.
Fig. 1: Mean wind field (arrows) and its monthly standard deviation (shades) at 950 hPa, estimated from 1957-1996 NCEP/NCAR reanalyses.
2. Long Term Variability
Figure 1 depicts the January and July 950 hPa wind average and its monthly standard deviation obtained from 40 years of NCEP/NCAR reanalysis. The maximum vari-ability of the meridional wind is found in close proximity to the region of maximum northerlies east of the Bolivian plateau and represents about 50% of the average value. This indicates a high potential predictability of the January low-level flow (and associated rainfall patterns). However, for this potential to be realised it is necessary to determine the source of such variability, both with regards to possi-ble remote influences and regional forcings. The latter in-cludes the blocking effects of the Andes mountains and Brazilian Altiplano as well as land-atmosphere interactions.
Figure 1 shows easterly flow over South America from the Atlantic Ocean into tropical South America, chan-nelled southward by the Andes. The trade winds merge with the northern branch of the Atlantic subtropical high, which brings moist air into the South American coast. Changes in the position and intensity of the north-easterlies and the Atlantic high have profound impact on the LLJ. For example, as the Atlantic high shifts westward in sum-mer, the LLJ east of the Bolivian plateau shifts southward and is often associated with increased precipitation over the lower La Plata river basin.
In interdecadal time scales there is evidence for in-creased precipitation over tropical South America with the warm (positive) phase of the North-Atlantic Oscillation. During this phase, the trade winds increase bringing addi-tional Atlantic moisture over the continent. Over the south-ern oceans there is a tendency for a southward shift of the subtropical highs (Burnett and McNicoll, 1999) and a con-comitant impact on the circulation over the perimeters of continents. Significant interdecadal variations in rainfall have also been detected in several regions of South America. For example, CastaZeda and Barros (1994) disclosed long term variations in rainfall over northern Argentina. Robertson and Mechoso (1998) showed long-term varia-tions and trends in streamflows of rivers in the La Plata basin. Grimm et al. (1998) discussed significant shifts in the precipitation over southern and southeastern Brazil in the 70’s. The period and region of maximum variation sug-gest an ENSO-like impact on longer time scales.
In interannual time scales, the LLJ is influenced both by Pacific and Atlantic sea surface temperatures (SST). Warming of the equatorial Pacific (warm ENSO event) re-sults in a eastward displacement of the Walker circulation. The South America rainfall pattern during a warm ENSO event (Ropelewski and Halpert, 1987) depicts a dipole with dry conditions over northeast Brasil and wet conditions over the lower La Plata basin. In contrast, south Atlantic SST anomalies (10oS) modulate the South Atlantic
Conver-gence Zone convection, such that warm SSTs are associ-ated with a weakened SACZ and strengthened LLJ east of the Bolivian plateau (Robertson and Mechoso, 2000).
Nogues-Paegle and Mo (1997) describe an oscilla-tion between the LLJ and the SACZ in intraseasonal time scales and point out some basic differences between the low-level jet over the United States Great Plains and that over South America. The moisture source of the former is a water mass (the Gulf of Mexico), while over South America the moisture corridor has strong interaction with the Amazon Basin that is traversed en-route to the La-Plata Basin. In addition, the Great Plains low-level jet has a marked annual cycle, with the jet developing during the warm season while the South American LLJ is present most of the year (Figure 1 and see also
h t t p : / / w w w. m e t . u t a h . e d u / j n p a e g l e / re s e a r c h / miami_report.html).
3. Mesoscale aspects
The regional forcings that may affect the long term variability are of mesoscale nature. Similarly, one of the most remarkable aspects of the LLJs is their mesoscale na-ture. While their extent is typically of the order of 2000 km, their width is only about 500 km. Moreover, they have a large diurnal cycle that affects the downstream convergence of moisture flux and precipitation. Figure 2 (page 16) presents the diurnal cycle of convective cloud frequency (Garreaud and Wallace, 1997), which reveals a nocturnal maximum mainly over northeastern Argentina. Mesoscale model studies for summer have shown that the LLJ east of the Andes is strongest during night-time; however, as in-dicated earlier, no observations are available to verify that this is the case. On the other hand, if the model simulations realistically reproduce the night-time maximum of precipi-tation (e.g., Berbery and Collini, 2000), it is conceivable that other modelled aspects, including the night-time maximum in the LLJ intensity and its related convergence, are all part of a same physical evolution.
The hydrological cycle is of great interest in predict-ability studies, since it relates to the water resources for vast populations. Adequate resolution of LLJs in numeri-cal models is a necessary condition to compute the mois-ture flux convergence as part of the hydrological cycle, but results from global reanalyses have exposed their limita-tion to achieve water balances for given regions (e.g., Higgins et al., 1996). Part of the problem has been attrib-uted to uncertainties in wind analyses (Wang and Paegle, 1996), but an additional limitation is lack of resolution of the diurnal cycle and of mesoscale features (Berbery and Rasmusson, 1999).
4. Field programme
References
Berbery, E.H., and E.M. Rasmusson, 1999: Mississippi moisture budgets on regional scales. Mon. Wea. Rev., 127, 2654-2673. Berbery, E.H., and E. A. Collini, 2000: Springtime precipitation
and water vapor flux over southeastern South America. Mon. Wea.
Rev., 128, 1328-1346.
Burnett, A.W., and A.R. McNicoll, 2000: Interannual variations in the Southern Hemisphere winter circumpolar vortex: Relation-ships with the semiannual oscillation. J. Climate, 13, 991-999. CastaZeda, M.E., and V. Barros, 1994: Las tendencias de la precipitacion en el Cono Sur de America al este de los Andes.
Meteorologica, 19, 23-32.
Douglas, M., M. Nicolini, and C. Saulo, 1998: Observational evi-dences of a low level jet east of the Andes during January-March 1998. Meteorologica, 23, 63-72.
Douglas, M., M. Nicolini, and C. Saulo, 1999: The low-level jet at Santa Cruz, Bolivia during January-March 1998, pilot balloon ob-servations and model comparison. Preprint Volume, Tenth Con-ference of the AMS on Global Change Studies, Dallas, Texas, Janu-ary 1999.
Garreaud, R.D., and J.M. Wallace, 1997: The diurnal march of the
convective cloudiness over the Americas. Mon. Wea. Rev., 125,
3157-3171.
Ghan, S.J., X Bian, and L. Corsetti, 1996: Simulation of the Great-Plains low-level-jet and associated cloud fields by general circulation models. Mon. Wea. Rev., 124, 1388-1408.
Grimm, A.M., S.E.T. Ferraz, and J. Gomes, 1998: Precipitation anomalies in Southern Brazil associated with El Niño and La Niña events, J. Climate, 11, 2863-2880.
Higgins, R.W., K.C. Mo, and S.D. Schubert, 1996: The moisture budget of the Central United States in spring as evaluated in the
NCEP/NCAR and the NASA/DAO reanalyses. Mon. Wea. Rev.,
124, 939-963.
Nogués-Paegle. J. and K.-C. Mo, 1997: Alternating wet and dry
conditions over South America during summer. Mon. Wea. Rev.,
125, 279-291.
Robertson, A.W., and C.R. Mechoso, 1998: Interannual and
decadal cycles in river flows of southeastern South America. J.
Climate, 11, 2570-2581.
Robertson, A.W., and C.R. Mechoso, 2000: Interannual and interdecadal variability of the South Atlantic Convergence Zone.
Mon. Wea. Rev., submitted.
Ropelewski, C.F., and M.S. Halpert, 1987: Global and regional scale precipitation patterns associated with ENSO. Mon. Wea. Rev., 115, 1606-1626.
Wang, M., and J. Paegle, 1996: Impact of analysis uncertainty upon
regional atmospheric moisture flux. J. Geophys. Res., 101,
7291-7303.
Phase I. Build-Up phase.
i) Compile and analyse special South American soundings of 1998, 1999 (Douglas et al., 1998, 1999) and those planned for the next three years as an extension of the PACS/SONET network over Bolivia and Paraguay. The latter effort is possible through the continued financial endorsement from NOAA’s Office of Global Programs. This monitoring programme is essential to quantify intra-seasonal, seasonal, and inter-annual variability of South American LLJs, and thereby validate, calibrate, and tune assimilation systems.
ii) Improve rainfall measurements in the region through improvement of the network of recording rain gauges over tropical and subtropical South America.
Phase II: Field Experiment Special Observing Periods (SOPs)
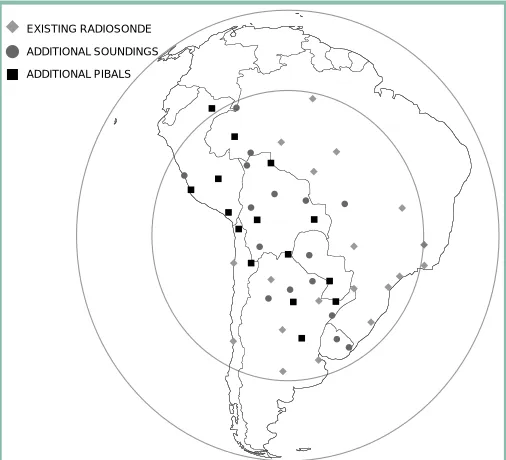
At least two SOPs (two to three months long) are currently planned to account for interannual variability (field campaigns of 2002-2003 and 2003-2004). The SOP’s would start in November to coincide with the climatological time of maximum late spring MCC activity to the lee of the Andes. The regular radiosonde network would be augmented during this period to two times per day as shown in Fig. 3 and an array of three 915 MHz wind profilers will be potentially deployed over Bolivia and the Bolivian-Brazilian border. Intensive observing periods (IOP, 3-7 days long) would be selected within the observing pe-riods. Upper level soundings would be increased to 4 times per day during the IOP’s and the NOAA P-3 aircraft will be flown out of Santa Cruz, Bolivia. This latter platform will measure horizontal gradients associated with LLJ near the Andes (from a few km from foothills to about 400 km) with better resolution than can be provided by the sound-ing network.
[image:8.595.38.291.65.295.2]EXISTING RADIOSONDE ADDITIONAL SOUNDINGS ADDITIONAL PIBALS
The Hydrologic Cycle of the Rio de la Plata basin
Ernesto Hugo Berbery
University of Maryland, College Park, Maryland, USA. [email protected]
Carlos Roberto Mechoso
University of California, Los Angeles, California, USA. [email protected]
The Rio de la Plata basin (La Plata basin) in South America comprises the Paraná, Paraguay and Uruguay riv-ers. It covers about 3.6 106 km2 and spreads over five
coun-tries, where about 50% of their combined population lives. Approximately 46% of the basin’s surface is in Brazil, 30% in Argentina, 13% in Paraguay, 7% in Bolivia, and 4% in Uruguay. The basin is important in different ways for the regional economies; about 70 of the total GNP of the five countries combined is produced within the basin. Firstly, harvests and livestock are among the region’s most impor-tant resources. Secondly, the rivers are natural waterways and ground transportation has greatly increased in recent years due to the integration of regional economies. Thirdly, several hydroelectric plants provide energy to the region, and, in fact, 92% of the energy produced by Brazil depends on hydroelectric resources. Finally, the rivers of the basin are the water resource for one of the most densely popu-lated regions of South America.
The VAMOS implementation plan for the Monsoon Experiment in South America (MESA) has a particular interest in the water cycle and regional water resources. Within MESA, the study of the South American Low-level Jet (LLJ) seeks to understand its role in moisture transports and associated hydrological processes (Mechoso, 2000 in this issue). In a second stage, MESA will target the clima-tology and hydrology of the La Plata basin.
This note discusses basic features of the La Plata river discharge, and contrast them with those of the Mississippi River. Such a comparison is of interest in view of the in-tense research that has been devoted to the latter; both ba-sins are about the same size and it is expected that the ex-perience gained in studies of the Mississippi’s hydrologic cycle could greatly help to better understand La Plata’s. The same reasoning motivates the American Low-level Jets (ALLS) project, since the two basins have an important in-flow of moisture from the tropics/subtropics through poleward LLJs east of a mountain barrier (the Rockies for the Mississippi River basin and the Andes for the La Plata basin). On the other hand, it is also important to identify differences that will require special research. For instance, despite the overall similarities, the Great Plains LLJ has marked differences with its South American counterpart, both in structure and seasonal cycle (see, e.g., Nogués-Paegle and Mo, 1997; Berbery and Collini, 2000). Further details are discussed in Nogués-Paegle and Berbery (2000)
in this issue. Concerning river discharge, it is crucial to in-vestigate the main contributors to its seasonal cycle and variability.
The Mississippi River discharge (Figure 1a) has a well defined seasonal cycle with a maximum of about 25,000 m3 s-1 during spring (March-April-May); this
maxi-mum is the result of snow melting in the northern parts of the basin, with an additional contribution by springtime precipitation associated with convective activity that devel-ops over the Great Plains. The minimum river discharge (of about 8,000 m3 s-1) occurs towards the end of the boreal
summer and autumn, when the contribution from ice
melt-Jan Feb Mar Apr May Jun Jul Aug Sep Oct Nov Dec
Discharge (m
3s -1)
30000
20000
10000
0
Month Parana - Uruguay
Uruguay Parana
Jan Feb Mar Apr May Jun Jul Aug Sep Oct Nov Dec
Discharge (m
3s -1)
30000
20000
10000
0
Month Rio de la Plata
Jan Feb Mar Apr May Jun Jul Aug Sep Oct Nov Dec
Discharge (m
3s -1)
30000
20000
10000
0
Month Mississippi River
a)
b)
[image:9.595.306.558.70.557.2]c)
Uruguay River at Concordia
Jan Feb Mar Apr May Jun Jul Aug Sep Oct Nov Dec
Discharge (m
3s -1)
30000
20000
10000
0
Month
Parana River at Corrientes
Jan Feb Mar Apr May Jun Jul Aug Sep Oct Nov Dec
Discharge (m
3s -1)
60000
40000
20000
0
Month
Rio de la Plata
Jan Feb Mar Apr May Jun Jul Aug Sep Oct Nov Dec
Discharge (m
3s -1)
Month 60000
40000
20000
0 80000
Jan Feb Mar Apr May Jun Jul Aug Sep Oct Nov Dec
Discharge (m
3s -1)
60000
40000
20000
0
Month
Mississippi River at Vicksburgh
a)
b)
c)
[image:10.595.43.556.64.394.2]d)
Fig. 2: Mean seasonal cycle of river discharge and the historical maximum and minimum for each month for a) Mississippi, b) Rio de la Plata, c) Paraná, and d) Uruguay river.
ing has decreased significantly. An additional factor for the reduced river discharge may be the result of the develop-ment of the North American monsoon system: when pre-cipitation over northwestern Mexico increases (usually at the beginning of July) that over the Great Plains decreases (Douglas and Englehart, 1996; Higgins et al., 1997; Barlow et al., 1998).
The La Plata River discharge (the combined dis-charge of the Paraná/Paraguay and Uruguay rivers) pre-sented in Fig. 1b is fairly uniform around the year, with typical values of about 20,000 m3 s-1. There is a slight
dis-charge increase from February to July (late austral
sum-mer and autumn). However, the analysis of the discharge for each of the subbasins (Fig. 1c) shows that in fact the Paraná and Uruguay rivers each have well defined sea-sonal cycles, but that their peaks are out of phase: the Paraná river has a maximum in late austral summer while the Uru-guay river has largest discharge (although of smaller mag-nitude) between June and November.
[image:10.595.42.562.612.791.2]Figure 2 presents the mean seasonal cycle of river discharge and the historical maximum and minimum for each month (based on monthly time series during 1932-1998 for the Mississippi River and 1904–1993 for the La Plata River). The potential for flooding of the Mississippi
Table 1
Mississippi River La Plata River
Area 3.1 106 km2 3.6 106 km2
Mean annual discharge 17,100 m3 sec-1 21,400 m3 sec-1
Maximum river discharge/ 27,200 m3 sec-1 23,970 m3 sec-1
Time of year April June (and several other months)
Minimum river discharge/ 8,350 m3 sec-1 18,350 m3 sec-1
Time of year September September
Historical Maximum/ 55,000 m3 sec-1 72,000 m3 sec-1
Implications of strong low level jets east of the Andes for enhanced precipitation over subtrop-ical South America
Matilde Nicolini and Celeste Saulo
Univ. of Buenos Aires (UBA), Buenos Aires, Argentina [email protected]
Previous studies have been devoted to study the low-level circulation over South America (Rasmusson and Mo (1996) and Nogués-Paegle and Mo (1997), among others). Particularly, Saulo et al (2000) have characterised the low-level flow and water vapour flux during the September 1997- February 1998 warm season using ETA regional model operational forecasts provided by CPTEC (Centro de Previsao de Tempo e Estudos Climaticos, Brazil), and identified low-level jet events (SALLJ) immersed in a north-erly current that originates in northnorth-erly tradewinds de-flected by the tropical Andes range. One of the main find-ings of these studies is the presence of a maximum mois-ture flux dominated by a northerly and stationary compo-nent east of the Andes. Moisture convergence downstream of this maximum is detected over subtropical and mid-lati-tude Argentina, Uruguay and southern Brazil. Nogués-Paegle and Mo (1997) have identified episodes of strong moisture flux into subtropics corresponding to the weak SACZ phase and positive anomalies in OLR of a seesaw pattern. Garraud and Wallace (1998) studied equatorward incursions of midlatitude air into subtropics and tropics during austral summer and characterised the days –2 and –1 before the onset of these incursions by the presence of a stronger than normal low-level northerly flow with an area of enhanced convection over the region of interest. These two previous works have focused in SACZ or in cold air incursions during summer. Other evidences emphasised the relationship between moisture flux convergence maxi-mum downwind low-level jets and the triggering of con-vection within mesoscale convective systems over this re-gion (Velasco and Fritsch, 1987; Torres and Nicolini, 1999). Present study poses a hypothesis with implications in the occurrence of enhanced precipitation in continental lati-tudes between 25 and 40oS. This hypothesis is that the
rela-tionship between moisture flux convergence in the exit re-gion of the low-level jet and extreme precipitation depends primarily on the incidence of events that penetrate farther south from the mean maximum.
The relevance of this hypothesis in terms of the im-pact of low-level jets in severe weather outbreaks during the warm season has motivated the selection of a subensemble of SALLJ cases more strongly related to pre-cipitation in the mentioned area. These particularly strong jets are denoted Chaco jets because they flow over the bio-geographical province called Chaco. These cases may be related to a secondary maximum described by Sugahara and da Rocha (1996).
basin (Fig. 2a) as revealed from these historical maxima is during the first half of the year, concurrent with the mean maximum of the annual cycle. On the other hand, Fig. 2b shows that flooding in the La Plata basin may occur at any time of the year, with largest values during austral winter. Although not shown here winter maxima tend to be asso-ciated with El Niño episodes, as those during 1982/1983 and 1997/1998. The Uruguay River discharge, while usu-ally small in comparison to the Paraná river, can in some cases achieve values that are as high as the Paraná mean discharge.
The main aspects of the river discharge are summa-rised in Table 1: The La Plata River has a large mean an-nual discharge (larger than the Mississippi River), and its potential for flooding is present at any time of the year (with a maximum in winter). Moreover, floods can cover large areas due to the flat terrain that characterises the region. These remarkable features strongly suggest the need for more detailed studies of the La Plata basin. Indeed, the new challenge ahead is to increase our understanding of the regional climate and hydrology, in order to develop the capability to perform seasonal to interannual forecasts that include the water resources.
References
Barlow, M., S. Nigam, and E.H. Berbery, 1998: Evolution of the
North American Monsoon System. J. Climate, 11, 2238-2257.
Berbery, E. H., and E.A. Collini, 2000: Springtime precipitation
and water vapor flux over southeastern South America. Mon. Wea.
Rev., 128, 1328-1346.
Douglas, A.V., and P.J. Englehart, 1996: Variability of the summer monsoon in Mexico and relationships with drought in the United States. Proceedings of the 21 Annual Climate Diagnostics Work-shop. Huntsville, Alabama, October 28 - Nov 4, 1996.
Higgins, R.W., Y. Yao, E.S. Yarosh, J.E. Janowiak, and K.C. Mo, 1997: Influence of the Great Plains low-level jet on summertime precipitation and moisture transport over the central United States. J. Climate, 10, 481-507.
Mechoso, C. R., 2000: Introduction to VAMOS, Exchanges, this issue
Nogués-Paegle. J., and K.-C. Mo, 1997: Alternating wet and dry
conditions over South America during summer. Mon. Wea. Rev.,
125, 279-291.
A center of positive specific humidity anomaly at 850 hPa is co-located with the area of moisture flux convergence for Chaco jet events. This area of maximum moisture convergence is also coincident with the area where the contribution of the Chaco cases to the seasonal accumulated precipitation is maximum (around 40%, see Fig. 1). This amount of enhanced precipitation for this particular warm sea-son gives support to the mentioned hypothesis. However, a longer time period analysis is necessary to substantiate these preliminary results.
References:
Bonner, W.D., 1968: Climatology of the low level jet. Mon.
Wea. Rev., 96, 833-850.
Garreaud, R.D., and J.M. Wallace, 1998: Summertime in-cursions of midlatitude air into subtropical and tropical South America. Mon. Wea. Rev., 126, 2713-2733.
Nogués-Paegle, J., and K.C. Mo, 1997: Alternating wet and dry conditions over South America during summer.
Mon. Wea. Rev., 125, 279-291.
Rasmusson, E.M., and K.C. Mo, 1996: Large-scale atmos-pheric moisture cycling as evaluated from NMC global analysis and forecast products. J. Climate, 9, 3276-3297. Saulo, A.C., M. Nicolini, and S.C. Chou, 2000: Model char-acterization of the South American low-level flow
dur-ing the 1997-1998 sprdur-ing-summer season. Climate
Dynam-ics, in press.
Sugahara, S., and R.P. da Rocha, 1996: Low-level jet cli-matology during Southern Hemisphere summer over a
South American region (in portuguese), Proceedings of the
IX Congresso Brasileiro de Meteorologia, Campos do Jordão,
SP, Brazil, 1383-1387.
Torres, J.C., and M. Nicolini, 1999: Analysis of a mesoscale
convective system centred over the Río de la Plata.
Aus-tralian Meteorological Magazine, 48, 261-272.
Velasco, I., and J.M. Fritsch, 1987: Mesoscale convective complexes in the Americas. J. Geophys. Res., 92, 9591-9613. For this study ETA model forecast products with an
horizontal resolution of 40 km and 35 levels are used. Cri-terion defined to identify days with occurrence of Chaco jets requires the three conditions similar to Bonner Crite-rion 1 (1968) and adds the requirement that the isotach of 12 m/s extends farther south, at least up to 25oS. Bonner’s
[image:12.595.39.328.64.450.2]criterion assures the presence of a jet-like profile in the lo-cal low-level wind vertilo-cal structure, as a more mesoslo-cale feature and is more frequently verified near Santa Cruz de la Sierra in Bolivia, downwind of the Central Andes. This criterion has been used daily for the whole period and the days with Chaco jet cases have been identified. Only around 40% of the SALLJ cases, verify the selected criterion and consequently penetrate to subtropical latitudes. Compos-ite anomalies have been calculated as the difference be-tween the composites and the warm seasonal mean. Based on this pool of episodes an analysis of both the intensity and characteristics of the Chaco jet circulation and the re-lated moisture meridional transport has been done. A rel-evant result is that in these cases the wind speed is stronger than the summer mean.
Intraseasonal Variations of the South American Summer Rainfall
Alice M. Grimm
Department of Physics, Federal University of Paraná, Curitiba, Brazil
[email protected] Simone E. T. Ferraz
Department of Atmospheric Sciences, University of São Paulo, São Paulo, Brazil
Vicente R. Barros
Department of Atmospheric Sciences, Universidad de Buenos Aires, Buenos Aires, Argentina
Mario B. Dorelo
Physics Institute, Universidad de la Republica, Monte-video, Uruguay
Austral summer is the rainy season over most of South America. The analysis of the summertime circulation and rainfall over this region indicates the existence of a regional summer monsoon regime. The maximum of pre-cipitation during summer exhibits a large intraseasonal variability, revealed by the analysis of outgoing longwave radiation (OLR), which has been used as a proxy for rain-fall (e.g., Paegle and Mo, 1997; Liebmann et al., 1999; Paegle et al., 2000). These studies emphasise the intraseasonal vari-ations of the South Atlantic Convergence Zone (SACZ). Paegle and Mo (1997) and Paegle et al. (2000), using OLR anomalies for November through April for a 20-years pe-riod, filtered to retain scales from 10 to 90 days, performed EOF analysis for a domain including South America and the adjacent area. They focused on the 5th rotated EOF, a
dipole pattern of OLR depicting a well-marked SACZ ac-companied by opposite anomalies in the subtropical plains of South America. Paegle et al. (2000) showed that this di-pole convection pattern is modulated dominantly by modes with periods of 36-40 days and 22-28 days.
The present study examines the intraseasonal vari-ability of the observed summer precipitation (for Novem-ber through March) in a region including the maximum intraseasonal variance of OLR over South America during the austral summer (Liebmann et al., 1999). The data base includes daily rainfall data spanning the period 1965-1990, from 516 stations distributed over a region extending from Patagonia to the southern part of Northeast Brazil. The spectral analysis of these data shows that stations with sig-nificant spectral peaks in each one of the ranges 7-20 days, 21-35 days or 36-70 days have different spatial distribu-tions over the analysed area. EOF analysis was therefore performed on daily precipitation data filtered to retain periods in the ranges of 10-100, 20-30 and 30-70 days, to obtain the modes that most contribute to the variability in each of these ranges. The results show some similarities and some interesting differences when compared to OLR-based results.
The EOF analysis with varimax rotation discloses a mode of variability with strong anomalies concentrated over the SACZ area (Fig. 1A, page 17), as in the 5th EOF of
OLR in Paegle and Mo (1997) and Paegle et al. (2000). It is the leading mode for the 10-100 day filtered data (explain-ing 9.1 % of the variance), and the second one for the other two ranges. The principal component series of that 1st REOF
shows a spectral peak around 26 days and some peaks in the high-frequency end of the spectrum (16, 13 and 11 days), but there are not significant peaks in the range 30-60 days. Although the anomalies are of opposite signs in the SACZ region and in the subtropical plains, this mode is not really dipole-like for the anomalies are far stronger (almost one order of magnitude) over the SACZ region. Composites of rainfall for extreme opposite phases of this mode confirm this feature. It indicates that the mechanisms that lead to excess rainfall in the SACZ region are not the main mecha-nisms that lead to periods of severe drought in the sub-tropical plains during summer. The 4th rotated mode
(ex-plaining 6.7 % of the variance) shows strong anomalies over the subtropical plains and very weak opposite ones over the SACZ area (this is the first mode in the 20-30 days range). It is worth mentioning that the composites of OLR anomalies for the extreme opposite phases of the 1st REOF
show opposite anomalies of more comparable magnitudes, hence a much better defined dipole-like pattern, as in Paegle et al. (2000).
The principal component series of the 1st
precipita-tion REOF and of the 5th OLR REOF (Paegle et al., 2000)
show a good agreement concerning the location of extreme values (Fig. 1B, page 17). The OLR mode leads the rainfall mode by two or three days, which would be expected. The agreement is not perfect, though, especially during 1986.
There is a better defined dipole-like intraseasonal mode of precipitation, but its northern centre is displaced northward, by about 7o, em relation to that of the 1st REOF.
Its southern centre is over South Brazil. It is the 3rd REOF
for the 10-100 day filtered data (explaining 7.7% of the vari-ance), and the 1st REOF in the 30-70 days range. Its
princi-pal component series presents spectral peaks around 60, 32-22, 16 and 13 days. The anomalies in the northern cen-tre of the dipole are stronger than those in the southern centre (but not as much as in the 1st REOF), and are located
in the region where usually OLR anomalies associated with the 30-60 day oscillation are located over South America. Extreme values of the principal component series of that 3rd REOF sometimes coincide with those of the 1st REOF
(and of the 5th REOF of Paegle et al. (2000)), but they are
not the same mode.
In summary, results from this work, which is still in progress, indicate that the 1st REOF of rainfall during
is far weaker. The 30-60 day oscillation does not seem to modulate this mode significantly, but spectral peaks around 26, 16, 13 and 11 days are present. On the other hand, the 3rd REOF presents a more dipole-like pattern, but its centers
are displaced northward. Eventually, extremes of these modes coincide in time, and then the SACZ shows a broader cloud (and rainfall) band compared to when only the first mode is more active. The 3rd REOF is modulated
by the 30-60 day oscillation, but spectral peaks in the 32-22 days range and around 16 and 13 days are also important.
Although OLR is a reasonable proxy for rainfall, the comparison of the rainfall-based results with OLR-based results shows that differences between them, concerning their variability and spatial distribution, could make diffi-cult the separation of rainfall modes with neighbour cen-tres and higher frequency, when using OLR.
Acknowledgments
This investigation is supported by CNPq (Brazil) and the Inter-American Institute for Global Change Research (IAI).
References
Liebmann, B., G.N. Kiladis, J.A. Marengo, and T. Ambrizzi, 1999: Submonthly convective variability over South America and the South Atlantic Convergence Zone. J.Climate, 12, 1877-1891. Paegle, J.N., L.A. Byerle, and K.C. Mo, 2000: Intraseasonal
modu-lation of South American summer precipitation. Mon.Wea.Rev.,
128, 837-850, 2000.
Paegle, J.N., and K.C. Mo, 1997: Alternating wet and dry condi-tions over South America during summer. Mon.Wea.Rev., 125, 279-291.
CIMAR-5 Cruise off Northern Chile at 27oS (Caldera to Easter Island):
15-29 October 1999
José Rutllant and René Garreaud
Depto. de Geofisica, Universidad de Chile Santiago, Chile
1. Introduction
A multi-disciplinary programme has been set up by the Chilean National Oceanographic Committee (CONA) to promote marine research using the R/V Vidal Gormaz. For the period 1999-2000 the programme has considered research in the Chilean oceanic islands: Easter and Sala and Gomez islands in 1999 and the Robinson Crusoe, Alexan-der Selkirk, San Felix and San Ambrosio islands in 2000.
An important component of the 1999 cruise was the oceanographic and meteorological east-west transect at 27oS
(Caldera to Easter island) carried out in the second half of October.
The meteorological component of the programme aimed at the study of the marine boundary layer (MBL) structure and its space variability, including the marine stratocumulus cloud deck and the subsidence inversion. Another objective was to assess the skill of reanalysed data in representing the actual troposphere within a largely in-situ data void area.
The study area encompasses a coastal strip subject to year-round upwelling processes under the quasi-perma-nent action of the SE Pacific subtropical anticyclone as well as the open ocean MBL capped by stratocumulus clouds and its transition to trade wind cumuli. The study period matched approximately the maximum in sea-level pres-sure and low-cloud cover extension of the seasonal cycle and the cold extreme of the ENSO interannual cycle.
2. Scientific, Environmental and Socio-economic Issues
On the local to regional scales, the coastal strip sup-ports coastal wind-driven upwelling processes responsi-ble for a wealth of economic resources as pelagic fisheries, fresh water from coastal stratus and tourism. Besides the large-scale forcing of the coastal winds, several ocean-at-mosphere coupling mechanisms control the regional com-ponent of the winds associated with the land-ocean ther-mal contrast along the coast and other factors as the height step change of the subsidence inversion associated with the upwelling front (SST steepest east-west gradient).
The alongshore equatorward winds driving upwelling of cold, nutrient rich and CO2 saturated waters are modulated by atmospheric coastally-trapped distur-bances (CDT’s; e.g. coastal lows). These CDT’s, that drift southwards at phase speeds of 10-20 ms-1 produce, on a
quasi-weekly periodicity, strong alongshore gradients in the windstress, sea-level pressure, inversion base height and cloudiness. Besides the typical signal in the low clouds (clear areas adjacent to a thick stratus wedges to the north) in the satellite pictures, little is known about the offshore extension of such disturbances.
On the continental scale the deep convection over the South American Altiplano during the austral summer forces a strong diurnal signal that could be in some way related to the diurnal cycle of the stratocumuli albedo (thickness, liquid water content, droplet spectra and concentrations) over the tropical-subtropical SE Pacific. This fact should influence the diurnal cycle of the surface energy budget at the ocean surface, with consequences on climate simulation (cloud parameterisations and feedbacks).
3. Meteorological Measurements
height and reflectivity profiles up to 4000 m height with a Vaisala laser ceilometer; and (3) twice-a-day Vaisala GPS rawinsonde launchings at 00:00 and 12:00 UTC. Standard on board surface mete-orological and sea state observations together with satellite imagery and the NCEP/NCAR Reanalysis data were also collected for the cruise period.
[image:15.595.41.327.66.567.2]4. A few synthetic results
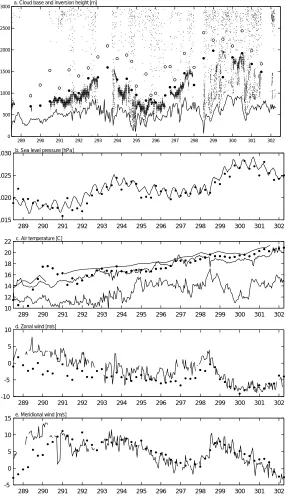
Figure 1 depicts the 27oS east-west cross
sec-tion (longitude and date) of the following: a) height of the inversion base and top and low-cloud base, b) SLP, c) air temperature d) zonal and e) meridional wind components. It can be readily seen that the general westward increase in the MBL depth, Tair and SLP, was interrupted by a syn-optic-scale disturbance that came across the ship track centred on days 22 to 25, bringing a consist-ent signal in all measured variables.
Other relevant results include a westward transition at about 95oW from a thin layer of
strato-cumuli capping a fully coupled MBL to cumulus clouds rising into patchy and thin stratus within a decoupled MBL reaching up to 1700 m depth near Easter island. Also wind directions in the first 200-km off the coast show onshore and northward departures from the NCEP/NCAR reanalysis ones, in agreement with results reported else-where.
5. Acknowledgements
We want to thank the effort in organisation and funding provided by the Chilean National Oceanographic Committee (CONA), the efficiency of the R/V Vidal Gormaz crew and the dedica-tion of the technician from the Nadedica-tional Weather Service (DMC) Mr. José Nuñez in maintaining the equipment on board. The laser ceilometer was kindly provided by Dr. Bruce Albrecht from the University of Miami. Credit is also due to the Pro-gram in Atmospheric Dynamics and Climate (PRODAC) and to the Department of Geophysics (DGF), both at the Universidad de Chile and to the DMC for facilities and additional funding.
Report prepared by José Rutllant and René Garreaud (DGF)
Project PI’s: Jorge Carrasco (DMC) and José Rutllant (DGF)
Project Co-PI’s René Garreaud (DGF) and Juan Quintana (DMC).
289 290 291 292 293 294 295 296 297 298 299 300 301 302 0
500 1000 1500 2000 2500 3000
289 290 291 292 293 294 295 296 297 298 299 300 301 302
1015 1020 1025 1030
289 290 291 292 293 294 295 296 297 298 299 300 301 302
10 12 14 16 18 20 22
289 290 291 292 293 294 295 296 297 298 299 300 301 302
-10 -5 0 5 10
289 290 291 292 293 294 295 296 297 298 299 300 301 302
-5 0 5 10 15
a. Cloud base and inversion height [m]
b. Sea level pressure [hPa]
c. Air temperature [C]
d. Zonal wind [m/s]
e. Meridional wind [m/s]
Fig. 1. MBL cloudiness, trade inversion and surface variables during CIMAR-5.
(a) Cloud base height (small dots) from 30 min laser ceilometer. Also shown are the top (solid circles) and base (open circles) of the trade inversion derived from twice-a-day rawinsoundings, and the lift-ing condensation level (solid line) from 30 min near-surface observa-tions.
(b) 30-min average of sea level pressure (solid line). Filled circles are the 6-hr NCEP/NCAR reanalysis data interpolated to the ship loca-tion.
(c) As (b) but for air temperature. Upper thin line is SST. Lower thin line is dew point temperature.
Fig. 2 (from Paegle and Berbery, pages 6-8): Amplitude of the diurnal cycle of convective cloudiness estimated from geostationary satellites for DJF 1985-1991. [Thanks to Rene Garreaud for providing the data.]
Fig. 1 (from Magaña, page 19): Composite of precipitation anomalies (mm/day) during a) five El Niño (1965,1972, 1982, 1986, 1991, 1997), and b) La Niña (1964, 1970, 1973, 1975, 1988, 1998) summers (Jun-Jul-Aug-Sep).
[image:16.595.155.469.65.486.2] [image:16.595.45.559.557.724.2]50E 60E 70E 80E 90E 0
5N 10N 15N 20N 25N 30N
50E 60E 70E 80E 90E
0 5N 10N 15N 20N 25N 30N
0.6
100E 110E 120E 130E 140E 0
5N 10N 15N 20N 25N 30N
100E 110E 120E 130E 140E 0
5N 10N 15N 20N 25N 30N
1.6
100E 110E 120E 130E 140E 30S
25S 20S 15S 10S 5S 0
100E 110E 120E 130E 140E 30S
25S 20S 15S 10S 5S 0
-1 -1
-1 -1
2.5
120W 110W 100W 90W 80W 5N
10N 15N 20N 25N 30N 35N
130W 120W 110W 100W 90W 5N
10N 15N 20N 25N 30N 35N
1.6
40W 30W 20W 10W 0
5S 0 5N 10N 15N 20N 25N
40W 30W 20W 10W 0
5S 0 5N 10N 15N 20N 25N
-0.3
-0.3
0.6 H
H
H
H
H
L
L
L
L
L
(a1) (b1)
(a2) (b2)
(a3) (b3)
(a4) (b4)
(a5) (b5)
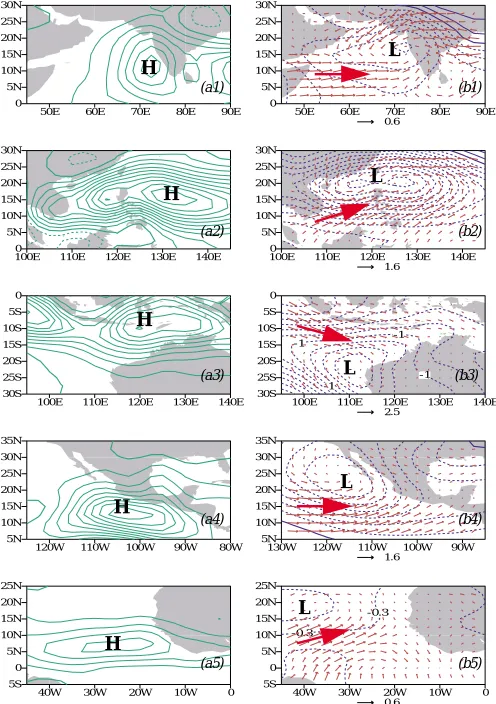
Fig. 1 (Yu and Wallace, page 20-21):
a1: Regression of monthly mean precipitation for the Indian mon-soon region, based on the Xie and Arkin dataset for the period 1979-97, upon the standardised PC1 of precipitation anomalies from the same dataset for the domain included within the figure. Contour intervals: 0.4 m/ day per standard deviation of the standardised PC1 time series (psd). b1: Regression patterns of SLP and surface wind for the Indian monsoon region, based on NCEP Reanalysis for the period 1979-97, upon the standardised PC1 time series. Con-tour intervals: 0.1 hPa psd. The zero conCon-tour is thickened and nega-tive contours are dashed.
a2(b2), a3(b3), a4(b4), and a5(b5) are as in a1(b1), but for the East Asian, the Australian, the North American, and the African mon-soon regions, respectively.
Fig. 1 (from Grimm et al., page 13-14):
(A) First Rotated Empirical Orthogonal Function (1st REOF)
pattern for the 10-100 day filtered daily rainfall.
(B) Principal component of 1st REOF for rainfall and of 5th REOF
[image:17.595.40.289.61.634.2] [image:17.595.307.555.78.430.2]portance of the coupled interactions between the ocean, land and atmosphere as they relate to the monsoon. NAME will benefit from linkages to other ongoing projects within GEWEX/GAPP, including the CEOP, LDAS and the NCEP Regional Reanalysis and from linkages to other field pro-grammes within CLIVAR/PACS and CLIVAR/VAMOS, such as the American Low-level Jets (ALLS) and EPIC.
Some anticipated benefits from NAME include (i) a better understanding of the key components of the North American Monsoon System (NAMS) and their variability; (ii) a better understanding of the role of the NAMS in the global water cycle; (iii) improved observational data sets and (iv) improved simulation and monthly-to-seasonal pre-diction of the monsoon and regional water resources.
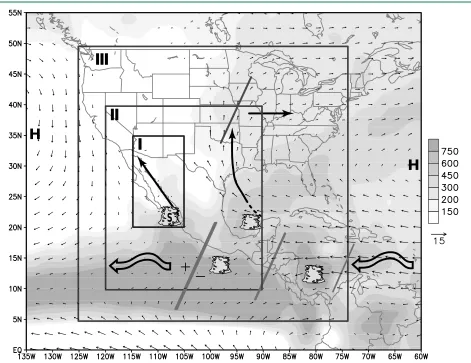
NAME is designed using a 3 tiered approach involv-ing different spatial scales (Figure 1). Each tier has a scien-tific focus aimed at improved warm season precipitation prediction, and activities related to each tier will proceed concurrently. NAME studies presume that the general na-ture of the warm season evolution of the atmospheric cir-culation and precipitation regimes over North America is reasonably well known from previous studies.
Tier I focuses on mesoscale-features in the core mon-North American Monsoon Experiment (NAME)
Wayne Higgins
Climate Prediction Center/NCEP/NWS/NOAA Camp Springs, USA
State-of-the-art climate models do not accurately rep-resent the spatial distribution and temporal variability of warm season precipitation over southwestern North America. The North American Monsoon Experiment (NAME) is an internationally coordinated effort to improve the prediction of warm season precipitation over that re-gion on seasonal time scales. NAME objectives will be achieved by a symbiotic mix of diagnostic and modelling studies, together with enhanced monitoring. The integrated thrust of NAME can be broadly characterised as improv-ing warm season precipitation prediction over North America.
NAME is designed to link CLIVAR/VAMOS, which has an emphasis on ocean-atmosphere interactions and GEWEX/GAPP, which has an emphasis on land-atmos-phere interactions in order to determine the relative
im-Fig. 1: Schematic illustrating the multi-tiered approach of the North American Monsoon Experiment (NAME). The schematic also shows mean (July-September 1979-1995) 925-hPa vector wind and merged satellite estimates and station observations of precipitation (shading) in millimeters. Circulation data are taken from the NCEP/NCAR Reanalysis archive.
I
II
III
H
H
[image:18.595.65.536.376.739.2]will include the development of a NAME Science and Implementation plan and a CLIVAR/GEWEX Planning Workshop to consider the plan. NAME preparations will include a build-up phase leading to a two-summer En-hanced Observing Period (EOP). A two-year period (pos-sibly 2003-2004) has been identified as providing an excel-lent opportunity to carry out NAME data collection activi-ties because (i) a new generation of remote sensing satel-lites will be available to provide unprecedented enhance-ment of observing capabilities to quantify critical atmos-pheric, surface, hydrologic and oceanographic parameters; (ii) several NWP centres (e.g. NCEP, ECMWF) are able to run their coupled modelling system to provide dynami-cally consistent datasets over the NAMS domain, and (iii) other GEWEX/GAPP and CLIVAR/VAMOS field experi-ments are planned during this period. The components and scope of the observational effort will be closely linked to the magnitude of the overall effort. The NAME principal research phase will continue for several years following the data collection phase, culminating in a NAME Research Conference. A timetable for NAME activities is being de-veloped for the NAME Science and Implementation Plan.
Interannual Climate Variability in the Mexico, Central America, and Carribean Region
Víctor O. Magaña
Center for Atmospheric Sciences, National Autono-mous University of Mexico, Mexico City, Mexico [email protected]
The Mexico, Central America and Caribbean Region exhibits what may be considered a monsoonal climate, with an intense rainy season during summer months, and a rela-tively dry season during winter. There are various forms of variability related to a rich spectrum of meteorological phenomena such as: Northerlies during winter and hurri-canes during summer. However, it has not been until re-cently that the dynamical mechanisms that control interannual climate variability in the region have begun to be analysed. The intense signal of El Niño in the region has led a number of scientists to explore various prognostic schemes to predict the characteristics of the summer rainy season.
When summer climate variability over the region is studied, the presence of two warm pools, one over the northeastern Pacific (off the coast of Mexico) and one over the Intra Americas Seas (IAS) should be considered. In the former, convective activity is intense, constituting the In-ter Tropical Convergence Zone (ITCZ). In the latIn-ter, tropi-cal convection is relatively weak due to intense subsidence. The relatively low precipitation over the IAS may be con-sidered abnormal for a warm pool region. The other im-portant element that determines the characteristics of pre-cipitation is the interaction of the topography with the trade winds, which leads to differentiated precipitation patterns in the Caribbean and Pacific coasts of Central America. soon region over southwestern North America. The goal
of activities in this region is to improve the monitoring and modelling of the diurnal heating cycle and its influence on convection as a necessary step towards improved warm season precipitation prediction. Of primary interest are re-lationships between the low-level circulation features (in-cluding the land breeze/sea breeze circulation and Gulf of California (GC) low-level jet) and the diurnal cycle of con-vection. Enhanced observations will be required to vali-date models and analyses, including sea-surface tempera-tures along the Gulf of California, transects from the Gulf of California to the Sierra Madre Occidental (wind, sur-face temperature, sea-level pressure, and precipitation from automated weather stations), pilot balloons and possibly NOAA-P3 flights. Regional mesoscale models and the Eta Model Data Assimilation System (EDAS) will be used to guide the enhanced monitoring activities.
Tier II focuses on regional-scale features over south-western North America and the warm pool region to the southwest of Mexico. The goal of activities in this region is an improved description and understanding of intraseasonal aspects of the monsoon. A key question con-cerns the importance of interactions between Tropical East-erly Waves (TEWs) and GC moisture surges in the predic-tion of monsoon precipitapredic-tion. Related quespredic-tions include: (1) What fraction of TEWs produce GC surge events?; (2) What is the physical setting for the pronounced double peak structure in monsoon precipitation?; (3) How strong are relationships between the Madden-Julian Oscillation, tropical cyclone activity, and monsoon precipitation?; and (4) What role do energy sources over the InterAmerica Sea/ Gulf of Mexico play in Great Plains low-level jet (GPLLJ) variability? These activities will benefit from linkages to EPIC, which emphasises variability in the ITCZ-cold tongue complex of the eastern tropical Pacific.
Tier III focuses on aspects of the continental-scale monsoon circulation. Here the goal is an improved descrip-tion and understanding of spatial/temporal linkages be-tween warm season precipitation, circulation parameters and the dominant boundary forcing parameters. Among the questions that will be addressed by NAME are the fol-lowing: (1) How is the evolution of the warm season pre-cipitation regime over North America related to the sea-sonal evolution of the boundary conditions?; (2) What are the interrelationships between year-to-year variations in the boundary conditions, the atmospheric circulation and the continental hydrologic regime?; (3) Can coupled mod-els reproduce the observed summer precipitation in aver-age years and years with ENSO/PDO influence?; (4) What is the relative importance of tropical cyclones and extra-tropical systems for warm season precipitation over the continent? These studies will be carried out in tandem with land surface model experiments and land data assimila-tion experiments, and will benefit from multi-year regional reanalyses and retrospective soil moisture analyses.