Abstract—Chestnuts (Castanea Sativa) are produced in
Portugal in considerable amounts, thus providing an important economic trade. Furthermore, apart from being eaten in their natural state, they can be used for a multiplicity of industrial applications, either in their natural form or after dehydration.
In this work the drying kinetics of different cultivars of chestnuts was investigated, and the experiments were carried out under isothermal conditions, using a convective drier set to a temperature of 60 ºC. The experimental data obtained for the variations of moisture content along drying was fit to three thin layer models from literature with success. The experimental drying rate points were expressed as moisture ratio versus time.
The results obtained allowed concluding that some chestnuts had higher initial moisture content than others and also that the presence or absence of the peel did not influence the initial moisture content of the chestnuts from the different cultivars tested.
Regarding the drying curves observed for the cultivars tested, they show some differences. As to the mathematical modeling of the drying kinetics, the three models used show different performances, being the Vega-Lemus model slightly less adequate to fit the experimental sets of points.
Index Terms—chestnut, drying, kinetic model, moisture
ratio.
I. INTRODUCTION
N Mediterranean countries the chestnut (Castanea sativa)
is a very important food, especially in countries like Spain and Portugal, where its large production represents an important economic trade. However, the chestnut is not only valued in the Mediterranean countries, being also quite appreciated in some Asian countries [1].
The chestnut is afood product that at its natural state is already considered a dried product, because its moisture content is of approximately 50 % [2], [3], [4]). Still, the dehydration of chestnuts represents an economic advantage besides allowing diversification of the products offered to the consumer[1]. Among these are for example chestnut paste or chestnut powder to incorporate into a wide variety of food products [2].
Manuscript received January 28, 2013; revised March 19, 2013. P. M. R. Correia is with the CI&DETS, Instituto Politécnico de Viseu, Portugal (e-mail: paulacorreia@esav.ipv.pt).
P. M. R. Correia thanks FCT for financial support through project PEst-OE/CED/UI4016/2011.
R. P. F. Guiné is with the CI&DETS, Instituto Politécnico de Viseu, Portugal (corresponding author - phone: +351-232 446 600; fax: +351-232 426 536; e-mail: raquelguine@esav.ipv.pt).
R. P. F. Guiné thanks FCT for financial support through project PEst-OE/CED/UI4016/2011.
The study of the dehydration of hygroscopic food products is very complex and is further limited due to their complex internal structure. Many studies have been reported relatively to the moisture transfer phenomenon for many different food products, and considering different types of kinetics. This is in fact a field in which scientific literature is abundant, either relating to mechanistic or empirical kinetic models, or even a combination of both [5], [6], [7], [8]. However, studies about the drying kinetics of chestnut are scarce.
The design of driers is frequently done based on empirical knowledge, by observing similar cases. Nevertheless, reliable process modeling is very important and requires a deep knowledge of the physical and chemical behavior of the food, as well as its drying kinetics, which accounts for the mechanisms of water removal [9], [10].
During drying many changes take place inside the foods [11], and these modifications affect the product mass transfer properties such as the mass diffusion and mass transfer coefficients. The drying process involves simultaneous coupled heat and mass transfer phenomena which occur inside the material being dried [12]. From the engineering point of view it is very important to understand the complex processes that occur during drying, being this achieved through modeling. Process modeling is of unquestionable importance for the design and operation of dryers at optimal drying conditions [13], [14]. Many mathematical models have been used to describe drying processes, being quite common the use of the diffusion laws [15].
The moisture removal processes and their dependence on the process variables are expressed in terms of the drying kinetics, and therefore the determination of the drying rates is essential for development of reliable process models [16], [13].
The present work aimed at comparing the drying kinetics of several chestnut cultivars, for the convective drying performed at 60 ºC, using different thin layer models from the literature.
II. EXPERIMENTAL PROCEDURE
A. Materials
The chestnuts (Castanea sativa) used in the present study
were collected in the North of Portugal, and different local cultivars were used: Aveleira, Martainha, Judia, Longal, Maraval, Marigoule, Rebordã and Verdeal.
B. Methods
The chestnuts were dried in a convective drier that was
Modeling of Drying Kinetics of Chestnuts
Paula M. R. Reis Correia, Sónia Andrade and Raquel P. F. Guiné
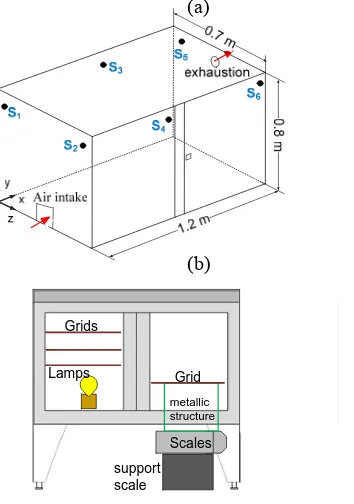
designed and built in the laboratory for the drying of food products. This consisted in a structure with a parallelepiped shape (dimensions 0.70*0.80*1.20 m) as represented in Fig. 1, made of a stainless steel base involved with insolating polyurethane plates. The air temperature inside the dryer was measured at six different locations, by using 6 thermocouples (K type) homogeneously distributed inside the convective dryer, and connected to a data acquisition board (TC-08 from Pico Technology). The signal was obtained in degrees Celsius by the Pico Log software Recorder 5.20.1. An automatic weighing-machine (connected to a computer) was used to continuously weight the mass inside the chamber. Both data, air temperature and weight loss, were continuously measured and recorded on a computer. Additionally, the evolution of the air relative humidity inside the convective dryer was monitored using a hygrometer (Opus10 – Lufft), and the data later downloaded on the computer.
Lamps
metallic structure
Grid Grids
[image:2.595.99.276.280.532.2]Scales support scale
Fig. 1. Schematic representation of the drier: (a) dimensions and placement of temperature probes (b) front view with placement of grids, scale and lamps.
The air was heated by 4 lamps of 60 W each, which were connected to an on/off controller, in order to maintain constant the desired temperature. Furthermore, a low power fan was installed in the intake air grill, so as to promote the air flow inside the convector and also to remove the excess of humidity from the convector dryer. All trials were done at a temperature that was kept approximately constant in 60 ºC.
In each trial the evolution of the moisture content of the samples was determined from weight loss, measured by weighing the whole set of chestnuts along drying.
The data recording for all variables was made at 5 minutes intervals.
The initial moisture content of all samples was determined by a Halogen Moisture Analyzer (Mettler Toledo HG53). Three replicates were made and the medium
values and standard deviations were then calculated. III. MATHEMATICAL MODELING
Mathematical models are useful for the simulation and design of driers and drying operations aimed at improving product quality as well as saving energy. Besides, simulation models are also important for the project of new or for the improvement of existing drying systems as well as for the control of the drying operations [15].
The transport properties of both the material and the drying medium, air in most cases, allow describing the drying kinetics. In the drying of food products, it is typically used the drying constant, k, which combines all the transport properties and may be defined by a thin layer equation [15], [17]. Thin layer models are equations that describe the drying phenomena in a combined way, regardless of the controlling mechanism, and have been used to estimate drying times for several products and to access drying curves. Many thin layer equations, varying widely in nature, are available in the literature and have been used by many investigators to successfully explain the drying of several agricultural products [17],[18], [15].In the present study the drying kinetics was monitored in terms of evolution of product mass along drying, which allowed calculating the moisture content at every time, given the initial moisture content, and the data was then expressed in terms of the dimensionless variable moisture ratio, defined as:
e e
W
W
W
W
MR
0
(1) where W is the moisture content at time t, W0 is the initial
moisture content and We is the equilibrium moisture content,
all expressed in dry basis.
To model the drying kinetics the experimental points (MR, t) were fitted to three empirical kinetic models from
literature cited by Baini and Langrish, 2007 [19] and presented in Table I. For the treatment of the data the software Sigma Plot (Systat software, Inc.), version 11.0, was used.
IV. RESULTS AND DISCUSSION
Fig. 2 shows how the moisture content of the chestnuts varied among cultivars and peeling state. For the varieties Marigoule and Maraval were not done trials with the unpeeled chestnuts, and for that reason there are no results for those cases. The graph shows that the moisture content is very similar regardless on the peeling state, for all cultivars analyzed. As to the differences among cultivars, it stands out that varieties Aveleira, Maraval, Judia and
TABLEI
EMPIRICAL MODELS USED TO DESCRIBE THE DRYING KINETICS
Model name Equation
Page MR = Exp(- k tn)
Vega-Lemus MR = Exp(a + k t)2
Modified Henderson MR = a Exp(- k0 t) + b Exp(- k1 t) + c Exp(- k2 t)
(a)
Longal have a similar moisture content, about 50 g water/100 g, whereas varieties like Rebordã, Marigoule, Martainha and Verdeal present moisture contents under 50 %.
[image:3.595.49.285.353.716.2]Fig. 2. Moisture content of the chestnuts before drying, determined with the peel and after peeling.
Fig. 3 reports the variation along drying of the dry basis moisture content (expressed in g of water per g of dry solids) for the different cultivars of chestnuts, when dried with the peel.
With peel
Time (h)
0 5 10 15 20 25 30 35
W (
g
w
a
te
r/
g dry
sol
ids
)
0,0 0,2 0,4 0,6 0,8 1,0 1,2
Aveleira Judia Longal Maraval
With peel
Time (h)
0 5 10 15 20 25 30
W
(g
w
ate
r/
g
d
ry
s
o
li
d
s)
0,0 0,2 0,4 0,6 0,8 1,0
[image:3.595.307.546.392.753.2]Marigoule Martainha Rebordã Verdeal
Fig. 3. Variation of the dry basis moisture content along drying for chestnuts from different cultivars, dried with the peel. (a) varieties Aveleira, Judia, Maraval and Longal; (b) varieties Marigoule, Martainha, Rebordã, Verdeal.
The different cultivars present different drying rates, as
seen by the slopes of the curves (Fig. 3). For example, cultivars Aveleira, Judia, Maravla and Longal, despite showing a similar initial moisture content, behave differently, with Aveleira showing the higher slope of the drying curve and Longal the lowest slope. In this way, Aveleira chestnuts dry relatively faster than Longal chestnuts. Also stands out that cultivars Martainha and Rebordã, for example, show different initial moisture content, 41.73 and 44.40 respectively, but after 15 hours of drying reached a similar moisture content, thus indicating that the moisture removal is faster in the Rebordã cultivar.
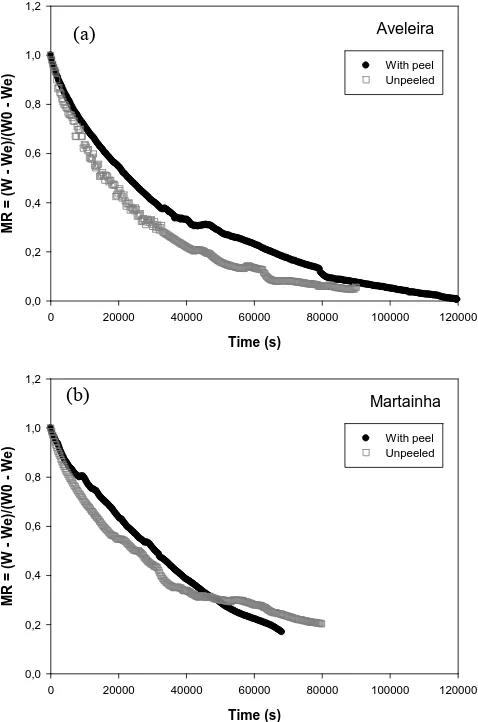
The graphs in Fig. 4 show the variation along drying of the moisture ratio, as defined by equation (1), for the drying of the peeled and unpeeled fruits of two chestnut cultivars, Aveleira and Martainha, used as examples. The graph (a) reveals that the removal of the peel accelerates the drying operation, allowing reaching approximately the same moisture in considerably less time (20000 s 5.5 h). This effect is due to the additional resistance that the peel offers to the moisture diffusion in drying.
As to the graph (b) in Fig. 4, relatively to the Martainha cultivar, the effect of the peel is not so clear, as initially the absence of the peel reveals itself to have a positive effect in the drying rate, but later towards the end of drying the situation was reversed. As to comparing both cultivars, the drying rates are very similar.
Aveleira
Time (s)
0 20000 40000 60000 80000 100000 120000
M
R
=
(W
-
We)/
(W0
-
We)
0,0 0,2 0,4 0,6 0,8 1,0 1,2
With peel Unpeeled
Martainha
Time (s)
0 20000 40000 60000 80000 100000 120000
M
R
=
(W
-
We)/
(W0
-
We)
0,0 0,2 0,4 0,6 0,8 1,0 1,2
With peel Unpeeled
Fig. 4. Comparison between the evolution of moisture content along drying for peeled and unpeeled chestnuts: (a) cultivar Aveleira and (b) cultivar Martainha.
(b) (a) (a)
Fig. 5 shows the curves obtained by fitting the experimental moisture ratio versus time data for all trials
done with the different cultivars with the peel. For this fitting the Page model was used. The results show that important differences were observed among cultivars, being Aveleira the one that dries faster, showing a higher slope, while the Longal or Maraval cultivars dry slower. On the other hand, cultivars Judia and Marigoule show practically coincident drying curves.
With peel
Time (s)
0 20000 40000 60000 80000 100000 120000
M
R
=
(W
-
W
e
)/
(W
0
-
W
e
)
0,0 0,2 0,4 0,6 0,8 1,0 1,2
Fit Aveleira Fit Judia Fit Longal
Page Model
With peel
Time (s)
0 20000 40000 60000 80000 100000 120000
M
R
=
(W
-
W
e
)/
(W
0
-
W
e
)
0,0 0,2 0,4 0,6 0,8 1,0 1,2
Fit Maraval Fit Marigoule Fit Rebordã
[image:4.595.49.289.170.529.2]Page Model
Fig. 5. Fit to the experimental data for all cultivars dried with the peel, using Page model. (a) varieties Aveleira, Judia and Longal; (b) varieties Maraval, Marigoule and Rebordã.
Table II shows the results of the fittings made to the different drying trials with the Page model. The parameters in the Page model are k and n, where k represents the drying constant. Also in Table II are reported the values of the regression coefficient (R), standard error of estimate (SEE) and W statistic for a significance level lower than 0.0001. By comparing the values of the drying constants, Martainha/peeled shows the higher value and Martainha/unpeeled the lower value. Also a similar trend is observed for the Aveleira cultivar (peeled and unpeeled dryings). As to the values of n, the differences are important, varying from 0.7235 to 1.1415.
Relatively to the quality of the fits, as evaluated through the statistical information, in all cases the Page model reveals adequate to describe the drying curves for the chestnuts tested.
Apart from the page model, two other models were used to fit the experimental data. Fig. 6 shows, as an example, the results of the fittings made to the experimental data relative to the drying of the Aveleira chestnuts unpeeled.
For the graphs in Fig. 6 models Page, Vega-Lemus and Modified Henderson were used, being these expressed by the formulas in Table I. The results of the fittings for the last two models are presented in Table III, being the results for the Page model already presented in Table II.
The results show that while Page and modified Henderson models are very adequate to fit the experimental set of points, the Vega-Lemus equation gives a poorer prediction of the drying behavior of the chestnuts. This is clearly visible in the graph in Fig. 5 and the regression coefficient also corroborates this finding, being quite lower when compared to the values for the other two models, 0.9792 for Vega-Lemus against 0.9958 for Page and 0.9978 for Modified Henderson.
V. CONCLUSION
The results in the present work allowed concluding that the drying kinetics of the different cultivars of chestnuts tested are relatively different, showing different drying rates. Also it was observed that some chestnuts had higher initial moisture content than others, and this also contributed to the drying behavior of the chestnuts. On the other hand, the presence or absence of the peel did not influence the initial moisture content of the different cultivars.
As to the mathematical modeling of the drying curves, the three models used show different performances, being the Vega-Lemus model slightly less adequate to fit the experimental sets of points.
TABLEII
RESULTS OF THE FITTING WITH PAGE MODEL TO THE EXPERIMENTAL DATA FOR DIFFERENT DRYINGS
Cultivar k n R SEE1 W statistic2
Aveleira
(unpeeled)
0.00008 0.9071 0.9958 0.0225 0.9296
Aveleira
(peeled)
0.00020 0.8607 0.9991 0.0103 0.9674
Martainha
(unpeeled)
0.00001 1.0526 0.9978 0.0156 0.9227
Martainha
(peeled)
0.00050 0.7235 0.9962 0.0176 0.8615
Judia
(unpeeled)
0.00008 0.8849 0.9998 0.0035 0.9801
Longal
(unpeeled)
0.00007 0.8756 0.9968 0.0150 0.8914
Maraval
(unpeeled)
0.00003 0.9690 0.9995 0.0047 0.9816
Marigoule
(unpeeled)
0.00010 0.8541 0.9988 0.0085 0.9706
Rebordã
(unpeeled)
0.00001 1.1415 0.9943 0.0297 0.9566
1 SEE: Standard error of estimate 2 Significance level < 0.0001
Aveleira
Time (s)
0 20000 40000 60000 80000 100000 120000
M
R
=
(
W
- W
e
)/
(W
0
- W
e
)
0,0 0,2 0,4 0,6 0,8 1,0 1,2
Unpeeled Page
Aveleira
Time (s)
0 20000 40000 60000 80000 100000 120000
M
R
=
(
W
- W
e
)/
(W
0
- W
e
)
0,0 0,2 0,4 0,6 0,8 1,0 1,2
Unpeeled Vega-Lemus
Aveleira
Time (s)
0 20000 40000 60000 80000 100000 120000
M
R
=
(W
- W
e
)/
(W
0
- W
e
)
0,0 0,2 0,4 0,6 0,8 1,0 1,2
Unpeeled Modified Henderson
Fig. 6. Fit to the experimental for cultivar Aveleira dried unpeeled, using different kinetic models. (a) Page; (b) Vega-Lemus; (c) Modified Henderson.
ACKNOWLEDGMENT
The authors thank the research center CI&DETS.
REFERENCES
[1] R. P. F. Guiné and R. M. C. Fernandes, “Analysis of the drying kinetics of chestnuts,” Journal of Food Engineering, vol. 76, no. 3,
pp. 460–467, Outubro 2006.
[2] H. Breisch, A. Boutitie, J. Reyne, G. Salasses, and P. Vaysse,
Châtaignes et Marrons. Paris: Ctifl-Centre Technique Interprofessionnel des Fruits et Légumes, 1995.
[3] A. López, M. T. Piqué, J. Boatella, A. Ferrán, J. Garcia, and A. Romero, “Drying characteristics of the hazelnut,” Drying Technology, vol. 16, no. 3–5, pp. 627–649, Jan. 1998.
[4] A. López, M. T. Piqué, and A. Romero, “Simulation of Deep Bed Drying of Hazelnuts,” Drying Technology, vol. 16, no. 3–5, pp. 651– 665, 1998.
[5] M. A. Salgado, A. Lebert, H. S. Garcia, J. Muchnik, and J. J. Bimbenet, “Development of the characteristic drying curve for cassava chips in monolayer.,” Drying Technology, vol. 12, no. 3, pp.
685–696.
[6] D.-W. Sun and J. L. Woods, “Simulation of the Heat and Moisture Transfer Process During Drying in Deep Grain Beds,” Drying Technology, vol. 15, no. 10, pp. 2479–2492, 1997.
[7] G. Vázquez, F. Chenlo, R. Moreira, and E. Cruz, “Grape Drying in a Pilot Plant With a Heat Pump,” Drying Technology, vol. 15, no. 3–4,
pp. 899–920, 1997.
[8] P. S. Madamba, “Optimization of the Drying Process: An Application to the Drying of Garlic,” Drying Technology, vol. 15, no.
1, pp. 117–136, 1997.
[9] R. P. F. Guiné, D. M. S. Ferreira, M. J. Barroca, and F. M. Gonçalves, “Study of the drying kinetics of solar-dried pears,”
Biosystems Engineering, vol. 98, no. 4, pp. 422–429, Dezembro 2007.
[10] K. Sacilik, “Effect of drying methods on thin-layer drying characteristics of hull-less seed pumpkin (Cucurbita pepo L.),”
Journal of Food Engineering, vol. 79, no. 1, pp. 23–30, Mar. 2007. [11] J. Crank, The mathematics of diffusion, 2nd ed. London: Oxford
University Press, 1975.
[12] S. K. Chou, M. N. A. Hawlader, and K. J. Chua, “On The Drying of Food Products in a Tunnel Dryer,” Drying Technology, vol. 15, no.
3–4, pp. 857–880, 1997.
[13] C. T. Kiranoudis, E. Tsami, and Z. B. Maroulis, “Microwave Vacuum Drying Kinetics of Some Fruits,” Drying Technology, vol.
15, no. 10, pp. 2421–2440, 1997.
[14] C. F. Hansmann, “Dehydration of Pears Without Sulphur Dioxide,”
Drying Technology, vol. 16, no. 8, pp. 1665–1685, 1998.
[15] R. P. F. Guiné, P. Lopes, M. J. Barroca, and D. M. S. Ferreira, “Effect of ripening stage on the solar drying kinetics and properties of S. Bartolomeu pears (Pirus Communis L.),” International Journal of Academic Research, vol. 1, no. 1, pp. 46–52, 2008.
[16] R. P. F. Guiné and J. A. A. M. Castro, “Pear Drying Process Analysis: Drying Rates and Evolution of Water and Sugar Concentrations in Space and Time,” Drying Technology, vol. 20, no. 7, pp. 1515–1526, 2002.
[17] İ. T. Toğrul and D. Pehlivan, “Modelling of drying kinetics of single apricot,” Journal of Food Engineering, vol. 58, no. 1, pp. 23–32, Jun.
2003.
[18] J. S. Roberts, D. R. Kidd, and O. Padilla-Zakour, “Drying kinetics of grape seeds,” Journal of Food Engineering, vol. 89, no. 4, pp. 460– 465, Dec. 2008.
[19] R. Baini and T. A. G. Langrish, “Choosing an appropriate drying model for intermittent and continuous drying of bananas,” Journal of Food Engineering, vol. 79, no. 1, pp. 330–343, Mar. 2007.
TABLEIII
RESULTS OF THE FITTING USING VEGA-LEMUS AND MODIFIED HENDERSON MODELS TO THE DRYING OF AVELEIRA CULTIVAR DRIED AFTER PEELING
Model Parameter name
Parameter value
R SEE1 W
statistic2
Vega-Lemus 0.9792 0.0481 0.9307
a 0.9055
k -0.00001
Modified Henderson 0.9978 0.0158 0.9262
a 0.9219
k0 0.00003
b -0.0109
k1 0.2000
c 0.0891
k2 0.3000
1 SEE: Standard error of estimate 2 Significance level < 0.0001
(a)
(b)