Abstract. Background: Previous studies, by ourselves and others, have indicated that gene transcripts are detectable extracellularly. Advancing on this work, in order to investigate the feasibility of analysing global gene expression profiles and so the possibility in the future of identifying panels of circulating mRNA biomarkers that may be diagnostic, prognostic or predictive for cancer, here we performed the first whole genome microarray analysis of human serum. Patients and Methods: RNA was isolated from pre-surgery serum and corresponding breast tumour and normal tissue biopsies, and from post-surgery and normal control serum. Specimens were examined using Affymetrix whole genome microarrays and quantitative reverse-transcriptase polymerase chain reaction (qRT-PCR). Results: Of the 54,675 mRNAs/variants analysed, approximately 8% and 45% were called Present in serum and breast tissue specimens, respectively. Differentially expressed genes were identified for each group of specimens analysed. Analysis, by qRT-PCR, of 3 selected transcripts further indicated that the nucleic acids detected were mRNA, not DNA. mRNAs are apparently present in serum and their global detection and identification can be successfully achieved using microarray technologies. Conclusion: The potential implication of this novel finding is that using
microarrays it may be possible to identify a panel of extracellular mRNAs that are diagnostic, prognostic and/or predictive of outcome for cancer patients.
Cancer biomarkers (biological markers) could potentially
be used to monitor the presence and progression of disease
and response to treatment. Such analysis has great
potential for early cancer detection and monitoring.
Currently, however, cancer diagnosis and monitoring
generally relies on monitoring of the tumour. Limitations
of this approach include the invasive procedures necessary
to obtain suitable specimens and the fact that a tumour
mass must have grown to contain approximately a billion
cells to be detectable as a lump (therefore, its
presence/recurrence is generally well established when
detected). Furthermore, this approach allows analysis at
only one particular time point in the existence of a tumour
and in one location in the body. Effective, clinically useful,
cancer biomarkers should be accurately detectable in a
readily accessible body fluid, such as serum, saliva or urine,
permitting minimally invasive procedures and
on-going/sequential monitoring of the course of the disease
(e.g.progression, response to therapy) over time.
Serum cancer markers routinely analysed in the clinic are
all proteins (e.g.prostate-specific antigen, carcinoembryonic
antigen and ·-fetoprotein), all of which have presented
problems of specificity and sensitivity. Little attention has
been given to the possibility of using RNA as a specific serum
marker, given the instability of mRNA and the presence of
RNAses in serum, and also with increased levels of RNAses
reported in sera from cancer patients compared to individuals
who do not have cancer (1). A small number of studies (2-12),
however, have indicated that it is possible to amplify
extracellular mRNA from the serum and/or plasma of cancer
patients despite the presence of elevated RNase levels, *Both authors contributed equally to this work.
Correspondence to: Lorraine O'Driscoll, National Institute for Cellular Biotechnology, Dublin City University, Dublin 9, Ireland. Tel: +35317005700/5402, Fax: +35317005484, e-mail: [email protected]
Key Words: Breast cancer, extracellular RNA, serum, whole genome microarray, quantitative reverse-transcriptase polymerase chain reaction (qRT-PCR).
Feasibility and Relevance of Global Expression Profiling of Gene
Transcripts in Serum from Breast Cancer Patients Using
Whole Genome Microarrays and Quantitative RT-PCR
LORRAINE O’DRISCOLL1*, ELAINE KENNY1*, JAI PRAKASH MEHTA1,
PADRAIG DOOLAN1, HELENA JOYCE1, PATRICK GAMMELL1, ARNOLD HILL2,
BRENDAN O’DALY2, DONAL O’GORMAN3and MARTIN CLYNES1
1National Institute for Cellular Biotechnology and3School of Health and Human Performance,
Dublin City University, Dublin 9;
indicating that the detected RNA transcripts are somehow
protected from degradation. This phenomenon was supported
by studies indicating that free RNA added to plasma is rapidly
degraded and unamplifiable, unlike endogenous RNA in plasma specimens (13). Recently, Li et al. (14) reported promising results from the analysis of sera mRNA (from
patients with oral squamous cell carcinomas compared to
“normal sera” controls), using an Affymetrix array (U133A)
representing approximately 19,000 genes, indicating the
potential of this approach.
Limitations of the previously reported studies, however,
included the fact that in some cases serum/plasma was not
filtered or ultracentrifuged, raising the possibility that cells
or platelets circulating in the bloodstream may have been
included in the RNA isolations. Furthermore, the
reproducibility of techniques in general was not considered.
To address these issues, we initially optimised and applied
methods to the analysis of transcripts in medium
conditioned by a range of cancer (including breast, lung,
nasal and melanoma) cell types (15) and showed that
amplifiable mRNAs are detectable extracellularly for a
broad range of cancer cell types and that there is apparently
some selectivity in this process i.e. not all cell types transcribing a particular mRNA pass it into the extracellular
environment and not all mRNAs transcribed by a particular
cancer cell type are detectable extracellularly.
Advancing on this, in the study described here, we
investigated the feasibility of applying whole genome
microarray techniques for an unbiased global search for
novel gene expression patterns in serum. The potential to
identify transcripts associated with the presence of breast
cancer was considered by analysing sera specimens from
recently diagnosed breast cancer patients in comparison
with (i) their serum profiles when the tumour was
removed, (ii) corresponding breast tumour and normal
tissues, and (iii) serum profiles from women with no
history of cancer. Here we report the first whole genome
microarray analysis of extracellular mRNAs in serum from
breast cancer patients.
Patients and Methods
Patient characteristics.This study involved analysis of serum, breast tumour specimens and matched normal breast tissue from 4 female patients aged between 44 years and 87 years (median=60 years) at the time of diagnosis. Blood and tissue specimens were procured at St. Vincent’s University Hospital, following approval from SVUH Ethics Committee and with patients’ informed consent. Blood specimens, collected in plain tubes (to allow clotting), were immediately sent by courier to the NICB, Dublin City University, where serum was isolated (within 4 hours of procurement) and stored at_80˚C until required for analysis. These included serum specimens procured pre-surgery (i.e.surgery to remove the breast tumour) and post-surgery (i.e.within 2-4 months of the date of surgery). Tissue specimens were examined macroscopically,
immediately snap-frozen in liquid nitrogen, and were subsequently stored at_80˚C until transported, on dry-ice, to the laboratory for analysis. Six normal serum specimens from consenting female volunteers of a similar age range who do not/never had cancer were also included in these studies as controls.
RNA isolation from serum.Serum was gently removed from the blood clot, placed in 15 ml tubes (Corning, New York, USA), and centrifuged at 400 rcf, for 15 mins. After passing through a 0.45 Ìm filter, 500 Ìl aliquots of serum were stored in labeled cryovials (Costar, Biosciences, Dublin, Ireland) and were placed at _80˚C. Total RNA was isolated from 1 ml of each serum specimen by extracting with TriReagent (Sigma; Poole, England), using a modification of the procedure that we recently developed for isolating RNA from cell line-conditioned media (15). In brief, 4x 250 Ìl aliquots of serum were added to 4x750 Ìl TriReagent, respectively. These were incubated for 5-10 min on ice to ensure complete dissociation of nucleoprotein complexes, 0.2 ml of chloroform was then added to each specimen and this was shaken vigorously for 15 s, followed by incubation at room temperature for 15 min. This was then centrifuged at 12,000 rpm for 15 min at 4˚C, and the aqueous phase containing RNA (upper layer) was removed and transferred into a fresh RNAse-free 1.5 ml Eppendorf tube. Isopropanol (0.5 ml) and glycogen (final concentration 30 Ìg/ml) were added, incubated at room temperature for 5-10 min. The Eppendorf tubes were then centrifuged at 12,000 rpm for 30 min at 4˚C to pellet the precipitated RNA. Taking care not to disturb the RNA pellet, the supernatant was removed and the pellet was subsequently washed by the addition of 750 Ìl of 75% ethanol and vortexed. Following centrifugation at 7,500 rpm for 5 min at 4˚C, supernatant was removed (this wash step was repeated). The RNA pellet was allowed to air-dry for 5-10 min and was then re-suspended in 2-3 Ìl of diethylpyrocarbonate-treated water. The four RNA isolates from each individual serum specimen were pooled and the quantity and quality of extracted RNA was assessed by reading absorbance at 260 nm, 280 nm and 230 nm using a Nanodrop ND-1000 (Labtech International, Ringmer, East Sussex).
RNA extraction from tumour and normal tissue specimens.For RNA analyses from snap-frozen tissue, dissected tumour and normal tissue specimens were homogenised, on ice, in 1 ml TriReagent (Sigma) and total RNA was subsequently isolated as described elsewhere (16). As for serum specimens, RNA quantity and purity were assessed at 230 nm, 260 nm and 280 nm using a Nanodrop (ND-1000; Labtech. International) and on an Agilent Bioanalyser RNA 6000 Nanochip (Agilent 2100; Agilent Technologies, Cheshire, England).
Microarray hybridisation.Hybridisation solution (1 mol/l NaCl, 20 mmol/1 EDTA, 100 mmol/1 2-(N-morpholino) ethanesulfonic acid, and 0.01% Tween 20) was used to pre-hybridise Affymetrix; U133 Plus 2.0 oligonucleotide microarrays for 15 min at 45˚C and 60 rpm. The pre-hybridisation solution was removed and replaced with 200 Ìl hybridisation solution containing 0.05 Ìg/Ìl fragmented cRNA. The arrays were hybridised for 16 h at 45˚C and 60 rpm. Arrays were subsequently washed (Affymetrix Fluidics Station 400) and stained with streptavidin-phycoerythrin (Stain Buffer, 2 mg/ml acetylated bovine serum albumin (BSA) and 10 Ìg/ml streptavidin R-phycoerythrin), and were scanned on an Affymetrix GCS GeneChip GeneArray scanner. Resulting data were analysed using GCOS (Affymetrix), dCHIP (www.dchip.org; (19)), and GeneSpring (Agilent Technologies).
Normalisation and filtering.Raw data files for sera and for tissue specimens were processed and normalised by dCHIP algorithm. In this normalisation procedure, an array with median overall intensity is chosen as the baseline array against which other arrays are normalised at probe intensity level, using an invariant set of probes for normalisation. A filter was designed to include a fold change of at least 1.2 and at-test with ap-value cut-off <0.05 between groups being compared. Differences of ≥50 Affymetrix arbitrary units between serum groups (i.e. pre-surgery, post-surgery and normal) and differences of at least 100 units between normal and tumour tissue data were considered.
qRT-PCR.Following priming with oligo(dT) at 65˚C for 5 min, followed by 1 min incubation on ice, cDNA was synthesised from 100 ng total RNA, using Superscript III RNase H_ (with increased thermal stability; Invitrogen), RNase OUT Ribonuclease (active against RNase A, B and C; Invitrogen) and a cocktail of dNTPs, by incubating at 50˚C for 1 h, followed by 70˚C for 15 min, in a 40 Ìl reaction volume. The cDNA (diluted 1:3 in nuclease-free water), was amplified in 25 Ìl reactions, by qRT-PCR, using an ABI 7500 Real-time PCR System (Applied Biosystems International, Warrington, England). Following evaluation of 12 potential endogenous controls, including S18, acid ribosomal protein, B2-microglobulin, ‚-actin, cyclophilin, GAPDH, phosphoglyce-rokinase, ‚-glucuronidase, hypoxanthine, ribosyl transferase, transcription factor IID, and transferrin receptor (Applied Biosystems) in a random selection of 6 serum RNA specimens (including 2 pre-surgery specimens, 2 post-surgery specimens, and 2 normal specimens), this study involved evaluation of 3 target transcripts (MADP-1, TRK-fused gene (TFG), and adaptor protein with pleckstrin homolog and src homology 2 domains (APS)) in all 14 sera (4 pre- and post-surgery pairs and 6 normal) and 8 tissue (4 pairs of tumour and normal tissue) specimens. The temperature profile of all reactions was 50˚C for 2 min, 95˚C for 10 min, 40 cycles of 95˚C and 60˚C for 1 min. Individual specimens were analysed in triplicate, with absence of cDNA samples included as negative controls. Minus reverse transcriptase enzyme and minus oligo(dT) controls verified no DNA/pseudogene contamination of starting material. Where relevant, expression of transcript threshold cycle (CT) results were subsequently normalised to ‚-actin (i.e.the endogenous control determined here to be most suitable from the 12 possibilities evaluated, based on constant levels detected across sera and tissue specimens, respectively)
[image:3.595.313.537.75.542.2]and calibrated against MCF-7 cDNA using the comparative CT method, 2–¢¢CT(20). The relative quantity of expression in pre-surgery sera was set at 1; changes in fold expression in post-surgery sera were calculated relative to pre-post-surgery sera data.
Results
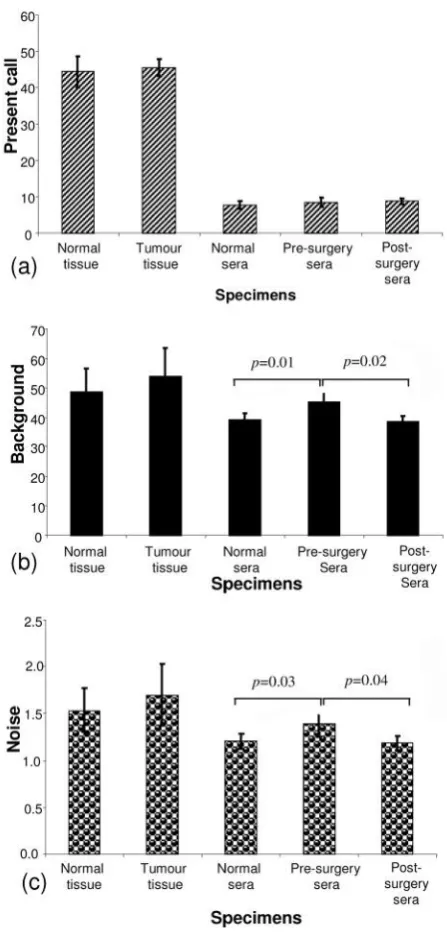
Quality control of microarray data.
Present call: As indicated in Figure 1a, quality control (Q.C.) analysis of the 14 sera (from 4 pre-surgery, 4
post-surgery and 6 normal) microarray datasets indicated an
average percentage present call of 8.34% (±1.06 standard
deviation (SD)). No significant difference was detected
between present calls in the 3 groups of serum specimens
analysed (t-test: pre-surgery seraversuspost-surgery sera: p=0.87; pre-surgery seraversusnormal sera:p=0.3; post-surgery sera versus normal sera: p=0.15) (ANOVA, p=0.326). The mean present call for all 8 tissue specimens (4 tumour and 4 normal breast tissues) was 44.99% (±3.25
SD); again, there was no significant difference between
present calls in the tumour group compared to the normal
tissue group (t-test: tumourversusnormal tissuep=0.67). The present call for the tissue specimens is in the order
expected for high quality RNA from cell lines from many
origins (21).
[Note: The "Present Call" for each Affymetrix GeneChip
probe set is calculated by the Affymetrix Microarray Suite
version 5 (MAS5) algorithm, which utilises differences
between paired perfect match (PM) and mismatch (MM)
25-mer probes to determine whether a given gene is
expressed and to measure the expression level (or signal) of
that gene. Wilcoxon signed rank test statistics is applied to
determine if the perfect matches show more hybridization
signal than their corresponding mismatches to produce the
detection call (Present (P), Absent (A) or Marginal (M)) for
each probe set. Additional details are available from
Affymetrix (www.affymetrix.com)].
Background: Based on cell line Q.C. parameters, the accepted background level on a microarray chip is <100.
Results from all 22 specimens analysed in this study fell
within the acceptable range; for sera specimens, the mean
background was 40.81% (±3.97 SD), while for tissue
specimens the background was 51.39% (±8.6 SD). While
the background levels did not differ significantly between
the normal and tumour tissues (t-test;p=0.44) or between the normal sera and the post-surgery sera groups (p=0.61),
the background detected in the pre-surgery serum group
differed significantly from that in the post-surgery sera
group (p=0.02) and to that in the normal sera group
(p=0.01) (ANOVA,p=0.007 (Figure 1b).
Noise: Acceptable noise levels for microarray results are <3; here we report 1.62±0.28 for tissue specimens and
1.25±0.13 for sera specimens. While the noise levels in the
tumour and normal tissue groups (p=0.46) and the normal
sera and the post-surgery sera groups (p=0.68) did not
differ significantly, the noise levels in the pre-surgery sera
group differed significantly from that in the post-surgery
sera group (p=0.04) and to that in the normal sera group
(p=0.03) (ANOVA,p=0.019), despite all specimens being processed randomly and as a single experiment (Figure 1c).
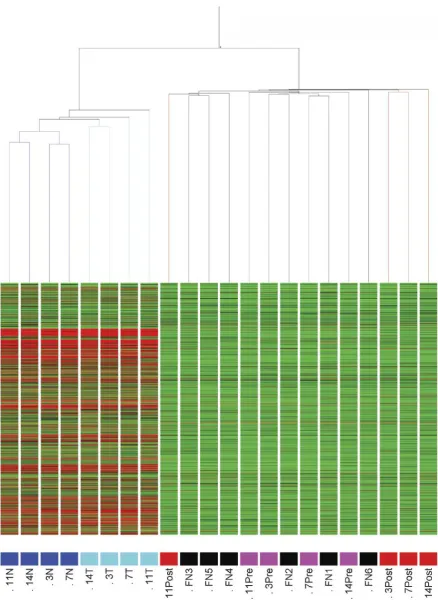
Unsupervised hierarchical clustering. In order to identify specimen similarity/diversity in our group of 22 specimens,
condition tree clustering (using all genes Pearson, average
linkage) was performed using GeneSpring software. As
indicated in Figure 2, tissue and sera specimens formed
discrete clusters and tissue specimens sub-clustered into the
4 normal tissues and the 4 tumour tissues; such discrete
sub-clustering was not observed for the sera specimens. Three
of the post-surgery sera (specimens 3, 7 and 14) aligned
closely together, as did 3 of the normal sera (specimens FN
3, FN 4 and FN 5), and 2 of the pre-surgery specimens (i.e.
specimens 3 and 11). Otherwise, there was no particular
order of data set clustering, considering the information
available on these specimens.
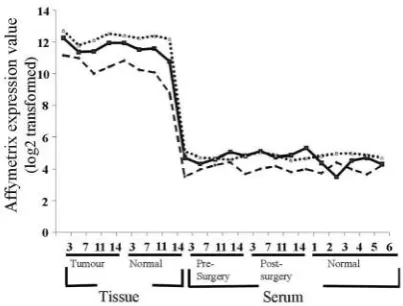
Detection of house-keeping gene transcripts. Probesets representing the 5’, middle, and 3’regions of both GAPDH
and ‚-actin are present on the whole genome microarrays
used in this study. While the overall expression levels of
GAPDH and ‚-actin in all serum specimens were greatly
reduced in comparison to corresponding tissue specimens
(as expected), the 5’, middle, and 3’regions of transcripts
were detected in all 22 (8 tissue and 14 sera) specimens, as
indicated in Figure 3 (GAPDH data shown for all
specimens as example results). A significantly higher level
of expression was detected with 3’ compared to middle
compared to 5’(3’>M>5’) probesets for both GAPDH and
‚-actin in all tissue and serum (both ANOVA, 3’:M:5’
GAPDH p<0.001; ‚-actin p<0.001) specimens analysed. This is most likely due to an inherent 3’amplification bias
of the Affymetrix protocol (22).
Analysis of differentially expressed transcripts. Analysis of differentially expressed transcripts (fold change of at least
1.2 fold, a difference of at least 50 Affymetrix arbitrary
units, and at-test with a p-value cut-off <0.05) between serum groups is summarised in Figure 4. Thirty-nine
transcripts were found to be differentially expressed
between the pre-surgery serum group and the post-surgery
serum group; the majority of these (38/39) were at higher
levels in the post-surgery sera. Comparing pre-surgery sera
to normal sera data indicated 56 transcripts to be
differentially expressed; in this case, the majority (47/56) of
transcripts were found at higher levels in normal sera,
compared to pre-surgery sera. Analysis of post-surgery sera
and normal sera showed only 9 transcripts to be
differentially expressed between these groups (6/9 at higher
suggesting that the post-surgery and normal sera (i.e.both
cases where no cancer present) are more similar to each
other, than to the pre-surgery sera. Based on these findings,
as expected, when the post-surgery and normal sera data
were considered as a single group and compared to
pre-surgery sera, the majority (52/57) of transcripts were found
to be at higher levels in this group compared to those of the
pre-surgery sera. It is interesting to note that the trend seen
when comparing pre-surgery sera with post-surgery sera (i.e.
differentially expressed transcripts were generally at lower
levels in pre-surgery sera) mirrored that found for the
corresponding tissue specimens. Specifically, of the 2,365
transcripts differentially expressed (fold change≥1.2 fold;
difference of at ≥100 Affymetrix arbitrary units; t-test p<0.05) between the tumour and normal tissue groups, approximately 20% (465/2,365) were at higher levels in the
tumour tissues, while the remaining 80% (1,900/2,365) were
expressed at significantly lower levels in the tumour tissue
compared to those of the normal breast tissue specimens.
qRT-PCR indicated that isolated RNA was not contaminated by genomic DNA.Analysis of all specimens (aliquots of the same RNA as used for microarray studies) by qRT-PCR
supports the observation of mRNAs in serum from
individuals with and without breast cancer. Serum and tissue
specimens tested in the absence of either reverse
transcriptase or oligo(dT) reverse transcription primer
resulted in no amplified product (after 40 cycles of
amplification) upon analysis of MADP-1, 18S, acid
ribosomal protein, B2-microglobulin, ‚-actin, cyclophilin,
GAPDH, phosphoglycerokinase, ‚-glucoronidase,
hypoxanthine ribosyl transferase, transcription factor IID,
and transferrin receptor, suggesting that the RNA isolated
and analysed by microarray and qRT-PCR was not
contaminated with genomic DNA. All cases where
oligo(dT) and reverse transcriptase were excluded –
precluding cDNA generation – yielded no amplified product
(amplified products would be expected if corresponding
DNA sequences were present).
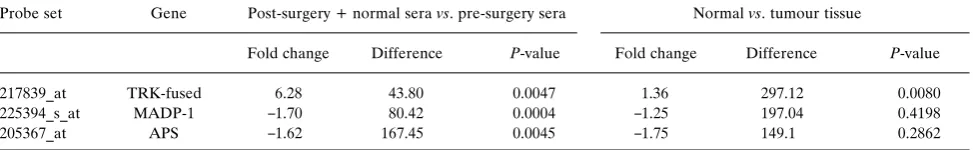
qRT-PCR validation of microarray data.Based on microarray results, 3 transcripts were selected for analysis by qRT-PCR
(see Table I for expression values and Present/Absent call).
It is important to note that in selecting transcripts for
qRT-PCR analysis, consideration was given not only to arbitrary
expression values and Present/Absent calls, but also to fold
changes, differences, andp-values for expression between groups being compared (see example indicated in Table II).
These included TRK-fused gene mRNA which was chosen
as it was detected (although called Absent) in all
pre-surgery sera, but absent in all post-pre-surgery and normal
serum. TRK-fused gene mRNA was expressed (and called
Present) in all tissue specimens, but was at a significantly
higher expression level in tumour compared to normal
specimens. MADP-1 was selected as it was detected (i.e.
expression values greater than 0) in all specimens and it was
called Present in all specimens (except one post-surgery
serum (specimen 14) and 2 normal sera (FN 5 and 6)), and
it was expressed at higher levels in post-surgery and normal
sera compared to pre-surgery sera. APS followed a similar
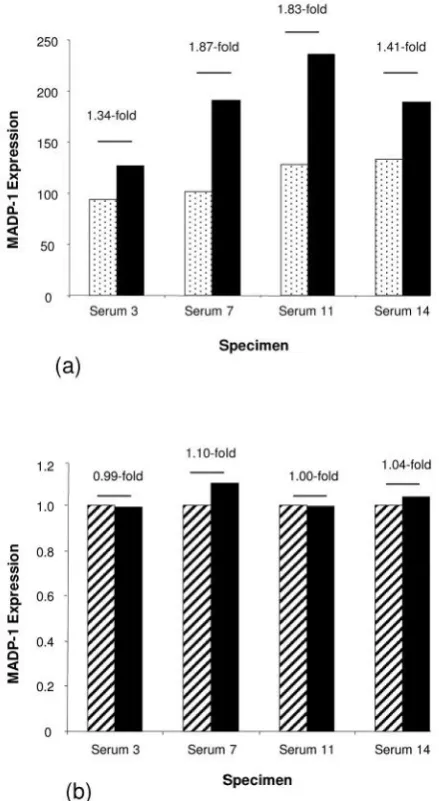
[image:6.595.66.268.76.229.2]trend to MADP-1 (see Table I). However, while all 3 Figure 3.Microarray data indicated that GAPDH 5’ (dashed line), middle
[image:6.595.307.534.78.272.2](solid line) and 3’ (dotted line) mRNA sequences were detected in all tissue and sera specimens analysed.
transcripts were detected in normal and tumour RNA
specimens and in the calibrator (MCF-7) sample,
TRK-fused gene mRNA and APS mRNA transcripts were not
detected in any of the sera specimens. MADP-1 was
detected in all tissue and serum specimens, as expected
from the microarray data. However, while microarray
analysis suggested an approximate 1.61-fold increased
expression in post-surgery, compared to pre-surgery sera,
this was not reflected in the qRT-PCR data (mean 1.04-fold
increased expression by qRT-PCR) (Figure 5).
Discussion
RNA markers have potential advantages over protein
markers for cancer due to the exquisite specificity of
RT-PCR/qRT-PCR. The possibility of simultaneously detecting
a number of transcripts, which may be of more clinical
relevance than more limited analysis of a single gene
product, is a potential reality. Until recently, however, the
general assumption has been that there could be no
detectable mRNAs in serum, due to the presence of high
levels of RNase enzymes. Recent studies have shown that,
possibly as a result of endogenous circulating mRNAs being
protected within nucleoprotein complexes (23-24), this is
not so and that such mRNAs may be detected using
appropriately sensitive techniques. Here, in this whole
genome analysis of human serum mRNA, we report more
than 6,000 detectable transcripts.
Comparison of pre-surgery, post-surgery and normal
serum indicated that similar numbers of transcripts may be
detectable in serum under normal and pathological
conditions. Although all specimens were isolated, amplified,
labeled and run on microarray chips as a single experiment,
the background levels and noise associated with the
pre-surgery group was significantly higher than that for the
post-surgery and normal groups. Due to the limited numbers of
specimens included in this pilot study, it is not possible to
determine if this observation is relevant or an anomaly.
Larger future studies will help to clarify this.
Previous reported studies, using smaller microarrays,
have suggested that extracellular gene transcripts can be
[image:7.595.59.543.94.270.2] [image:7.595.58.545.341.416.2]studied. Analysis of RNA isolated from saliva from 10 Table I.Affymetrix expression values and present (P)/absent (A) calls in all 22 specimens for 3 gene transcripts selected for further analysis by qRT-PCR.
Probe set Gene 3Pre 7Pre 7Pre 11Pre 11Pre 14Pre 14Prre 14Pre 3Post 3Post 7Post 7Post 11Post 11Post 14Post 14Post
217839_at TRK-fused 59.29 A 56.17 A 29.04 A 63.88 A 31.91 A 1.01 A 1.00 A 1.00 A 225394_s_at MADP-1 94.32 P 102.08 P 129.94 P 133.78 P 126.55 P 190.70 P 236.85 P 189.35 A 205367_at APS 260.71 P 187.96 P 318.52 P 313.48 P 318.69 P 431.65 P 513.26 P 479.31 P
Probe set Gene FN1 FN1 FN2 FN2 FN3 FN3 FN4 FN4 FN5 FN5 FN6 FN6
217839_at TRK-fused 35.58 A 1.00 A 8.41 A 1.00 A 1.04 A 1.00 A 225394_s_at MADP-1 238.16 P 154.36 P 219.00 P 208.84 P 227.54 A 161.54 P 205367_at APS 425.58 P 387.36 P 545.31 P 443.46 A 532.82 P 293.53 A
Probe set Gene 3N 3N 7N 7N 11N 11N 14N 14N 3T 3T 7T 7T 11T 11T 14T 14T
217839_at TRK-fused 793.83 P 907.54 P 823.54 P 842.44 P 1295.01 P 1139.45 P 1088.13 P 1033.25 P 225394_s_at MADP-1 724.48 P 757.64 P 1232.01 P 1271.83 P 544.26 P 713.19 P 633.86 P 1306.50 P 205367_at APS 167.99 P 185.52 P 388.51 P 653.73 P 187.14 P 123.16 P 178.03 P 310.72 P
Table II.Microarray data fold change, difference and p-value information considered when selecting transcripts for qRT-PCR analysis (derived from expression values presented in Table I).
Probe set Gene Post-surgery + normal seravs. pre-surgery sera Normalvs. tumour tissue
Fold change Difference P-value Fold change Difference P-value
217839_at TRK-fused 6.28 43.80 0.0047 1.36 297.12 0.0080
225394_s_at MADP-1 _1.70 80.42 0.0004 _1.25 197.04 0.4198
healthy individuals (using Affymetrix U133A arrays,
representing approximately 19,000 genes) indicated that
many transcripts (˜3,100) are detectable in this environment and that results for 3/3 selected transcripts could be
validated by qRT-PCR; qRT-PCR data, however, was not
shown (25). Advancing on this study and comparing
expression levels (criterion: p<0.05) in 10 normal saliva compared to saliva from 10 individuals with oral squamous
cell carcinoma (OSCC) – again using U133A arrays –
approximately 1,679 transcripts were found to be
differentially expressed (836 up-regulated and 843
down-regulated in OSCC). Applying a criterion of >3.5-fold
difference in expression level and p<0.01, nine known cancer-related transcripts were selected, from this analysis,
for qRT-PCR analysis; seven of which validated the
microarray results (26). More recently, U133A microarray
analysis of serum specimens from this cohort (20 OSCC and
20 normal) was reported. Applying a filter of 2-fold
difference in expression andp<0.05, 335 transcripts were found to be differentially expressed: 233 up-regulated and
122 down-regulated in OSCC compared to normal
specimens (14). Microarray results for 5/10 (50%) selected
transcripts were confirmed by qRT-PCR; in all cases, the
fold change detected by qRT-PCR was less than that found
using microarray analysis.
In our study of serum pre- and post- breast cancer
surgery and normal sera, we found that only one out of
three transcripts selected based on microarray data was
detectable in serum specimens using qRT-PCR. The
Affymetrix probeset targets the 3’ region of this
transcript (MADP-1), while the qRT-PCR primer/probe
set amplifies a region much further 5’of this sequence.
Possible explanations for this lack of validation may
include the detection of different splice variants by these
different methods and/or the existence of partly degraded
MADP-1 transcripts in serum, which may be more likely
to be detectable at the 3’region (by microarrays) than
further 5’ (by qRT-PCR). Future qRT-PCR studies
specifically aimed at validating microarray results could
involve designing primer/probe sets precisely to the
sequence region identified by the Affymetrix probeset
and, based on recent studies indicating a preponderance
of 5’mRNA reported in maternal plasma (27), they may
also involve the use of random primers for cDNA
formation. However, if information on the likelihood of
full-length transcripts being produced is considered
useful for potential biomarker identification, there is
obviously merit in amplifying coding (including 5’ and
middle) regions.
As described above, Li et al. (14) reported 5/10 transcripts identified by microarrays to be validated by
qRT-PCR, while only 1/3 of our selected transcripts were
detected by qRT-PCR. The fold changes observed using
microarrays were not subsequently validated using
qRT-PCR. However, it should be considered that the serum
specimens analysed in these two studies were from
different cancer types: OSCC studied by Liet al.(14) and breast cancer, with very small tumour sizes, studied in the
analysis presented here. Additionally in our study, serum
was filtered prior to RNA isolation to remove any blood
cells that may have remained, while Liet al. (14) did not include a filtering step in their protocol. Other differences
[image:8.595.58.278.80.481.2]between these studies include the fact that Liet al.(14) used random primers when forming cDNA for qRT-PCR Figure 5. (a) Microarray analysis indicated increased expression of
analysis, while we used oligo(dT) primers to target the
mRNA poly(A) tail. Furthermore, to ensure that products
we amplified were of RNA, not DNA, origin, we included
(_RT) and (_)oligo(dT) specimens, as well as omitting
cDNA, as our qRT-PCR controls; Liet al. (14) omitted RNA as negative controls.
Kumar et al. (28) recently suggested that expression microarray and qRT-PCR analysis of saliva specimens might
actually detect genomic DNA, rather than mRNA, as
reported in previously published papers. This assumption
was based on their analysis of “no-RT” (i.e. no reverse
transcriptase enzyme included in the cDNA reaction) and
“+RT” conditions yielding similar amounts of PCR
product. Our microarray results cannot definitively rule out
the presence of DNA encoding for any of the approximately
55,000 transcripts analysed if the amplification and labeling
methods routinely used prior to applying cRNA onto
Affymetrix microarrays may lead to some false-positives due
to DNA pseudogene contamination (as suggested by Kumar
et al.(28), but more recently rebutted by Wonget al.(29)). However, our qRT-PCR analysis on aliquots of the same
RNA used for microarrays, including both (_) reverse
transcriptase (_RT) and (_) oligo dT controls, resulted in
no detectable products for any of the 22 specimens and 14
gene products analysed, even after 40 cycles of
amplification. This observation supports the assumption
that the nucleic acids that we detected in our serum studies
are of RNA, not DNA, origin.
In conclusion, although the numbers of specimens
included in this pilot study were too limited to identify any
potentially useful biomarkers for breast cancer, this novel
study suggests that microarray technologies are suitable for
global analysis of extracellular nucleic acids, mRNA in
origin, present in human serum, as well as in tissue
specimens and creates optimism for advancing this
application to larger cohorts of patients.
Authors’Contributions
Lorraine O’Driscoll designed and co-ordinated the study, was involved in raising financial support for this research, was involved in RNA isolation and study by microarrays, performed the qRT-PCR analysis, was involved in data analysis and interpretation, and drafted the manuscript; EK participated in study design and RNA isolations, in preparation of specimens for microarray analysis and was involved in data analysis and interpretation; JPM was involved in the bioinformatics analysis; PD, HJ and PG were involved in analysing labeled specimens on microarrays chips; AH, BO’D and DO’G were involved in procuring clinical specimens for analysis and collating relevant anonymised clinical data; MC contributed to the planning of the study and to data analysis and interpretation, reviewed the manuscript and was involved in raising financial support for this research. All authors approved the final manuscript.
Acknowledgements
This work was supported by funding from Ireland’s Higher Educational Authority Programme for Research in Third Level Institutions (PRTLI) Cycle 3; Dublin City University’s Research Fellowship; with equipment support from Science Foundation Ireland.
References
1 Reddi KK and Holland JF: Elevated serum ribonuclease in patients with pancreatic cancer. Proc Natl Acad Sci USA73: 2308-2310, 1976.
2 Kopreski MS, Benko FA, Kwak LW and Gocke CD: Detection of tumor messenger RNA in the serum of patients with malignant melanoma. Clin Cancer Res5: 1961-1965, 1999. 3 Chen Xq, Bonnefoi H, Pelte M-F, Lyautey J, Lederrey C,
Movarekhi S, Schaeffer P, Mulcahy HE, Meyer P, Stroun M and Anker P: Telomerase RNA as a detection marker in the serum of breast cancer patients. Clin Cancer Res6: 3823-3826, 2000.
4 Rappl G, Hasselmann DO, Rössler M, Ugurel S, Tilgen W and Reinhold U: Detection of tumor-associated circulating mRNA in patients with disseminated malignant melanoma. Ann NY Acad Sci 945: 189-191, 2001.
5 Kopreski MS, Benko BA and Gocke CD: Circulating RNA as a tumour marker. Detection of 5T4 mRNA in breast and lung cancer patient serum, Ann N Y Acad Sci945: 172-178, 2001. 6 Fleischhacker M, Beinert T, Ermitsch M, Seferi D, Possinger
K, Engelmann C and Jandrig B:Detection of amplifiable messenger RNA in the serum of patients with lung cancer, Ann NY Acad Sci945: 179-188, 2001.
7 Gal S, Fidler C, Lo YMD, Chin K, Moore J, Harris LA and Wainscoat JS: Detection of mammaglobin mRNA in the plasma of breast cancer patients. Ann N Y Acad Sci945: 192-194, 2001. 8 Silva JM, Domínguez G, Silva J, Garcia JM, Sanchez A, Rodriguez O, Provencio M, España P and Bonilla F: Detection of epithelial messenger RNA in the plasma of breast cancer patients is associated with poor prognosis tumor characteristics. Clin Cancer Res7: 2821-2825, 2001.
9 Ng EKO, Tsui NBY, Lam NYL, Chiu RW, Yu SC, Wong SC, Lo ES, Rainer TH, Johnson PJ and Lo YM: Presence of filterable and nonfilterable mRNA in the plasma of cancer patients and healthy individuals. Clin Chem48: 1212-1217, 2002. 10 Sueoka E, Sueoka N, Iwanaga K, Sato A, Suga K, Hayashi S, Nagasawa K and Nakachi K: Detection of plasma hnRNP B1 mRNA, a new cancer biomarker, in lung cancer patients by quantitative real-time polymerase chain reaction. Lung Cancer 48: 77-83, 2005.
11 Leelawat K, Leelawat S, Ratanachu-Ek T, Trubwongchareon S, Wannaprasert J, Tripongkaruna S, Chantawibul S and Tepaksorn P: CirculatinghTERTmRNA as a tumor marker in cholangiocarcinoma patients. World J Gastroenterol12: 4195-4198, 2006.
12 Tong YK and Lo YM: Diagnostic developments involving cell-free (circulating) nucleic acids. Clin Chim Acta363: 187-196, 2006.
14 Li Y, Elashoff D, Oh M, Sinha U, St John MA, Zhou X, Abemayor E and Wong DT: Serum circulating human mRNA profiling and its utility for oral cancer detection. J. Clin Oncol 24: 1754-1760, 2006.
15 O’Driscoll L, Kenny E, Perez de Villarreal M and Clynes M: Detection of specific mRNAs in culture medium conditioned by human tumour cells: potential for new class of cancer biomarkers in serum. Cancer Genomics & Proteomics2: 43-52, 2005.
16 O’Driscoll L, Linehan R, Kennedy SM, Cronin D, Purcell R, Glynn S, McDermott EW, Hill ADK, O’Higgins N, Parkinson M and Clynes M: Lack of prognostic significance ofsurvivin, survivin-deltaEx3, survivin-2B, galectin-3, bag-1, bax-alphaand mrp-1mRNAs in breast cancer. Cancer Lett201: 225-236, 2003. 17 h t t p : / / w w w. a f f y m e t r i x .c o m / s u p p o r t / d o wn l o a d s / m a nu a l s /
expression_s2_manual.pdf
18 h t t p : / / w w w . a f f y m e t r i x . c o m / s u p p o r t / t e c h n i c a l / t e c h n o t e s / blood2_technote.pdf
19 Li C and Wong WH: Model-based analysis of oligonucleotide arrays: Expression index computation and outlier detection. Proc Natl Acad Sci USA 98: 31-36, 2001.
20 Livak KJ and Schmittgen TD: Analysis of relative gene expression data using real-time quantitative PCR and the 2(-Delta 2(-Delta C(T)). Methods25: 402-408, 2001.
21 Affymetrix Inc. “Genechip® Expression Analysis Data Analysis Fundamentals”, 2006: http://www.affymetrix.com/support/ downloads/manuals/data_analysis_fundamentals_manual.pdf 22 Wilson CL, Pepper SD, Hey Y and Miller C: Amplification
protocols introduce systematic but reproducible errors into gene expression studies. Biotechniques36: 498-506, 2004.
23 El-Hefnawy T, Raja S, Kelly L, Bigbee WL, Kirkwood JM, Luketich JD and Godfrey TE: Characterization of amplifiable, circulating RNA in plasma and its potential as a tool for cancer diagnostics. Clin Chem50: 564-573, 2004.
24 O’Driscoll L: Extracellular nucleic acids and their potential as diagnostic, prognostic and predictive biomarkers. Anticancer Res27: 1257-1266, 2007.
25 Li Y, Zhou X, St John MA and Wong DT: RNA profiling of cell-free saliva using microarray technology. J Dent Res83: 199-203, 2004.
26 Li Y, St John MA, Zhou X, Kim Y, Sinha U, Jordan RC, Eisele D, Abemayor E, Elashoff D, Park NH and Wong DT: Salivary transcriptome diagnostics for oral cancer detection. Clin Cancer Res10: 8442-8450, 2004.
27 Wong BC, Chiu RW, Tsui NB, Chan KC, Chan LW, Lau TK, Leung TN and Lo YM: Circulating placental RNA in maternal plasma is associated with a preponderance of 5’ mRNA fragments: implications for noninvasive prenatal diagnosis and monitoring. Clin Chem51: 1786-1795, 2005.
28 Kumar SV, Hurteau GJ and Spivack SD: Validity of messenger RNA expression analyses of human saliva. Clin Cancer Res12: 5033-5039, 2006.
29 Wong DT: Salivary transcriptome. Clin Cancer Res13: 1350-1351, 2007.