warwick.ac.uk/lib-publications
A Thesis Submitted for the Degree of PhD at the University of Warwick
Permanent WRAP URL:
http://wrap.warwick.ac.uk/78793
Copyright and reuse:
This thesis is made available online and is protected by original copyright. Please scroll down to view the document itself.
Please refer to the repository record for this item for information to help you to cite it. Our policy information is available from the repository home page.
A Systems Biology Analysis of
Feedback Control in Pheromone
Signalling of Fission Yeast
by
Manuel Alejandro Esparza Franco
A thesis submitted in partial fulfilment
of the requirements for the degree of
Doctor of Philosophy in Systems Biology
Systems Biology Doctoral Training Centre
I, Manuel Alejandro Esparza Franco, declare that this thesis titled, ‘A Systems
Biology Analysis of Feedback Control in Pheromone Signalling of Fission Yeast’
and the work presented in it are my own. I confirm that:
This work was done wholly or mainly while in candidature for a research
degree at this University.
Where any part of this thesis has previously been submitted for a degree or
any other qualification at this University or any other institution, this has
been clearly stated.
Where I have consulted the published work of others, this is always clearly
attributed.
Where I have quoted from the work of others, the source is always given.
With the exception of such quotations, this thesis is entirely my own work.
Where the thesis is based on work done by myself jointly with others, I have
made clear exactly what was done by others and what I have contributed
myself.
The following article was published as a result of the work contained in this
the-sis: Croft W, Hill C, McCann E, Bond M, Esparza-Franco MA, Bennet J, Rand
D, Davey J and Ladds G. (2013). A physiologically required G protein-coupled
receptor (GPCR)-Regulator of G protein signalling (RGS) interaction that
com-partmentalizes RGS activity. J. Biol. Chem., 288(38): 27327–27342.
Signed:
Date:
Cell signalling comprises the systems used by cells to detect changes in their
envi-ronment and to transduce the information into appropriate adjustments enforced
by regulatory proteins. Due to its central role in all life processes, the study of
cell signalling is a major focus of current biomedical research. The fission yeast
Schizosaccharomyces pombe (S. pombe) is a single-celled organism used as a model to simplify the study of eukaryotic cell signalling, as it shares many features of
interest with human cells. In this thesis a systems biology approach was used to
in-vestigate the roles of feedback regulation to control the dynamics of pheromone
sig-nalling inS. pombe. To this end, a quantitative dynamical model was built describ-ing the pheromone-induced activation of the master transcription factor Ste11, as
well as the coupled positive and negative feedback loops that arise from Ste11
activity. To constrain the model, a collection of data sets were generated by
per-forming absolute quantification measurements of pheromone-dependent changes
in the concentration of the model species. Structural identifiability analyses were
used to select the measured species, while confidence intervals of the estimated
parameters were determined through profile likelihood estimation. Analysis of the
resulting model revealed a role for the pheromone signalling feedback loops to aid
in the discrimination of different pheromone input doses. Through their combined
action, feedback control defines the concentration and time thresholds in Ste11
I am deeply grateful and indebted to my supervisors Graham Ladds and Michael
Chappell for their endless patience and support. I would like to acknowledge their
invaluable contributions to this work.
I would like to thank all the people in the Ladds and Chappell groups that have
helped me over the years.
To my wife, family, and friends.
Declaration of Authorship i
Abstract ii
Acknowledgements iii
List of Figures viii
List of Tables xii
Abbreviations xiii
1 Introduction 1
1.1 Cell signalling . . . 1
1.1.1 Gene regulatory networks . . . 2
1.2 Models of eukaryote cell signalling . . . 2
1.3 Mating inS. pombe . . . 3
1.3.1 Nutrient-sensing . . . 5
1.3.2 cAMP pathway . . . 5
1.3.3 TORC1 pathway . . . 7
1.3.4 Stress-responsive MAPK pathway . . . 7
1.3.5 Protein stability . . . 9
1.3.6 Cell cycle control . . . 9
1.3.7 Subcellular localization . . . 10
1.3.8 Pheromone response MAPK pathway . . . 10
1.3.9 Translational control . . . 12
1.4 Systems biology and the modelling loop . . . 13
1.4.1 Model and parameter identifiability . . . 14
1.5 Project aims . . . 15
2 Materials and methods 17 2.1 Experimental methods . . . 17
2.1.1 Bacterial transformation . . . 17
2.1.2 Small scale isolation of plasmid DNA . . . 17
2.1.3 Amplification of DNA sequences by polymerase chain reac-tion (PCR) . . . 18
2.1.4 Site-directed mutagenesis . . . 18
2.1.5 Gibson assembly . . . 19
2.1.6 DNA sequencing . . . 20
2.1.7 RNA extraction from S.pombe . . . 20
2.1.8 cDNA synthesis . . . 21
2.1.9 Real-time quantitative PCR (qPCR) . . . 21
2.1.10 Droplet digital PCR (ddPCR) . . . 22
2.1.11 Concentrating protein samples . . . 22
2.1.12 anti-GFP Enzyme-linked immunosorbent assay (ELISA) . . 23
2.1.13 Yeast strains . . . 23
2.1.14 Yeast growth conditions . . . 23
2.1.15 Yeast transformation . . . 24
2.1.16 Cell counting and cell volume measurement . . . 24
2.1.17 β-galactosidase assay . . . 25
2.1.18 Confocal fluorescence microscopy . . . 25
2.2 Computational methods . . . 26
3 Model derivation 28 3.1 Existing models of pheromone signalling . . . 28
3.1.1 Reformulating the inert Gα·GTP hypothesis . . . 31
3.2 A minimal model of feedback control for pheromone signalling . . . 35
3.2.1 Identifying areas of uncertainty in the model assumptions . . . 38
3.2.2 Model granularity . . . 40
3.2.3 Appropriateness of reaction kinetics . . . 41
3.2.4 Importance of positive feedback . . . 43
3.3 Initial model assessment . . . 44
3.4 Parameter determinability . . . 54
3.4.1 Confidence intervals . . . 59
3.4.2 Profile likelihood estimation . . . 60
3.5 Structural identifiability analysis . . . 65
3.5.1 Similarity transformation approach for uncontrolled systems (STAUS) . . . 66
3.5.2 The Observability Rank Condition (ORC) . . . 67
4 Generating data sets for parameter estimation 71 4.1 Development of an assay to track pheromone depletion . . . 71
4.1.1 Minimising pheromone loss due to adsorption . . . 74
4.1.3 Time course quantification of P-factor depletion by Sxa2 . . 78
4.2 Generating absolute quantification measurements of Sxa2 . . . 79
4.2.1 Creating a sxa2-GFP yeast strain . . . 81
4.2.2 Time course quantification of Sxa2-GFP production in re-sponse to pheromone . . . 85
4.3 Quantitative gene expression analysis ofsxa2 and ste11 . . . 88
4.3.1 Reference gene selection . . . 89
4.3.2 Primer design . . . 90
4.3.3 Reference gene stability validation . . . 92
4.3.4 Time course quantification of sxa2 and ste11 expression in response to pheromone . . . 94
4.3.5 Absolute quantification of sxa2 and ste11 expression in re-sponse to pheromone . . . 98
5 Model fitting and analysis 104 5.1 Fitting models to experimental data . . . 104
5.1.1 Indistinguishability analysis . . . 108
5.2 Experimental design to resolve parameter non-identifiabilities . . . 118
5.3 Model analysis . . . 129
5.3.1 Sensitivity analysis . . . 139
6 Discussion and conclusions 146 6.1 The need for a new model of pheromone signalling . . . 147
6.2 Deriving a model of feedback control in pheromone signalling . . . 149
6.2.1 Gaps in knowledge give rise to a family of model variants . . 150
6.2.2 Preliminary assessment of the new model . . . 150
6.2.3 Unidentifiable parameters and the possibility of a fully iden-tifiable model . . . 152
6.3 Generating necessary data sets to constrain the model . . . 153
6.3.1 Tracking pheromone inactivation by Sxa2 . . . 153
6.3.2 Fixing the scale of Sxa2 concentration . . . 155
6.3.3 Transcriptional dynamics of sxa2 and ste11 . . . 156
6.4 Using the model to increase knowledge and understanding . . . 158
6.4.1 Model fitting and discarding model variants . . . 158
6.4.2 Final model iteration and the measurements required for full identifiability . . . 159
6.4.3 Discovering roles for feedback control inS. pombe pheromone signalling . . . 160
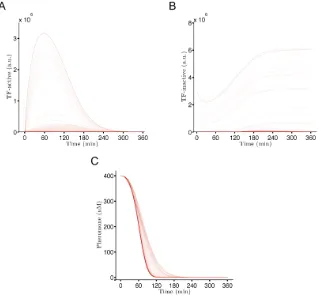
A Uncertainty in trajectories of model A2B1C1D1E1 164
B Uncertainty in trajectories of TF total 175
C PLE of model A2B1C1D1E1 fitted to synthetic data of
TF total 177
D Fitting the reduced model A2 to experimental data 179
E Image analysis of single cell transcriptional response
to pheromone 181
1.1 Life cycle of S. pombe . . . 4
1.2 Nutritional regulation of ste11 transcription . . . 6
1.3 Pheromone response pathway of S. pombe . . . 11
3.1 Inert Gα·GTP hypothesis . . . 29
3.2 Dependence of pheromone signalling on RGS concentration . . . 30
3.3 New G protein cycle proposed forS. pombe pheromone signalling . 33 3.4 Equivalence between rate-limiting dissociation and inert Gα·GTP state . . . 34
3.5 Model diagram . . . 36
3.6 Sxa2 production in response to P-factor stimulation . . . 45
3.7 Performance of multi-start parameter estimation . . . 46
3.8 Comparison of fits between models of class A1 and A2 . . . 50
3.9 Comparison of fits between models of class E1 and E2 . . . 52
3.10 Identification of Hill coefficients for gene expression terms . . . 53
3.11 Simulation of the base model fitted to Ladds et al. (1996) Sxa2 data 56 3.12 Correlation between estimated parameters . . . 57
3.13 Monte Carlo analysis of correlated parameters . . . 58
3.14 Profile likelihood estimation for model parameters . . . 62
3.15 Consequences of non-identifiability . . . 64
4.1 Experimental design to track P-factor pheromone depletion by Sxa2 73 4.2 Pre-coating tubes with BSA minimises pheromone loss due to ad-sorption . . . 75
4.3 Methanol affects the ability of cells to respond to pheromone . . . . 77
4.4 Most of the pheromone dose inactivation occurs between 1 and 2 hours after stimulation . . . 79
4.5 Absolute quantification time course of P-factor inactivation by Sxa2 80 4.6 Creating a sxa2-GFP yeast strain . . . 82
4.7 A 200X concentration factor is necessary to reliably quantify Sxa2-GFP . . . 86
4.8 Protein loss due to ultrafiltration is negligible . . . 87
4.9 Absolute quantification time course of pheromone induced Sxa2-GFP 88 4.10 Post-amplification melting curve analysis . . . 91
4.11 Validating reference gene stability under pheromone stimulation . . 93
4.12 Standard curves for relative quantification by qPCR . . . 95
4.13 Relative quantification of gene expression in wild type cells
respond-ing to pheromone . . . 96
4.14 Relative quantification of gene expression insxa2S200A cells respond-ing to pheromone . . . 97
4.15 ddPCR provides absolute quantification without the need of a stan-dard curve . . . 99
4.16 Establishing correct sample dilutions for ddPCR . . . 101
4.17 Absolute quantification of gene expression in wild type cells re-sponding to pheromone . . . 102
4.18 Absolute quantification of gene expression in sxa2S200A cells re-sponding to pheromone . . . 103
5.1 Fitting model A1B1C1D1E1 to experimental data . . . 106
5.2 Fitting model A1B1C1D1E2 to experimental data . . . 110
5.3 Fitting model A2B1C1D1E1 to experimental data . . . 115
5.4 Fitting model A2B1C1D1E2 to experimental data . . . 118
5.5 Parameter profile likelihoods for model A2B1C1D1E1 fitted to ex-perimental data . . . 119
5.6 Non-identifiability of parameter v1 in model A2B1C1D1E1 . . . 121
5.7 Uncertainty in model trajectories caused by non-identifiability ofv1 and km1 . . . 122
5.8 Effects of increased sampling from existing observables on parame-ter identifiability . . . 123
5.9 Parameter profile likelihoods for model A2B1C1D1E1 fitted to data of all state variables . . . 125
5.10 Non-identifiabilities of parameters in model A2B1C1D1E1 fitted to data of all state variables . . . 126
5.11 Parameter profile likelihoods for the reduced A2 model fitted to existing experimental data . . . 127
5.12 Parameter profile likelihoods for the reduced A2 model fitted to experimental data including total TF . . . 129
5.13 Simulation of model A2R with multiple doses of pheromone input . 131 5.14 Simulation of model A2R without negative feedback . . . 132
5.15 Qualitative agreement between fluorescent reporter time courses and model simulation . . . 134
5.16 Simulation of model A2R without positive feedback . . . 135
5.17 Lack of positive feedback dampens the expression of TF-regulated genes . . . 136
5.18 Dose and duration thresholds for commitment to mating . . . 137
5.19 Time-varying sensitivities of model A2R . . . 141
5.20 Sensitivity time integral . . . 143
5.21 Importance of positive feedback in the absence of high basal TF mRNA production . . . 145
A.2 Uncertainty in wild type model trajectories propagated from uncer-tainty inkdm1 . . . 165 A.3 Uncertainty in wild type model trajectories propagated from
uncer-tainty inkt1 . . . 165 A.4 Uncertainty in wild type model trajectories propagated from
uncer-tainty inka . . . 166
A.5 Uncertainty in wild type model trajectories propagated from uncer-tainty inv2 . . . 166 A.6 Uncertainty in wild type model trajectories propagated from
uncer-tainty inkm2 . . . 167 A.7 Uncertainty in wild type model trajectories propagated from
uncer-tainty inkdm2 . . . 167 A.8 Uncertainty in wild type model trajectories propagated from
uncer-tainty inkt2 . . . 168 A.9 Uncertainty in wild type model trajectories propagated from
uncer-tainty inkc . . . 168
A.10 Uncertainty in wild type model trajectories propagated from uncer-tainty inkm3 . . . 169 A.11 Uncertainty in inactive peptidase model trajectories propagated
from uncertainty in kb . . . 169
A.12 Uncertainty in inactive peptidase model trajectories propagated from uncertainty in kdm1 . . . 170 A.13 Uncertainty in inactive peptidase model trajectories propagated
from uncertainty in kt1 . . . 170 A.14 Uncertainty in inactive peptidase model trajectories propagated
from uncertainty in ka . . . 171
A.15 Uncertainty in inactive peptidase model trajectories propagated from uncertainty in v2 . . . 171 A.16 Uncertainty in inactive peptidase model trajectories propagated
from uncertainty in km2 . . . 172 A.17 Uncertainty in inactive peptidase model trajectories propagated
from uncertainty in kdm2 . . . 172 A.18 Uncertainty in inactive peptidase model trajectories propagated
from uncertainty in kt2 . . . 173 A.19 Uncertainty in inactive peptidase model trajectories propagated
from uncertainty in kc . . . 173
A.20 Uncertainty in inactive peptidase model trajectories propagated from uncertainty in km3 . . . 174
B.1 Uncertainty in trajectories of TF total in a wild type simulation . . 175 B.2 Uncertainty in trajectories of TF total in an inactive peptidase
sim-ulation . . . 176
C.1 Model A2B1C1D1E1 fit to TF total synthetic data . . . 177 C.2 Parameter profile likelihoods for model A2B1C1D1E1 fitted to
D.1 Fitting the reduced model A2 to experimental data . . . 180
2.1 PCR reaction setup . . . 18
2.2 Thermal cycling conditions for PCR . . . 19
2.3 S. pombe strains . . . 24
2.4 Composition of DMM growth medium . . . 25
2.5 Stock solutions for DMM media . . . 26
2.6 Composition of Z-buffer . . . 27
3.1 Definitions of model A1B1C1D1E1 . . . 39
3.2 Model variants . . . 40
3.3 Initial estimates and confidence intervals for model A1B1C1D1E1 . 63 3.4 Summary of STAUS identifiability analysis for model A1B1C1D1E1 70 4.1 Oligonucleotides for creating a sxa2-GFP allele . . . 84
4.2 Oligonucleotides for creating the S200A mutation in sxa2 . . . 85
4.3 Oligonucleotide primers for RT-qPCR . . . 92
5.1 Parameter estimates and confidence intervals for model A1B1C1D1E1108 5.2 Definitions of model A2B1C1D1E1 . . . 113
5.3 Parameter estimates and confidence intervals for model A2B1C1D1E1116 5.4 Parameter estimates and confidence intervals for model A2B1C1D1E1 after fixingkdp . . . 117
5.5 Parameter estimates and confidence intervals for model A2R . . . . 128
AIC AkaikeInformation Criterion
BSA Bovine Serum Albumin
cAMP cyclicAdenosine MonoPhosphate
DMM Defined Minimal Media
DNA DeoxyriboNucleic Acid
dsDNA double-strandedDNA
ddPCR digital droplet PCR
ELISA Enzyme-Linked ImmunoSorbent Assay
FOA 5-FluoroOrotic Acid
GAP GTPaseAccelerating Protein
GDP Guanosine DiPhosphate
GEF Guanosine nucleotideExchange Factor
GFP Green Fluorescent Protein
GPCR G Protein-CoupledReceptor
GTP Guanosine TriPhosphate
HPLC High Performance LiquidChromatography
LHS Latin HypercubeSampling
MAPK Mitogen Activated Protein Kinase
MAP2K MAPK Kinase
MAP3K MAP2K Kinase
mRNA messengerRNA
NMWL NominalMolecular WeightLimit
OD Optical Density
ODE Ordinary Differential Equation
ONPG O-NitroPhenyl-D-Galactoside
ORF Open Reading Frame
PCR PolymeraseChain Reaction
PL Profile Likelihood
PLE Profile Likelihood Estimation
qPCR Real-time quantitative PCR
RGS Regulator of G Protein Signalling
RNA RiboNucleicAcid
RT-ddPCR Reverse TranscriptionddPCR
RT-qPCR Reverse TranscriptionqPCR
SD Standard Deviation
STAUS Similarity TransformationApproach forUncontrolled Systems
S. pombe Schizosaccharomyces pombe
UTR UnTranslated Region
Introduction
1.1
Cell signalling
To remain adapted in a dynamic environment, cells must be able to perceive,
interpret, and respond to external cues in a precise and timely manner.
Extracel-lular signals trigger responses necessary for almost all celExtracel-lular processes, including
homeostasis, proliferation, differentiation, motility, and multicellular coordination
(Gurdon et al., 1993; Gilman, 1987; Falkeet al., 1997; Cargnello and Roux, 2011).
Signals are detected by receptor proteins, which become activated upon binding of
the signal molecules. This in turn activates one or more signalling pathways, which
transduce the signals inside the receiving cell and distribute them to appropriate
intracellular targets (Alberts et al., 2008).
Errors in signalling have been linked to many complex and prevalent human
dis-eases, such as cancer, diabetes, and autoimmunity (Bazigou and Rallis, 2007;
Ahr´en, 2009), thus, understanding cell signalling is a major focus of current
biomedical and pharmacological research (Lin and Liu, 2008).
1.1.1
Gene regulatory networks
Cell signalling systems convert variations in extracellular conditions into
intra-cellular information that modifies the activity of key protein regulators. These
regulators typically receive multiple and disparate inputs, and will exhibit very
specific levels of activity based on the particular combination of inputs they
re-ceive, thus, essentially acting as logic processing systems.
However, higher level cellular decisions that result in qualitatively distinct
be-haviours, such as cell differentiation and commitment to a particular cell fate,
require the coordinated action of multiple genes, functionally interconnected and
capable of executing a specific cellular programme. These genetic circuits are
known as gene regulatory networks (Davidson and Levine, 2005).
The specific arrangement in which genes are causally linked in a regulatory network
defines its architecture, from which emergent properties arise, such as positive and
negative feedback loops, that can only be completely understood at the system
level (Karlebach and Shamir, 2008).
1.2
Models of eukaryote cell signalling
The study of cellular decisions directly in human or mammalian cells can become
intractable because of the complexity caused by extensive feedback, crosstalk, and
sheer size of the networks. Bacterial cells on the other hand bear little
resem-blance to eukaryote biochemistry. Thus, it is necessary that a model to study
eukaryote cell signalling and gene regulatory networks be simple enough to allow
studying properties of an individual pathway, with minimal interference from
ex-ternal signals, but remains relevant to a wide variety of organisms and signalling
Yeast are unicellular fungi that have been established as models of eukaryote cell
biology due to their ease of culturing and genetic manipulation. In particular,
the mating response pathway of the fission yeast Schizosaccharomyces pombe (S.
pombe), provides an excellent opportunity to study regulatory mechanisms
gov-erning cell differentiation in relative isolation, thanks to the availability of mutant
strains that can abolish many external influences, while combining several features
that are of commercial, medical, and evolutionary interest (Davey, 1998).
1.3
Mating in
S. pombe
S. pombecells usually exist as haploids of either P (h+) or M (h–) mating types that
proliferate through mitosis (Figure 1.1). However, upon nutritional depletion, cells
of opposite mating types will fuse pairwise (conjugation), including fusion of the
two nuclei (karyogamy), to produce diploid cells. The zygote undergoes meiosis
and develops into an ascus containing four haploid ascospores. Spores are kept in
a dormant state capable of tolerating severe environmental stresses, thus, sexual
differentiation in yeast has evolved into a strategy to survive drastic environmental
changes and hazardous stimuli. When suitable growth conditions are restored, the
spores germinate to complete the life cycle (Leupold, 1950; Egel, 1971).
Sexual differentiation is energetically costly, and exiting the fast dividing haploid
state when it is not absolutely necessary would be a great evolutionary
disad-vantage, therefore, the mating response genetic programme must be under tight
control, to ensure it is only activated under appropriate situations. Many layers of
regulation exist to control the commitment to sexual differentiation, all of which
converge on the Ste11 transcription factor (Otsubo and Yamamoto, 2012).
Ste11 is a member of the high mobility group (HMG) transcription factor
Figure 1.1: Life cycle ofS. pombe.
Cells lacking the ste11 gene are completely sterile, while overexpression of ste11
induces sexual differentiation regardless of environmental conditions (Sugimoto
et al., 1991). Ste11 controls the expression of at least 78 genes that are required to
produce the physiological and morphological changes necessary to mate (Mata and
B¨ahler, 2006; Xue-Franz´en et al., 2006). The regulation of Ste11 expression and
activity is complex, including suppression during mitotic growth by nutrient-rich
inhibition of itself and its targets, as well as activation by stress and pheromone
communication (Anandhakumar et al., 2013).
1.3.1
Nutrient-sensing
Sexual development in fission yeast culminates in the formation of dormant
as-cospores which can survive through adverse conditions. Thus it makes sense for
nutrient-sensing mechanisms to have a direct input into the control of Ste11, to
en-sure that mitotic growth is maintained when sufficient nutrients are available, and
that mating and sporulation occurs only when resources become limiting. Two
distinct nutrient-sensing pathways are known to regulate ste11 expression, the
cyclic adenosine monophosphate (cAMP) pathway, and the target of rapamycin
(TOR) complex 1 (TORC1) pathway.
1.3.2
cAMP pathway
S. pombe cells monitor the availability of extracellular carbon through the putative
glucose receptor Git3 (Hoffman, 2005). In the presence of sufficient nutrients, the
Git3 GPCR will activate its cognate heterotrimeric G protein, allowing the α
-subunit Gpa2 to directly activate adenylate cyclase Cyr1 (Ivey and Hoffman, 2005),
which catalyses the production of cAMP from ATP (Figure 1.2) (Kawamukai
et al., 1991). Analysis of cAMP-related mutants has revealed that cells with high
amounts of intracellular cAMP are deficient for mating and sporulation (DeVoti
et al., 1991; Mochizuki and Yamamoto, 1992), whereas cells defective in cAMP
production will initiate sexual development even under nutrient-rich conditions
(Maeda et al., 1990; Kawamukai et al., 1991).
cAMP controls mating initiation by modulating the activity of the cAMP-dependent
et al., 1991; Maedaet al., 1994). In turn, PKA negatively regulates the
transcrip-tion factor Rst2 by phosphorylatranscrip-tion and nuclear exclusion (Kunitomo et al., 2000;
Higuchi et al., 2002). Rst2 is a zinc-finger protein that induces the expression
of ste11 by binding to a STREP motif in the ste11 promoter (Kunitomo et al.,
2000). Cells lacking rst2 can grow mitotically but are sterile; this deficiency can
be rescued by artificial expression of ste11 (Kunitomo et al., 2000).
Thus, exhaustion of carbon sources leads to the inactivation of Cyr1 and a
subse-quent depletion of intracellular cAMP, which liberates Rst2 from PKA regulation
[image:22.596.201.439.318.651.2]and promotes the transcription of ste11 (Figure 1.2).
Figure 1.2: Nutritional regulation ofste11 transcription. Rst2-mediated tran-scription of ste11 is coupled to the availability of carbon through the cAMP pathway. cAMP production depends on the activation of adenylate cyclase (Cyr1) by the carbon sensor Git3-Gpa2. Intracellular levels of cAMP then modulate the activity of Pka1 (via Cgs1) to prevent ste11 transcription when
1.3.3
TORC1 pathway
TORC1 is a multisubunit complex that contains the Tor2 kinase, a homologue of
mammalian TOR (Weisman and Choder, 2001). The TORC1 pathway cooperates
with PKA to repress Ste11 expression and activity; while the cAMP pathway
surveys the availability of carbon sources, the TORC1 pathway is regulated by
nitrogen sources (Uritani et al., 2006).
Although the molecular details of how this pathway is activated, and how it
reg-ulates Ste11 activity have not been completely elucidated, overexpression of tor2
will abolish the induction ofste11 mRNA in response to starvation rendering cells
sterile; whereas loss oftor2, or inactivation of Tor2 temperature-sensitive mutants
will mimic nitrogen starvation, and will upregulate the expression ofste11 and its
downstream targets, causing the entry of cells into mating behaviour and meiosis
even if grown in rich medium (Alvarez and Moreno, 2006; Uritani et al., 2006;
Weisman et al., 2007; Matsuo et al., 2007; Valbuena and Moreno, 2010).
These results suggest that Tor2 and PKA kinases play overlapping roles to repress
Ste11 activity and sexual development. However, even Tor2 overexpression is not
able to prevent ste11 transcription if PKA becomes inactive, nor can it prevent
nuclear accumulation of Ste11 in this situation (Valbuena and Moreno, 2010),
showing that the cAMP pathway plays a more dominant role in regulating Ste11
activity.
1.3.4
Stress-responsive MAPK pathway
As mentioned above, ascospores are highly resistant to a variety of adverse
con-ditions in addition to starvation. Therefore, other kinds of stresses are also able
to promote entry into meiosis through regulation of Ste11. Fission yeast possess a
kind of externally induced stress (Chen et al., 2003), including heat, osmolarity,
nutritional, and oxidative stress (Millar et al., 1995; Shiozaki and Russell, 1995;
Degolset al., 1996; Shiozaki and Russell, 1996).
Detection of stress cues will converge in the response regulator Mcs4, making it
bind to the Wis4 and Win1 MAP3Ks (Shiozaki et al., 1997; Shieh et al., 1997;
Morigasaki et al., 2013), creating a signalling scaffold that phosphorylates the
MAP2K Wis1, which in turn phosphorylates the MAPK Sty1, a homologue of
mammalian MAPK p38 (Millaret al., 1995; Shiozaki and Russell, 1995; Samejima
et al., 1997; Shiehet al., 1998; Samejimaet al., 1998). Activated Sty1 accumulates
in the nucleus and phosphorylates several targets, including the bZIP transcription
factor Atf1 (Shiozaki and Russell, 1996; Wilkinsonet al., 1996; Gaits et al., 1998),
this phosphorylation allows Atf1 to create a heterodimer with another bZIP
pro-tein, Pcr1 (Watanabe and Yamamoto, 1996; Kanoh et al., 1996). The Atf1-Pcr1
dimer binds to the promoters of stress-response genes and also recruits Sty1 to
those sites (Reiter et al., 2008; Sans´o et al., 2011). This recruitment is key for
the regulation of ste11 expression by the stress-responsive pathway as explained
below.
The activity of RNA polymerase II (PolII) can be controlled through the
phospho-rylation pattern of its C-terminal domain (CTD) (Phatnani and Greenleaf, 2006),
and more specifically, it has been shown that phosphorylation of Ser-2 of PolII
CTD is necessary for a robust induction of ste11 expression (Coudreuse et al.,
2010; Sukegawa et al., 2011). This phosphorylation is controlled by the CTDK-I
kinase Lsk1, which is itself a target of Sty1. Thus, it is thought that when Sty1 is
recruited to the ste11 promoter via Atf1-Pcr1, it is able from this position to
re-cruit and activate Lsk1 to promote phosphorylation of Ser-2 of PolII CTD during
transcription initiation, which enhances the occupancy of PolII at theste11 locus
1.3.5
Protein stability
Molecules with key regulatory roles typically have a high turnover rate, to allow
a rapid control over their concentration (Alberts et al., 2008). Ste11 is an
un-stable protein with a half-life of less than 20 min (Kjærulff et al., 2007). Ste11
degradation is mediated by polyubiquitination and subsequent 26S proteasome
destruction (Kitamuraet al., 2001; Kjærulffet al., 2007). Importantly, this
mech-anism operates independently of phosphorylation status of Ste11 (Kjærulff et al.,
2007).
1.3.6
Cell cycle control
Sexual differentiation in yeast, and eukaryote cell differentiation in general, occurs
only during the G1 phase of the cell cycle, before the cell has committed itself to
another round of division. Accordingly, transcription of Ste11 targets has been
shown to be confined to G1 (Stern and Nurse, 1998). This cell cycle constraint is
enforced by the cyclin dependent kinase Cdc2, a homologue of mammalian Cdk1
(Lee and Nurse, 1987).
Cdc2 phosphorylates Ste11 at Thr82, which is located within the HMG-box
DNA-binding motif of Ste11 (Sugimoto et al., 1991; Kjærulff et al., 2007). This
phos-phorylation impairs the ability of Ste11 to bind DNA by lowering its affinity to
its target sequence by two to three fold (Kjærulff et al., 2007), thus reducing its
effectiveness to act as a transcription factor.
Since Cdc2 is cell-cycle regulated, having a minimum of activity during early
G1 (Stern and Nurse, 1996), this mechanism helps to constrain Ste11-dependent
transactivation to the G1 phase, where newly synthesized Ste11 can escape Cdc2
downregulation. However, this mechanism cannot fully prevent Ste11 activity, as
(Ste11T82D) are only semi-sterile, and Ste11T82D is still able to weakly induce the
expression of target genes (Kjærulff et al., 2007).
1.3.7
Subcellular localization
Ste11 contains a basic cluster nuclear localization signal (NLS) in the HMG-box
domain (Qin et al., 2003), and so newly synthesized Ste11 will be shuttled into
the nucleus. However, in growing cells, where Ste11 is produced at very low levels,
its localization appears to be pancellular, and is not confined to the nucleus (Qin
et al., 2003). Treatment with leptomycin B, an exportin inhibitor, will cause
nuclear accumulation of Ste11 in these cells (Qin et al., 2003), indicating that
Ste11 is also subject to active export from the nucleus.
Nuclear accumulation of Ste11 is required to trigger the sexual developmental
switch, but this requires both starvation and pheromone stimulation (Qin et al.,
2003). In order to prevent nuclear accumulation of Ste11 in the absence of
appro-priate signals, the Pat1 kinase, which resides in the nucleus (McLeod et al., 2000;
Matsuyama et al., 2006), phosphorylates Ste11 at positions Thr173 and Ser218
(Li and McLeod, 1996). This phosphorylation pattern allows Rad24, a 14-3-3
homologue (Ford et al., 1994), to bind Ste11 and restrict its localization to the
cytoplasm for the remainder of its lifetime (Kitamura et al., 2001).
1.3.8
Pheromone response MAPK pathway
Upon early starvation, especially of nitrogen, Ste11 directs the transcription of
mating-type-specific genes, including mating pheromones and pheromone
recep-tors (Davey, 1998). Cells of mating type P produce P-factor pheromone, an
unmodified 23 amino acid peptide, while mating type M cells produce M-factor
the C-terminus (Imai and Yamamoto, 1994; Davey, 1992). Mating pheromones are
secreted into the extracellular space and will only bind to specific receptors present
in cells of opposite mating type. Yeast cells are not motile, so they reach
mat-ing partners by growmat-ing elongated conjugation tubes (shmoo) towards the nearest
source of appropriate pheromone (Fukuiet al., 1986; Davey, 1991).
M-cells detect P-factor through the Mam2 receptor, and P-cells detect M-factor
through the Map3 receptor, both of which are G protein-coupled receptors (GPCRs)
that dock to the same Gα protein Gpa1 (Figure 1.3) (Kitamura and Shimoda,
[image:27.596.127.503.308.686.2]1991; Tanaka et al., 1993; Obara et al., 1991).
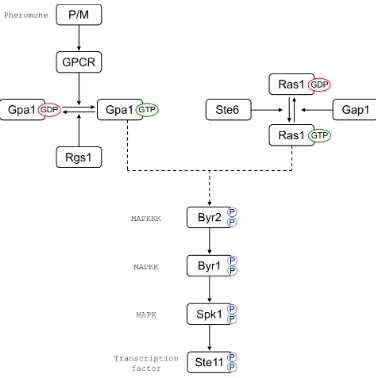
Figure 1.3: Pheromone response pathway of S. pombe. Mating-type specific receptors detect nearby compatible partners by pheromone concentration gra-dients. Receptors couple pheromone binding to G protein activation leading to the activation of a MAP kinase cascade, which begins the transcriptional
Pheromone binding to the receptor leads to the activation of the Gα, Gpa1 (Obara
et al., 1991), then, with the help of Ras1 (Xu et al., 1994), activated Gpa1 will
direct the activation of a transcriptional response, and a morphological response
(Papadakiet al., 2002). Signalling to initiate the transcriptional response is
trans-duced through a MAP kinase cascade comprising the sequential phosphorylation of
Byr2 (MAP3K), Byr1 (MAP2K), and Spk1 (MAPK) (Neiman et al., 1993). Spk1
is then able to phosphorylate Ste11 at positions Thr305 and Thr317 (Kjærulff
et al., 2005). Although the precise consequence of these phosphorylations has not
yet been determined, phosphomimetic mutations at these residues produce a
hy-peractive Ste11 allele that accelerates the speed of the mating response (Kjærulff
et al., 2005), presumably by bypassing its cell cycle or subcellular localization
control.
1.3.9
Translational control
A final layer of regulation is thought to control Ste11 activity at the translational
level. Nrd1 is an RNA-binding protein that contains 4 highly conserved RNA
recognition motifs (RRMs) and has a preferential binding affinity for poly(U)
tracts (Tsukahara et al., 1998). Nrd1 represses the translation of Ste11-regulated
genes until starvation has occurred, but it is unclear how specificity is achieved
or how the actual mechanism of repression works. Genetic analyses of mutants to
assess epistatic relationships have shown that Nrd1 acts independently of nutrient
sensing and stress responsive pathways, however, activated Spk1 phosphorylates
Nrd1 to repress its function (Tsukahara et al., 1998; Oowatari et al., 2011), thus
1.4
Systems biology and the modelling loop
Systems biology is an approach to biological research that focuses on the
integra-tion of knowledge and data into mathematical models, to allow a systems level
investigation of emergent behaviours that cannot be understood by studying the
individual components of the system in isolation (Le Nov`ere, 2015).
Mathematical models are a description of an experimentally delineated phenomenon
by means of mathematics, with a view to capture the salient aspects of the
phe-nomenon at hand (van den Berg, 2011). Although not immediately clear from this
definition, mathematical models have proved to be a powerful tool to help integrate
information from large and varied data sets, gain mechanistic understanding of a
system, and predict the system response in a wide range of alternative scenarios
(Chandran et al., 2008; Zheng and Sriram, 2010; MacDonaldet al., 2011).
The goals of a mathematical model can be varied, and the usefulness of a particular
model must be judged on the basis of those objectives. Models can be used to
estimate the numerical value of parameters of interest, such as the rate of an
enzymatic reaction. Alternatively, models can make predictions of data values
for scenarios that have not been tested, or molecular species that cannot be easily
measured. A third option is to construct several models that implement competing
hypotheses to describe the same phenomenon, and then perform experiments that
can discriminate between them. Although the options listed are not mutually
exclusive, the emphasis for a particular model will usually fall on only one of these
categories, however, they can all be seen from a wider perspective as being maps
used to locate areas of ignorance.
Building an appropriate mathematical model for a system of interest relies on prior
is never a linear process, and typically requires several iterations between
experi-mentation and model refinement to reach the model objectives.
1.4.1
Model and parameter identifiability
Mathematical modelling can be used to predict the behaviour of a signalling
path-way and the effects of altering its structure; however, the strength of its predictions
depends intrinsically on the accuracy of estimated model parameters. Due to
tech-nical limitations, biological reaction networks are often only partially observable.
This means that not all species incorporated into a model can be measured
di-rectly. Given a certain amount and quality of experimental data, the estimation of
the model parameters might be ambiguous, or non-identifiable. If model
parame-ters are not well determined, it follows that model predictions will not be either
(Kreutz and Timmer, 2009).
Two types of non-identifiability can occur. A structural non-identifiability arises
from the model structure only, and is independent of any experimental data
(Bell-man and ˚Astr¨om, 1970). A parameter that is structurally identifiable may still
be practically non-identifiable, owing to insufficient amount and quality of
ex-perimental data or inappropriately chosen measurement time points (Raue et al.,
2011).
The functional relationships that cause structural non-identifiabilites are a
conse-quence of the model structure only, due to insufficient mapping between
observ-ables and state variobserv-ables, and thus can only be solved by factors affecting this
mapping, such as qualitatively different measurements, or model reduction.
Various approaches have been proposed to detect non-identifiability. Approaches
that analyse model equations analytically are called a priori methods, as they
methods have the advantage that conclusions about identifiability hold globally for
the entire parameter space (Chiset al., 2011); however, these approaches only test
for structural identifiability. Although structural identifiability might be ensured
a priori, practical non-identifiability can cause severe problems when estimating
model parameters from real experimental data (Raueet al., 2011).
Data-based approaches utilise the shape of the likelihood function to infer
identifi-ability. This naturally involves experimental data, and therefore allows statements
about practical identifiability akin to confidence intervals (Henglet al., 2007).
Ow-ing to data dependency, the results of these methods cannot ensure global validity.
Nevertheless, they allow statements about the region of parameter space specified
by experimental data, which is often sufficient for applications (Raueet al., 2009).
If non-identifiability is detected, it can be resolved either by experimental design,
measuring additional data under suitable conditions; or by model reduction,
tailor-ing the size of the model to the information content provided by the experimental
data (Roper et al., 2010).
1.5
Project aims
As outlined in section 1.3, the regulation of the master transcription factor Ste11
is multilayered and complex, therefore, to date there have been no attempts to
model the dynamics of the mating response inS. pombe. This lack of mathematical
modelling efforts has prevented the study of system-level properties that may
control the decision making process for commitment to mating.
To address this issue, the use of mutant strains that cut down the complexity
of Ste11 regulation is proposed, which would allow the mating response to be
modelled exclusively as a function of the pheromone signalling pathway and its
mating response, the system-level mechanisms that govern the decision to mate
can begin to be studied, while minimising the uncertainty introduced from the lack
of mechanistic knowledge about all the pathways involved in Ste11 regulation. In
addition, this new model could serve as a starting point for future models that
re-incorporate the control mechanisms ignored in this study.
To accomplish these goals, the following project aims were established:
• To develop a quantitative dynamical model ofS. pombepheromone signalling
that takes into account feedback loops at the gene regulatory network level.
• To generate the necessary quantitative time course data to estimate the
pa-rameters of the model.
• To analyse the model to investigate the roles of feedback regulation in
Materials and methods
2.1
Experimental methods
2.1.1
Bacterial transformation
Escherichia coli strain DH5α (supE44 hsdR17 endA96 thi-1 relA1 recA1 gyrA96)
was used to prepare chemically competent bacteria and for DNA transformation
as described by Sambrook and Russell (2001).
2.1.2
Small scale isolation of plasmid DNA
Plasmid DNA was isolated and purified from transformed bacterial cultures using
QIAprep Spin Miniprep kits according to manufacturer instructions (Qiagen, UK).
2.1.3
Amplification of DNA sequences by polymerase chain
reaction (PCR)
PCR reactions were performed using a Phusion High-Fidelity DNA polymerase
(ThermoFisher, UK). Oligonucleotide primers were prepared by standard
solid-phase synthesis, and purified by desalting (Sigma-Aldrich, UK). Reactions were
setup in ice and transferred to a pre-heated thermocycler for the amplification
reaction. Typical reactions were prepared as detailed in Table 2.1. Typical cycling
[image:34.596.193.440.336.538.2]conditions are shown in Table 2.2
Table 2.1: Phusion PCR reaction setup.
Component Final concentration
5X Phusion HF Buffer 1X
dNTPs 200 µM
Forward primer 0.5 µM
Reverse primer 0.5 µM
Template DNA ∼ 10 ng
Phusion DNA Polymerase 1 unit / 50µL
Nuclease-free water to 50 µL
2.1.4
Site-directed mutagenesis
Site-directed mutagenesis of DNA sequences was performed by PCR as described
by Liu and Naismith (2008). The main difference in this protocol compared to
other methods is the primer design stage, where the primers should have an
over-lapping region at their 5’ end, and a large non-overover-lapping region at their 3’
end. The difference in melting temperature between the two regions should be
Table 2.2: Thermal cycling conditions for Phusion PCR. The optimal anneal-ing temperature was determined empirically for each primer pair.
Step Temperature Time
Initial denaturation 98°C 30 sec
25-35 cycles
98°C 10 sec
X°C 30 sec
72°C 30 sec per kb
Final extension 72°C 5-10 min
Hold 4
through PCR amplification of the target plasmid with the mutagenesis primers,
followed by DpnI digestion to eliminate the original template DNA, and bacterial
transformation with the mutated PCR product.
2.1.5
Gibson assembly
Gibson assembly allows the joining of DNA molecules with overlapping sequences
in a single isothermal reaction by simultaneous use of exonuclease, polymerase, and
ligase enzymes. Molecular cloning through Gibson assembly was performed using
the Gibson Assembly Master Mix (New England BioLabs, UK). DNA fragments
for Gibson assembly were prepared by PCR as described above. Reactions were
prepared with 100 ng of vector and a 2-3 fold concentration excess of inserts in
a 20 µL volume with 1X final concentration of the Master Mix. The assembly
reactions were performed in a thermocycler at 50°C for 30 min, and stored at 4°C
2.1.6
DNA sequencing
All DNA constructs created in this work were verified by Sanger sequencing
(GATC Biotech, UK).
2.1.7
RNA extraction from
S.
pombe
The protocol used for RNA extraction from fission yeast was first described by
Lyneet al.(2003). Cells were harvested by centrifugation at 800×g for 2 min, and
snap frozen in dry ice/methanol. Frozen pellets were thawed on ice, resuspended
in 1 mL of RNase-free water (Fisher Scientific, UK), and transferred into 2 mL
PCR clean safe-lock tubes (Eppendorf, UK). Cells were centrifuged at 1,500 × g
for 10 sec and the supernatant removed. Cell pellets were resuspended in 750 µL
TES (10 mM Tris pH 7.5; 10mM EDTA pH 8; 0.5% SDS), followed immediately
by adding 750µL of acidic phenol-chloroform (Sigma-Aldrich, UK), vortex mixing,
and incubation at 65°C for 1 hr. After heat treatment, samples were cooled on
ice for 1 min, mixed by vortex for 20 sec, and centrifuged at 15,000 × g for 15
min at 4°C. Heavy phase lock gel 2 mL tubes (5 Prime, Germany) were prepared
by centrifugation for 10 sec at max rpm and loaded with 700 µL of acidic
phenol-chloroform. 700 µL of the water phase from sample tubes were transferred to the
phase lock gel tubes, mixed thoroughly but gently through repeated inversion, and
phases were separated by centrifugation at 15,000× g for 5 min at 4°C. 700 µL of
the water phase were transferred to a new batch of phase lock gel tubes, this time
prepared with 700 µL of chloroform:isoamyl alcohol (24:1) (Sigma-Aldrich, UK).
Samples were again mixed gently, and phases were separated by centrifugation at
15,000×g for 5 min at 4°C. 500µL of the water phase were transferred to normal
2 mL tubes containing a mixture of 1.5 mL 100% ethanol pre-chilled to -20°C and
50µL of 3 M sodium acetate pH 5.2. RNA was allowed to precipitate overnight at
×g, washed with 500 µL of 70% ethanol pre-chilled to 4°C, and air dried at room
temperature for 5 min. RNA pellets were resuspended in 100 µL of RNase-free
water by allowing it to soak at room temperature for 10 min, followed by dissolving
through pipetting and gentle vortex mixing for 10 sec.
Extraction yields were quantified by spectrophotometry with a NanoDrop 2000c
instrument (Thermo Scientific, UK), and 100µg of total RNA were further purified
using a RNeasy plus kit (Qiagen, UK). Briefly, genomic DNA is first removed by
filtering the RNA solution through a proprietary column that selectively binds
DNA. The flowthrough is then mixed with 1 volume of 70% ethanol and bound
to a silica gel spin column by centrifugation at 8,000 × g. Bound RNA is washed
twice with 500 µL of buffer RPE, and eluted twice in 50 µL of RNase-free water.
Total RNA integrity was verified with an Agilent 2100 Bioanalyzer nanofluidics
device running Agilent RNA 6000 Nano chips (Agilent Technologies, UK).
2.1.8
cDNA synthesis
Reverse transcription (RT) from total RNA was performed using the QuantiTect
Reverse Transcription kit (Qiagen, UK), following manufacturer recommendations.
Up to 1µg of total RNA was used per reaction and prior to the reverse transcription
reaction, genomic DNA was eliminated by incubation with the proprietary gDNA
Wipeout buffer at 42°C for 2 min. The entire gDNA elimination reaction was then
used for cDNA synthesis with an RT primer mix consisting of a blend of oligo-dT
and random primers.
2.1.9
Real-time quantitative PCR (qPCR)
qPCR assays were prepared using the QuantiTect SYBR Green PCR kit (Qiagen,
volumes with a final primer concentration of 0.3 µM for each one, and 100 ng
of cDNA per reaction. Data acquisition was performed on a ABI PRISM 7000
Sequence Detection System (Applied Biosystems, UK), using semi-skirted 96-well
plates (Starlab, UK), sealed with ThermalSeal RT2 adhesive films (Alpha Labs,
UK). The cycles of quantification (Cq) were determined through the SDS software
that controls the thermocycler.
2.1.10
Droplet digital PCR (ddPCR)
ddPCR assays were prepared using the QX200 ddPCR EvaGreen Supermix kit
(Bio-Rad, UK), following manufacturer recommendations. Reactions were setup in
20µL volumes with a final primer concentration of 0.3µM for each one, and a 1:20
dilution of cDNA sample per reaction, corresponding to ∼40−50 ng of cDNA.
Assays were run using the QX200 ddPCR system (Bio-Rad, UK), which consists
of the QX200 droplet generator, the QX200 droplet reader, and the QuantaSoft
software for data analysis. PCR amplification was performed on a C1000 Touch
thermal cycler (Bio-Rad), using semi-skirted 96-well plates (Starlab, UK), sealed
with a PX1 PCR plate sealer (Bio-Rad, UK).
2.1.11
Concentrating protein samples
The concentration of protein samples was performed using centrifugal filters for
ultrafiltration. Samples were concentrated by a factor of 10X using the 500 µL
Amicon Ultra-0.5 filters (Millipore, UK), or by a factor of 200X using the 70
mL Centricon Plus-70 filters (Millipore, UK). The nominal molecular weight limit
(NMWL) of the filters was chosen to be at least two times smaller than the
molec-ular weight of the protein intended for concentration. For Sxa2-GFP samples (∼50
speed, followed by a recovery step inverting the filter into a collection tube, and
centrifuging at 1,000 g for 1 min.
2.1.12
anti-GFP Enzyme-linked immunosorbent assay (ELISA)
Quantification of GFP fusion proteins was performed using the ab171581 - GFP
SimpleStep ELISA kit according to manufacturer instructions (abcam, UK).
Read-ings of optical density (OD) were performed at 420 nm using a Berthold Mithras
LB940 microplate reader (Berthold Technologies, UK).
2.1.13
Yeast strains
The yeast strains used in this study are listed in Table 2.3. Correct integration of
DNA fragments used to generate new yeast strains was verified by PCR analysis.
2.1.14
Yeast growth conditions
All strains used in this study were cultured at 29°C. Liquid cultures were
addi-tionally aerated by constant shaking at 180 rpm using New Brunswick Innova 44
shaking incubators (Eppendorf, UK). Yeast growth media was prepared following
Daveyet al.(1995). For routine growth and maintenance yeast were cultured using
yeast extract (YE) rich medium (0.5% yeast extract, 3% glucose). For pheromone
experiments yeast were cultured using defined minimal media (DMM) (Table 2.4
and 2.5). Required supplements for auxotrophies were added to a final
concentra-tion of 225 mg/L as required. To prepare solid growth media, liquid media was
sup-plemented with 2% agar (Merck BDH, UK). P-factor used for pheromone
experi-ments was custom-ordered and was synthesised using 9-fluoroenylmethoxycarbonyl
(FMOC) protection chemistry (Alta Bioscience Ltd, UK). The final concentration
Table 2.3: S. pombe strains used in this study.
Strain Genotype Reference
JY486 mat1-M, ∆mat2/3::LEU2
−, leu1−, ade6-M216,
(Didmonet al., 2002)
ura4-D18, cyr1-D51
JY522 mat1-M, ∆mat2/3::LEU2
−, leu1−, ade6-M216,
(Didmonet al., 2002)
ura4-D18, cyr1-D51,sxa2::ura4+
JY544 mat1-M, ∆mat2/3::LEU2
−, leu1−, ade6-M216,
(Didmonet al., 2002)
ura4-D18, cyr1-D51,sxa2>lacZ
JY1325 mat1-M, ∆mat2/3::LEU2
−, leu1−, ade6-M216,
(Smith, 2009)
ura4-D18, cyr1-D51,sxa2>GFP
JY1741 mat1-M, ∆mat2/3::LEU2
−, leu1−, ade6-M216,
This study
ura4-D18, cyr1-D51,sxa2S200A-6xHis
JY1743 mat1-M, ∆mat2/3::LEU2
−, leu1−, ade6-M216,
This study
ura4-D18, cyr1-D51,sxa2-GFP
JY1744 mat1-M, ∆mat2/3::LEU2
−, leu1−, ade6-M216,
This study
ura4-D18, cyr1-D51,sxa2S200A-GFP
2.1.15
Yeast transformation
S. pombe cells were transformed using the lithium acetate method as described by
Okazaki et al. (1990).
2.1.16
Cell counting and cell volume measurement
The number of cells per mL of culture and the median volume of cells was
Table 2.4: Composition of DMM growth medium.
Per litre Final concentration
5 g NH4Cl 93.5 mM
2.2 g Na2HPO4 15.5 mM
3 g potassium hydrogen phthalate 14.7 mM
20 g glucose 2% w/v
20 mL salt stock (see Table 2.5)
1 mL vitamin stock (see Table 2.5)
0.1 mL mineral stock (see Table 2.5)
2.1.17
β-galactosidase assay
Ste11-mediated transcriptional activity in response to P-factor was measured using
strain JY544 containing alacZ reporter integrated at thesxa2 locus as described
by Didmon et al. (2002). Cells were stimulated with the desired dose of P-factor
and incubated under standard conditions for 16 hrs. β-galactosidase activity was
determined by lysing 50µL of cells in 750µL of Z-buffer (Table 2.6), and continuing
the incubation at 29°C for 90 min. Reactions were stopped with 200 µL of 2 M
sodium carbonate. OD measurements were read at 420 nm and activity units were
expressed as OD420/106 cells.
2.1.18
Confocal fluorescence microscopy
Cells were imaged on DMM agarose pads (2 %) using a CoverWell imaging chamber
(Grace Bio-Labs, USA). Coverslips were sealed using vaseline to prevent drying.
Image acquisition was performed using a Leica TCS SP5 confocal microscope
(Le-ica Microsystems, UK). Microscopy images were processed using the open source
Table 2.5: Stock solutions for DMM media.
50× salt stock (per litre) Final concentration
52.5 g MgCl2·6H2O 0.26 M
0.735 g CaCl2·2H2O 4.99 mM
50 g KCl 0.67 M
2 g Na2SO4 14.1 mM
1000× vitamin stock (per litre)
1 g pantothenic acid 4.20 mM
10 g nicotinic acid 81.2 mM
10 g inositol 55.5 mM
10 mg biotin 40.8 µM
10,000× mineral stock (per litre)
5 g boric acid 80.9 mM
4 g MnSO4 23.7 mM
4 g ZnSO4·7H2O 13.9 mM
2 g FeCl2·6H2O 7.4 mM
0.4 g molybdic acid 2.47 mM
1 g KI 6.02 mM
0.4 g CuSO4·5H2O 1.60 mM
10 g citric acid 47.6 mM
2.2
Computational methods
Model building, simulations and sensitivity analysis were performed using the
SimBiology toolbox for MATLAB R2013a (The MathWorks, UK). Parameter
es-timation and Profile Likelihood eses-timation was performed using the Potterswheel
Table 2.6: Composition of Z-buffer forβ-galactosidase assays.
Component Final concentration
NaPO4 0.1 M
KCl 10 mM
MgSO4 1 mM
β-mercaptoethanol 50 mM
chloroform (v/v) 0.5%
SDS (w/v) 0.005%
for MATLAB. Symbolic calculations necessary for structural identifiability and
Model derivation
3.1
Existing models of pheromone signalling
To date the only published examples of using mathematical modelling to study
pheromone signalling in S. pombe, have come out of the research group led by
Graham Ladds (Smith et al., 2009; Croft et al., 2013).
The first model arose from the need to explain a highly repeatable experimental
result that seemed to contradict the known biochemical function of Rgs1, namely,
functioning as a GAP for the G protein Gpa1 (see subsection 1.3.8). It therefore
came as a surprise that deletion of rgs1, a negative regulator, would decrease the
maximum level of signalling output that yeast cells were capable of producing.
However, in the absence of pheromone stimulation, the basal level of pathway
activity was indeed elevated in rgs1∆ cells, in line with original expectations for
this genotype.
Solving this conundrum required postulating a dual role for Rgs1, with both
neg-ative and positive effects on signalling output. The simplest way to assign a
pos-itive role for Rgs1 is to assume that GTP hydrolysis is somehow a limiting step
for the activation of downstream effectors. This was translated into an extension
of the canonical G protein cycle (Yi et al., 2003), where after a single round of
downstream effector activation, Gα·GTPwould transition into a hypothetical (still
GTP-bound) inert state (Figure 3.1).
Figure 3.1: Inert Gα·GTP hypothesis. Accelerating GTP hydrolysis of Gα·GTP by Rgs1 has two different functions within the G protein cycle of
S. pombe pheromone signalling. G protein deactivation before effector activa-tion (red) limits the amount of unwanted pathway activaactiva-tion due to the intrinsic rate of Gpa1 nucleotide exchange. Ligand mediated GEF activity of the recep-tor overcomes the initial Rgs1 barrier and after activating one effecrecep-tor molecule, Gα·GTPenters an inert state (circled in dashed line), and GTP hydrolysis be-comes rate-limiting for prolonged signalling. GAP activity of Rgs1 on inert Gα·GTP (blue) renews the availability of Gα·GDP to resume the cycle for as
long as the receptor remains active.
This restructuring of the G protein cycle explained how deletion ofrgs1 would
in-crease the basal levels of Gα·GTPdue to spontaneous nucleotide exchange of Gpa1,
and also provided a mechanism for Rgs1 being essential to reach full pathway
ac-tivation, because once all Gpa1 molecules have become activated and thereafter
inert, GTP hydrolysis is necessary to provide fresh input to restart the cycle.
Im-portantly, the model proposed by Smith et al.(2009) predicted a counterintuitive
relationship between Rgs1 concentration and maximal levels of signalling output
that was confirmed experimentally (Figure 3.2) (Smith et al., 2009).
Although highly praised by reviewers for its ability to predict unexpected
lev-els of signalling output in response to experimental manipulation of Rgs1, the
Figure 3.2: Dependence of pheromone signalling on Rgs1 concentration. Dose-response plots of total signalling output are compared between the mathemat-ical model (A), and experiments (B) under four different Rgs1 concentrations
relative to wildtype cells. Data were first published in Smithet al. (2009).
said experiments depends on a hypothetical inert Gα·GTP state. This
assump-tion runs contrary to the accepted view of G protein funcassump-tion as a binary switch,
and although the experiments could not be explained in any other way under
a conventional G protein cycle, some reviewers were unwilling to entertain this
hypothesis.
and to extend the model to include spatial regulation of Rgs1; however, Gpa1
turned out to lose all activity when tagged, despite a thorough attempt using
many different epitopes inserted at various positions (Croft, 2012). This limitation
hindered the ability to experimentally test the inert Gα·GTP hypothesis.
The work presented in this thesis began with the intention of using the Smithet al.
(2009) model as a starting point upon which a whole systems view of pheromone
signalling could be built, beyond the G protein cycle, that included feedback
reg-ulation at the gene network level. For this reason an immediate priority was
attempting to recast the dual role of RGS into a more biologically plausible
mech-anism that would be easier to accept by other researchers in the field of G protein
study.
3.1.1
Reformulating the inert Gα
·
GTPhypothesis
G proteins are signal transducers but they are not signal amplifiers, one Gα·GTP
molecule will only activate one downstream effector until GTP hydrolysis
ter-minates signalling (Purves et al., 2004). The most well understood example of
G protein signal transduction is that of Gαs activating adenylate cyclase, where
binding GTP creates a conformational change in Gαs, allowing a protein-protein
interaction that stabilizes the catalytically competent structure of adenylate
cy-clase (Tesmer et al., 1997). In this case because adenylate cyclase is an enzyme,
a long-lived interaction between Gα·GTP and effector will actually enhance the
extent of signal transduction.
The direct effector that Gpa1 activates has not been identified, but it is known
that between G protein and MAPK cascade, the signal must travel through the
small GTPase Ras1 (Xuet al., 1994). Crystallographic studies have revealed that
effectors, which means there is competition between all possible interaction
part-ners to bind Ras (Wittinghofer and Vetter, 2011). Thus, the lack of processivity
by G proteins combined with competition for overlapping interaction surfaces in
Ras, could create a potential bottleneck in signalling if Ras1 is in fact the direct
effector activated by Gpa1.
In S.pombe there are two different GEFs that target Ras1, where activation by a
particular GEF leads to downstream signalling of only one of two distinct
path-ways; however, details of how pathway specificity is achieved have not been
estab-lished (Papadakiet al., 2002; Tamanoi, 2011). Pheromone-dependent activation of
Ras1 depends on the GEF Ste6, a cytosolic protein with no lipid modifications that
would allow it to stably reside at the plasma membrane (PM), so like human
Ras-GEFs, Ste6 probably requires a PM-bound adaptor protein to interact effectively
with Ras1 (Hughes et al., 1990; Papadaki et al., 2002; Matsuyama et al., 2006).
An ideal candidate to fulfil this role is Gpa1, since it would immediately suggest
how pathway-specific Ras activation is enforced. Furthermore, a proteome-wide
interaction network of S. pombe, obtained by machine-learning using a variety of
data that include conserved interactions across homologues, predicts with high
confidence a direct interaction between Gpa1 and Ste6 (Pancaldi et al., 2012).
Based on the information discussed above, a new reaction scheme for the G protein
cycle of pheromone signalling can be proposed (Figure 3.3). Gpa1-dependent
activation of Ras1 occurs in complex with Ste6. While bound to Gpa1, Ras1 is
unable to interact with its effectors, so the half-life of the Gα·GTP-Effector complex
can limit the rate of signal transduction. This complex would eventually break
apart due to the intrinsic GTPase activity of Gpa1, but the rate of dissociation is
greatly increased by GAP activity of Rgs1. In addition, activated Ras1 is subject
to continual deactivation by its own GAP, Gap1 (Imaiet al., 1991).
Figure 3.3: New G protein cycle proposed forS.pombe pheromone signalling. Rate-limiting complex dissociation is a more plausible mechanism than an inert Gα·GTPto explain the dual role of Rgs1 in pheromone signalling. RGS prevents Gα·GTPaccumulation in the absence of receptor GEF activity (red). Gα·GTP
can bind an inactive effector (OFF) and promote its transition towards an active state (ON). Further downstream signalling depends on release of the active effector which relies on GTP hydrolysis catalysed by RGS (blue). Without RGS the rate of complex dissociation will be reduced to the intrinsic GTPase activity of Gα, resulting in a reduced maximal rate of signalling output due to
sequestration of effector (circled in dashed line).
biochemistry, and should be easier to validate experimentally compared to an inert
Gα·GTPstate. For example, by confirming the interaction between Gpa1 and Ste6
through co-immunoprecipitation, or by generating mutants that alter the lifetime
of the complex and comparing the resulting dose-responses with model predictions.
However, it can only be considered an acceptable replacement if it can successfully
reproduce the Rgs1 perturbation experiments. A simulation analysis performed
to compare the differences between the two reaction schemes found, as expected,
that they are functionally equivalent and equally capable of explaining a dual role
for Rgs1 in signalling (Figure 3.4).
As mentioned above, a separate project worked to extend the original Smith et al.
(2009) model to include spatial regulation of Rgs1. Since that project was at a
publishing stage when this project began, the model submitted for publication still
Figure 3.4: Equivalence between rate-limiting complex dissociation and an inert Gα·GTP state. The reaction schemes shown in figures 3.1 and 3.3 were simulated under identical conditions with four different RGS concentrations as in Figure 3.2. Plots show the rates of active effector production. (A) Simulation of the inert Gα·GTP model. (B) Simulation of the rate-limiting dissociation
model.
case, publication was held back as reviewers challenged the basis of an inert Gα
state. Shortly after having developed a better alternative, the extended model was
rebuilt using the rate-limiting complex dissociation mechanism. This model was
immediately accepted for publication (Croft et al., 2013).
The initial work using the Smithet al. (2009) model highlighted several modelling
considerations that made it inadequate for the goals of this project (section 1.5).
The Smith et al. (2009) model was developed working with data that can only
be compared qualitatively (transcriptional reporter), thus its parameters were not
many steps in the pheromone response pathway have not been described in detail,
and so cannot be modelled explicitly to the same level of detail as in the Smithet al.
(2009) model. To develop a quantitative model that allows investigating the roles
of feedback control requires generating data that are appropriate for parameter
estimation, and that the structure of the model ensures a high confidence in the
estimated parameters, so that control can be correctly attributed to particular
feedback loops. Under these constraints it is considered better practice to aim for
a coarser model that includes less detail, but gains in confidence of the estimated
parameters (Bornholdt, 2005; Raue et al., 2011). For these reasons it was decided
to develop a completely new minimal model of pheromone signalling that focuses
on feedback regulation.
3.2
A minimal model of feedback control for
pheromone signalling
The switch from proliferation to sexual differentiation in S. pombe depends on
activation of the Ste11 transcription factor. All the mechanisms that regulate this
decision converge their input on Ste11 to ensure its activation is timely and only
occurs under appropriate circumstances (Anandhakumar et al., 2013). Due to its
central role in yeast mating, the focus of the model is placed on Ste11 and the
feedback loops that are created around it.
Commitment to mating is mainly controlled by two signalling pathways, the
nutrient-sensing cAMP pathway, and the pheromone response MAPK pathway
(Otsubo and Yamamoto, 2012). For this reason it is common practice in studies
that focus on pheromone signalling to use a cyr1∆ genotype as a base strain, to
ensure that any observed effects are exclusively due to events controlled by the


![Table 3.3: Individual confidence intervals [determined by PLE for parameters of model A1B1C1D1E1 fitted to Laddsσ−, σ+] to 95% confidence level et al.(1996) data](https://thumb-us.123doks.com/thumbv2/123dok_us/9491400.455080/79.596.183.448.325.603/individual-condence-intervals-determined-parameters-tted-laddss-condence.webp)