University of Warwick institutional repository: http://go.warwick.ac.uk/wrap
A Thesis Submitted for the Degree of PhD at the University of Warwick
http://go.warwick.ac.uk/wrap/62745
This thesis is made available online and is protected by original copyright. Please scroll down to view the document itself.
Nanomechanical Investigation of Soft Biological Cell
Adhesion using Atomic Force Microscopy
Eleftherios Siamantouras
A thesis submitted for the degree of Doctor of Philosophy in the University of Warwick
School of Engineering, University of Warwick January 2014
Biomedical Engineering School of Engineering University of Warwick
i
List of figures iv
List of tables xvi
Acknowledgments xix
Declaration xx
Abstract xxii
List of abbreviations xxiii
Chapter 1. Nanomechanics in Cellular Biology
1.1 Introduction 2
1.2 General Background 3
1.3 Mini-Review of Nanomechanical Tools 11
1.4 Atomic Force Microscopy 14
1.4.1 AFM Basics 15
1.4.2 Force Spectroscopy in Biology 16
1.4.3 Application of AFM on Single Cell Elasticity 18 1.4.4 Application of AFM on Cellular Adhesion 23
1.5 Diabetes Mellitus 27
1.5.1 Pathophysiology of the Endocrine Pancreas 27 1.5.2 Historical Background & Implications 30 1.5.3 Physiological Secretory Function & Islet Architecture 31
1.5.4 The MIN6 Model Islet 33
1.5.5. The Extracellular Calcium-Sensing Receptor (CaSR) 34
1.5.6 CaSR Activation 36
1.6 Diabetic Nephropathy 37
1.6.1 Molecular Mediators of Renal Fibrosis in DN: TGF-β1 38
1.6.2 EMT & E-Cadherin in DN 39
1.6.3 Renal Proximal Tubule Cells: The Human Kidney
Cell Line (HK) 2 41
ii
2.2 Hardware Overview 48
2.2.1 AFM-FS Instrumental Set-up 48
2.2.3 Set-up of the Optical Detection System -
Laser Path Alignment 50
2.2.4 Selection of the Cantilever Sensor 54
2.3 AFM Calibration 58
2.3.1 Measuring the Sensitivity 59
2.3.2 Spring Constant Calibration in Fluid using
the Thermal Noise 60
2.4 Tissue Culture 64
2.4.1 Culture of HK2 cells 64
2.4.2 Culture of MIN6 cells 65
2.5 Single Cell Force Spectroscopy for Cell-to-cell Adhesion 66 2.5.1 Functionalisation of Cantilevers with Fibronectin 67 2.5.2 Preparation of Suspended Cells - Scrape Delivery
Procedure 69
2.5.3 Single Cell attachment 70
2.5.4 Cell-to-cell Adhesion Measurements 71
2.6 Single Cell Force Spectroscopy for Single Cell Elasticity 74
2.6.1 Colloidal Probe Preparation 76
2.6.2 Calculation of Elasticity using the Hertzian
Mechanics Model 78
2.6.3 Force & Displacement Mode for AFM-FS Indentation 84
2.6.4 Single Cell Indentation Measurements 87
2.7 Data Processing & Analysis 88
2.7.1 Adhesion Data Processing 88
iii
3.1 Introduction 95
3.2 Effects of CaSR Activation on Functional β-Cell-to-β-Cell Adhesion
96
3.3 Effects of CaSR Activation on Single Cell Elasticity 112
3.4 Effects of Pulling Speed on β-Cell-to-β-Cell Adhesion 119
3.6 Conclusion 125
Chapter 4. Nanomechanical Characterisation of Renal Proximal Tubule HK2 Cell-to-Cell Adhesion 4.1 Introduction 128
4.2 Effects of TGF-β1 on Functional Cell-to-Cell Adhesion 129
4.3 Effects of TGF-β1 on Single Cell Elasticity 143
4.4 Effects of Pulling Speed on Cell-to-Cell Adhesion 153
4.6 Conclusion 160
Chapter 5. Synopsis & Future Work 5.1 Research Highlights 163
5.2 Limitations 165
5.3 Future Work 166
References 169
Bibliography 184
iv Figure 1.1 The cell membrane forms an outer boundary of the cell and is essentially a double layer of lipid molecules that regulates the passage of substances in and out of the cell as well as its response to chemical signals such as hormones. Focal ad-hesion points are high protein concentration points on the membrane, which are as-sociated with the microfilament network in the inside and cell surface receptors or extracellular matrix on the outer side of the cell. The cytoplasm is a fluidic like media which forms a suspension for the organelles, including a network of protein filaments that maintains the shape called the cytoskeleton.
Figure 1.2 The Young’s (elastic) moduli of different biological materials.
Figure 1.3 A systematic sketch of cell nano-biomechanics associated with physio-logical and pathophysio-logical processes, which are important for the future progress in nanomedicine.
Figure 1.4 Diagram showing the force range of force common nanomechanical test-ing instruments, in relation to the range of major biological structures/processes.
Figure 1.5 Schematics of common nanomechanical testing techniques.
Figure 1.6 Basic components of AFM. During force spectroscopy experiments the cantilever is stationary in x-y direction but ramped at a given position in z-direction. A laser is used to read on a diode the deflection of a very soft cantilever equipped with a sharp tip. Mechanical contact is controlled via feedback between the piezo and the photodiode.
v permit the direct transfer of small molecules and ions between coupled cells and their formation depends on E-cadherin based cell-cell adhesion. The pro-fibrotic cy-tokine TGF-β1 is associated with elevated glucose and it is important in many tubulointerstitial diseases where disassembly of the adherens junction (AJ) repre-sents the initial overt change in epithelial organisation ahead of cellular migration as-sociated with EMT.
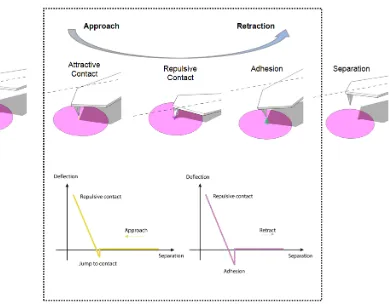
Figure 2.1 Schematic diagram of the vertical tip movement during the approach and retract process in force spectroscopy for the measurement of F-d curves. As the probe approaches within a few tens of nanometers, it comes into a regime of an at-tractive van der Waals forces. The probe is weakly attracted toward the sample sur-face and as it approaches closer to the sample, it enters in the repulsive realm of Lennard-Jones potential, where the probe is strongly repelled from the surface. As the cantilever is retracted from the sample, the tip remains in contact with the surface due to interaction forces, and the cantilever is deflected downwards. At some point of retraction, the force required to disrupt the adhesion is reached. The attractive or re-pulsive forces can be measured by spring stiffness.
Figure 2.2 A schematic illustration of a single cell indentation and a representation of a F-d curve obtained from a single cell. Various elements of the cell are contributing to the overall determination of the E modulus. Special considerations regarding the depth of indentation and the fitting of the curve to a mechanical model needs to be taken into account according to the purpose of investigation i.e. whole cell elasticity, membrane or CSK elasticity etc.
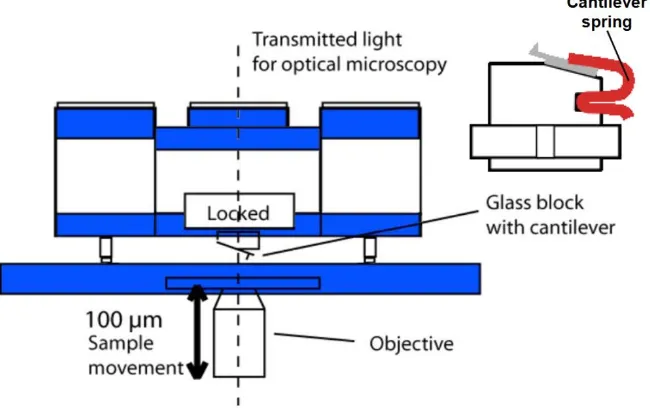
vi port on the microscope to monitor the experiments. The cantilever glass holder is positioned on place by lifting up the AFM head prior the experiments. Once the can-tilever is mourned on the head the alignment of laser can take place. After calibration of the cantilever the head must not be lifted nor the alignment of laser should be changed.
Figure 2.5 A schematic diagram showing the optical path of the laser. Initially the laser must be adjusted to get reflected from the end of the cantilever with the aid of the optical microscope. Then by adjusting both the mirror and the photodetector the laser spot must be adjusted to reach the centre of the photodetector to achieve maximum sensitivity.
Figure 2.6 An optical image showing proper alignment of the infrared laser spot on a tipless functionalised cantilever. Any residuals left from the chemical modification will affect the sum value of the detector. As it can be seen from the photo soft cantilevers used for contact mode are relatively transparent.
Figure 2.7 An Arrow series rectangular tipless cantilever with a triangular free end, made from monolithic silicon for special applications, i.e. they can be used for attach-ing cells or spheres to the free end of the cantilever. The wide part of silicon is usu-ally referred as 'chip', while the main of the cantilever has thickness: 1.0μm, width: 100μm and length: 500μm. At the end of the cantilever the tip can be seen where a cell or a microbead can be attached (Nanoworld Arrow™ TL1).
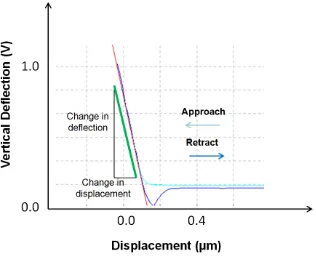
Figure 2.8 Measurement of force curve on a hard substrate (clean petri dish) in PBS solution for calibration. The linear part of the curve is chosen for the calculation of the gradient of the line. Here, the sensitivity is 55.3nm/V.
vii 0.03N/m.
Figure 2.10 Schematic design of the elements functionalising a tipless cantilever. The surface of the cantilever is first coated with PLL (25μg/ml in PBS, 30min in RT), which promotes the attachment of Fn molecules. The cantilever was next incubated in Fn solution (20μg/ml in PBS, 2h at 37°C), and finally brought in contact with the membrane of a suspended cell. Molecules in the surface of the cell that are involved in adhesion readily attach to Fn in the extracellular domain, while in the intracellular domain they are connected with actin filaments through adherens junction.
Figure 2.11 Phase contrast images of a single HK2 (a) and MIN6 (b) cell attached to a TL1 arrow tipless cantilever. The cantilever-cell was brought in contact with a sub-strate cell and a predefined contact time it was retracted to investigate functional tethering between two cells. Width of the cantilever (rectangular part): 100μm. Note the laser spot (purple) used for measuring the deflection of the cantilever.
Figure 2.12 A force distance curve of two MIN6 cells that are brought in con-tact.Initially the cells are bounded into a cantilever and the substrate (phase 1). Then they are approached to each other, and after a short period of contact the two cells are attached. During this time bonding is formed (phase 2). Next, the cantilever is retracted and force versus displacement is measured (phase 3) until they are com-pletely detached (phase 4). Based on the F-d retraction curve adhesion parameters can be determined including maximum force of detachment from the highest nega-tive deflection of the cantilever, work of removal from the area under the curve and distance of complete separation from maximum pulling range before separation. In addition unbinding steps that correspond to ligation rupture can be determined. Steps in the initial part of the curve, such as in 's' area, are followed after a bond rup-ture while 't' steps are followed after a deformation of membrane tethering.
viii elasticity.
Figure 2.14 Single and clusters of Polystyrene microbeads on a glass coverslip. The mean diameter of the bead is10μm with coefficient of variance ≤10%.
Figure 2.15 A spherical polystyrene microbead of 10μm in diameter attached on the very end of an Arrow TL-1 tipless cantilever. (a) An optical image showing the side view of the microsphere attached to the tip of the sensor. (b) An optical image showing the top view of the cantilever-bead and KH2 cells on the substrate.
Figure 2.16 Indentation of a single cell using spherical indenter, where δ is the in-dentation depth, α is the radius of the contact area between the probe and the plasma membrane, R is the radius of the probe and F the loading force.
Figure 2.17 Schematic design of the surface of a probe and the sample. Dotted line represent the theoretical assumption, while continuous line is a representation of the actual micro-environment. Roughness at molecular level contributes to the uncer-tainty of the determination of initial contact point and contact area during indentation. Various membrane extensions such as long chain molecules on the surface of the cell can cause a force jump indicating a false contact point.
ix important to take under consideration the effects of the substrate.
Figure 2.20 AFM indentation using force-controlled and height-controlled displace-ment of a cell with thickness 3.5μm. Hertz theory assumptions require that the depth of indentation depth δ is maximum 10% of the cell height. As shown in the F-d curves, the contact point was determined by a positive ramp of the force sensor. In (a), a set-point force of 4.5nN was used to indent the sample resulting in a displace-ment of approximately1500nm. As δ was increased the value of E modulus was in-creased significantly, suggesting that stiffer elements (e.g. nucleus or substrate) are contributing to the calculation of elasticity. In (b) a set-point force of 100pN was used to determine sample thickness with regards to the reference substrate and indenta-tion depth δ is fixed for the specific posiindenta-tion on the cell. The procedure was repeated for each testing cell.
Figure 2.21 Processing of cell-to-cell adhesion force curves. In (a) a raw F-d curve, as measured by AFM-SCFS, is shown. After applying the following functions: (1) smoothing, (2) set the x-axis Baseline, (3) detect the Contact point, (4) detect the Minimum Force value, (5) determine the Area under the curve and (6) Step fitting, the F-d retraction curve of (b) is resulted. As illustrated the determination of the point at which the cells are completely separated is the most important step, since the x-axis baseline acts as a reference for further analysis. Fmax is the difference between the minimum force value and the baseline, while WD (grey region) is the integral of the continuous area under the baseline. In addition, ds can be determined by the dif-ference between Fmax and the point of complete separation. Zooming in the x-axis displays detection of early unbinding events.
vari-x Figure 3.1 The morphology of MIN6 cells cultured in low extracellular calcium (0.5mM). In (a), an optical image of MIN6 cells in monolayers demonstrates that cells are organised in low proximity between each others, forming clusters that enable cell-to-cell coupling and communication. In (b), a fluorescence microscopy image of a single cell illustrates the cobblestone morphology that is maintained by the CSK (stained in red colour). The nucleus of the cell, occupying a large area of the cyto-plasm, is clearly shown (purple colour).
Figure 3.2 Phase microscopy image showing a β-cell-to-β-cell SCFS adhesion ex-periment. No morphological nor phenotypical changes between the samples were observed by optical images. The suspended cell was attached on the functionalised cantilever and then was brought in contact with a single substrate cell (within a clus-ter of cells) for 5secs, while force versus displacement were measured simultane-ously. In (a), an optical image showing MIN6 cells incubated for 48 hours in 0.5mM Ca2+ (Control) while in (b) cells were incubated in 0.5mM Ca2+ +R568.
Figure 3.3 The effects of CaSR activation, followed by treatment with the calcimi-metic R568, on E-cadherin mediated cell-to-cell adhesion were examined using AFM-SCFS. Fmax is the difference between the minimum force value and the point of complete detachment, WD (grey region) is the integral of the continuous area under the baseline of complete separation and ds is the difference between Fmax and the point of complete separation. Set-point force of 0.8nN, contact time of 5sec and pull-ing speed of 5μm/sec were remained constant throughout the experiments. Altera-tions of adhesion parameters such as Fmax, WD and ds provide an important insight about functional cell-to-cell adhesion. In (a) Fmax is 0.9nN, WD is 6.7 fJoule and ds is 34.6μm while in (b) Fmax is 1.3nN, WD is 16.9fJoule and ds is 54.2μm.
xi of TREs is 39, whilst most of the unbinding events occurred in the first 11μm of pull-ing range, correspondpull-ing to the area of 'j' and mixed 'j' and 't' events. In (b) the num-ber of TREs is 61, whilst most of the 'j' events occurred in the first 3.2μm. The arrows illustrating the displacement plateau combined with the fact that the initiation of 't' events occurred much earlier as shown in (b) indicates that MIN6 cells became more deformable after treatment with the calcimimetic.
Figure 3.5 Histograms of control cells showing (a) distribution of frequencies of maximum unbinding forces and (b) distribution of frequencies of work of detachment.
Figure 3.6 The effects of the calcimimetic R568 (1μM) on (b) the maximum unbind-ing force (increased by 30%), (c) the number of tetherunbind-ing rupture events (increased by 48%), (d) the work of detachment (increased by 39%) and (e) the distance to complete separation (increased by 72%) are shown. Data are expressed as mean ±SEM of more than 30 cells from 4 separate experiments, where key significances are shown, ***p<0.001.
Figure 3.7 Phase microscopy image showing a β cell indentation experiment. The cantilever was modified using a 10μm polystyrene microbead cell to enable indenta-tion of a single substrate cell (within a cluster of cells), while force versus displace-ment were measured simultaneously. In (a), an optical image showing MIN6 cells incubated for 48 hours in 0.5mM Ca2+ (Control) while in (b) cells were incubated in 0.5mM Ca2+ +R568.
xii Figure 3.9 Histograms of control cells showing distribution of frequencies of E modulus (a) in Ca2+ cells and (b) in Ca2++R568.
Figure 3.10 The effects of the calcimimetic R568 (1μM) on the E modulus (increased by 34%) of MIN 6. Data are expressed as mean ±SEM of more than 30 cells from 3 separate experiments, where key significances are shown, ***p<0.001.
Figure 3.11 Retraction F-d curves acquired by adhesion measurements of MIN6 cells trated with +R568 with incremental pulling speed are shown. The effects of in-creasing pulling speed on adhesion characteristics are clearly shown. For speeds higher than 5μm/sec partial separation was observed. The levels of incomplete sepa-ration were increasing with the increase of pulling speed resulting in the total rejec-tion of measurements with pulling speed of 15μm/sec due to the limitarejec-tion of 100μm in displacement range.
Figure 3.12 The effects of increasing pulling speed on the cell-to-cell adhesion pa-rameters of MIN6 cells obtained by SCFS retraction F-d curves. Data are expressed as mean ± SD and the effects of increasing pulling speed on (a) maximum unbinding force, (b) work of detachment and (c) number of tethering rupture events are illustrated.
Figure 4.1 Phase microscopy showing cell morphology of (a) healthy (control) cells and (b) cells treated with TGF-β1 (48h, 10ng/ml). It is clear that TGF-β1 evoked changes in cell morphology, resulting in translucent elongated cells that exhibited clear demarcation between neighbouring cells.
xiii Figure 4.3 The effects of the cytokine TGF-β1 on E-cadherin mediated cell-to-cell adhesion of HK2 cells were examined using AFM-SCFS. Fmax is the difference be-tween the minimum force value and the point of complete detachment, WD (grey re-gion) is the integral of the continuous area under the baseline of complete separation and ds is the difference between Fmax and the point of complete separation. Set-point force of 1.0nN, contact time of 10sec and pulling speed of 5μm/sec were remained constant throughout the experiments. Alterations of adhesion parameters such as Fmax, WD and ds provide an important insight about functional cell-to-cell adhesion. In (a) Fmax is 0.9nN, WD is 8.6 fJoule and ds is 61.7μm while in (b) Fmax is 0.68nN, WD is 2.7fJoule and ds is 28.2μm.
Figure 4.4 Retraction force-distance curves obtained by HK2 cell-to-cell adhesion measurements, showing the effects of TGF-β1 on the tether rupture events. Unbind-ing of ligations that occur durUnbind-ing the early pullUnbind-ing phase (approximately 5μm after the minimum force value) are preceded by a force ramp ('j' events). As the pulling tance increases an area is reached where the rupture events are preceded by a dis-placement plateau as well ('t' events) due to the deformation of the cell. In (a) the number of TREs is 73, whilst most of the unbinding events occurred in the first 8.2μm of pulling range, corresponding to the area of 'j' and mixed 'j' and 't' events. After that point and until the complete detachment of the cells extended separation displacements occurred ('t' events), owing to the deformation of the cell. In (b) the number of TREs is 51, whilst most of the unbinding events occurred in the first 3.85μm, and were not preceded by a displacement plateau.
Figure 4.5 Histograms of control cells showing (a) distribution of frequencies of maximum unbinding forces and (b) distribution of frequencies of work of detachment.
xiv Figure 4.7 Phase microscopy images showing HK2 cells indentation experiment. The cantilever was modified using a 10μm polystyrene microbead probe to enable indentation of a single substrate cell (within a cluster of cells for control group), while force versus displacement were measured simultaneously. In (a), an optical image showing normal HK2 cells (control) while in (b) cells that were treated for 48 hours with TGF-β1 are shown.
Figure 4.8 The effects of TGF-β1 treatment on E modulus as determined by the ex-tension F-d curves acquired using AFM-FS indentation.
Figure 4.9 Histograms of control cells showing distribution of frequencies of E modulus (a) in control cells and (b) in TGF-β1 treated cells.
Figure 4.10 The effects of the cytokine TGF-β1 (10ng/ml) on the E modulus of HK2 cells. Treated cells showed an increase of 71% compare to the untreated group. Data are expressed as mean ±SEM of more than 30 cells from 3 separate experi-ments, where key significances are shown, ***p<0.001.
Figure 4.11 Fluorescence microscopy images showing the effects of TGF-β1 on both cell morphology and cytoskeletal reorganisation. The changes in the arrange-ment of the cytoskeleton (red) mainly affected the cell architecture. The nucleus of each cell is shown in purple. is In (a), normal cells are shown that were grown in low glucose (5mM) alone, while in (b) cell treated with TGF-β1 (10ng/ml) are shown.
xv mean ± SD and the effects of increasing pulling speed on (a) maximum unbinding force, (b) work of detachment and (c) number of tethering rupture events are illus-trated.
xvi Table 2.1 Correction factors for rectangular cantilevers as suggested by Butt and Jaschke (1995).
Table 3.1 A table showing the number of tested MIN6 cells and retraction curves ob-tained using SCFS that were either processed or rejected. A total of 102 retraction measurements of 41 Ca2+ cells were analysed, while a total of 108 retraction curves of 41 Ca2++R568 cells were analysed. Approximately 1/3 of the curves were rejected due to disturbances when recording a retraction F-d curve.
Table 3.2 Table presenting descriptive statistics for the adhesion parameters, (a) of maximum unbinding force for the control and for the +R568 cells, (b) of work detach-ment for the control and for the +R568 cells, (c) of tether rupture events for the con-trol and for the +R568 cells and (d) of distance separation for the control and for the +R568 cells.
Table 3.3 Table presenting the differences between control and +R568 treated cells using paired wise t-test, (a) of the maximum unbinding force between control and +R568 cells, (b) of work detachment between the control and +R568 cells, (c) of the number of tether rupture events between the control and +R568 cells and (d) of the distance of separation between control and +R568 cells.
Table 3.4 A table showing the number of tested MIN6 cells and extension curves ob-tained in AFM-FS indentation that were either processed or rejected. A total of 157 extension F-d curves from 31 Ca2+ cells were analysed, while a total of 162 exten-sion curves of 32 cells treated with +R568 cells were analysed.
Table 3.5 Table presenting the descriptive statistics of the E modulus for the control cells and for the cells treated with R568.
xvii incremental retraction velocities. As shown, more than 1/2 of the curves of 10 and 12.5 μm/sec were rejected, while no cells at 15μm/sec were accepted for process-ing.
Table 4.1 A table showing the number of tested HK2 cells and retraction curves ob-tained from SCFS that were either processed or rejected. A total of 102 retraction measurements of 43 Control cells were analysed, while a total of 130 retraction curves of 44 TGF-β1 treated cells were analysed. Approximately 1/3 of the curves were rejected due to disturbances when recording a retraction F-d curve.
Table 4.2 Table presenting descriptive statistics for the adhesion parameters, (a) of maximum unbinding force for the control and for the TGF-β1 treated cells, (b) of work detachment for the control and for the TGF-β1 treated cells, (c) of tether rupture events for the control and for the TGF-β1 treated cells and (d) of distance separation for the control and for the TGF-β1 treated cells.
Table 4.3 Table presenting the differences between control and TGF-β1 treated cells using paired wise t-test, (a) of the maximum unbinding force between control and TGF-β1 cells, (b) of work detachment between the control and TGF-β1 cells, (c) of the number of tether rupture events between the control and TGF-β1 cells and (d) of the distance of separation between control and TGF-β1 cells.
Table 4.4 A table showing the number of HK2 cells that were used for the calculation of E modulus and extension curves obtained in AFM-FS indentation that were either processed or rejected. A total number of 264 extension F-d curves acquired from 53 control cells were analysed, while a total of 181 extension F-d curves out of 37 cells treated with the cytokine cells were analysed.
xix I would like to express my gratitude to my supervisor, Dr Isaac Kuo-Kang Liu, for all his support and guidance he offered throughout this research project. Also, I would like to thanks our collaborator Dr Paul Squires for highlighting the biological impor-tance of this research project. In addition, I would like to thanks Dr Claire Hills for preparing the cell samples and providing the fluorescence microscopy images for this work.
Moreover, I would like to thanks JPK instruments for the free installation of the Cell-Hesion200 system in our laboratory over a period of 6 months. Thereby, I would also like to thanks Dr Torsten Muller and Dr Alex Winkel for the seminar on AFM force spectroscopy.
This PhD was fully funded by the School of Engineering and I would like to express my gratitude for this financial support.
xx I hereby declare that the work on this thesis, submitted in partial fulfilment of the re-quirements for the degree of Doctor of Philosophy at The University of Warwick, pre-sents my own work and has not been previously submitted to any other institution for any degree, diploma or other qualification. The contribution of collaborative work has been specifically acknowledged. All sources of information have been acknowledged by means of references and bibliography. Published work is contained in the Appen-dix.
Parts of this thesis have been published by the author:
Siamantouras, E., Hills, C.E., Younis, M.Y.G., Squires, P.E., Liu, K-K. (2014). 'Quantitative investigation of calcimimetic R568 on beta cell adhesion and mechanics using AFM single cell force spectroscopy' FEBS Letters, 588, 1178-1183.
Hills C.E., Jin T., Siamantouras E., Liu K-K., Jefferson K.P., Squires P.E. (2013). 'Special k” and a loss of cell-to-cell adhesion in proximal tubule-derived epithelial cells: modulation of the adherens junction complex by ketamine' PLos One, 8 (8), e71819–e71819.
Hills C.E., Younis M.Y.G., Bennett J., Siamantouras E., Liu K-K., Squires P.E. (2012). 'Calcium-Sensing receptor activation increases cell-cell adhesion and β-cell function' Cellular Physiology and Biochemistry 30 (3), 575 – 586.
xxi Siamantouras E., Liu K-K., Claire C.E., Squires P.E. 'Quantitative investigation of calcium-sensing receptor activation on β-cell adhesion and mechanics'. In: Diabetes UK Professional Conference, Liverpool, March 2014.
Siamantouras E., Mustafa M.Y.G., Claire C.E., Squires P.E., Liu K-K. 'New quantita-tive Study of Intricate interplay between cell adhesion and cytomechanics'. In: Inter-national Conference on Scanning Probe Microscopy on Soft and Polymeric Materi-als, Netherlands, 23-26 September 2012.
Siamantouras E., Mustafa M.Y.G., Claire C.E., Liu K-K., Squires P.E. 'Activation of the extracellular calcium-sensing receptor increases functional tethering between pancreatic beta-cells'. In: Diabetes UK Professional Conference, Glasgow, March 2012.
Claire C.E., Siamantouras E., Liu K-K., Squires P.E. 'TGFβ-modulates
xxiii AFM Atomic Force Microscopy
AJ Adherens Junction
ANOVA Analysis of Variance
BFP Biomembrane Force Probe CAM Cell Adhesion Molecules CCD Charged-Coupled Device ConA Concanavalin A
CSK Cytoskeleton
DMEM Dulbecco's Modified Eagle Medium
ds Distance of Complete Separation
E modulus Elastic modulus
E-cadherin Epithelial (E) Cadherin ECM Extracellular Matrix
EDTA Ethylenediaminetetraacetic acid EMT Epithelial-to-Mesenchymal Transition
F Force
F-d Force-displacement Curve
Fmax Maximum Unbinding Force
Fn Fibronectin
FS Force Spectoscopy
GJ Gap Junction
Hz Hertz
HK2 Human Kidney Cell Line 2
ICAM-1 Intercellular Adhesion Molecule 1
xxiv MIN6 Mouse Insulinoma Cell Line 6
MTC Magnetic Twisting Cytometry
N Newton
NI Nano-indentation OT Optical Tweezers
PBS Phosphate Buffered Saline PLL Poly-L-lysine
pN Pico-Newton
Rs Radius of Probe
RBC Red Blood Cells
RGD Arginine-Glycine-Aspartic Acid SCFS Single Cell Force Spectroscopy SD Standard Deviation
SEM Standard Error of Mean
TGF-β1 Transforming Growth Factor beta 1 TREs Tether Rupture Events
TRITC Tetramethylrhodamine UV Ultra Violet
WD Work of Detachment
α Radius of contact area
δ Indentation Depth
Chapter 1
___________________________________________________________________________
2
1. Nanomechanics in Cellular Biology
1.1 Introduction
3 matrix (ECM) interactions. Therefore, the cytoskeleton is the principal factor that de-termines the deformation behaviour of a single cell (Bao & Suresh, 2003). In addi-tion, the deformation behavior of cells and tissues is a result of integrated interaction between cytoplasmic elements such as the cytoskeleton (CSK) and the ECM. There-fore, mechanical and adhesive properties are affected simultaneously both at local and whole cell scale (Puech et al., 2006; Bao et al., 2009). Accurate determination of such complex material behaviour necessitates an understanding of the fundamen-tal deformation behaviour in the nanoscale. Hence, nanomechanical characterization is critical for materials such as soft biological cells and tissues (Haque & Saif, 2002).
1.2 General Background
4 Figure 1.1 The cell membrane forms an outer boundary of the cell and is essentially a double layer of lipid molecules that regulates the passage of substances in and out of the cell as well as its response to chemical signals such as hormones. Focal ad-hesion points are high protein concentration points on the membrane, which are as-sociated with the microfilament network in the inside and cell surface receptors or extracellular matrix on the outer side of the cell. The cytoplasm is a fluidic like media which forms a suspension for the organelles, including a network of protein filaments that maintains the shape called the cytoskeleton. Image adopted from Bao & Suresh, (2003).
5 the extracellular domain to the cytoskeleton results in an intricate interplay of the mechanical and adhesive properties of the cell, which may lead to alterations in the elastic deformation of whole cell (Puech et al., 2006). Puech et al. (2005) measured the adhesive properties of single zebrafish cells to coated substrates and concluded that extracellular binding affects intracellular signalling. In addition, Bershadsky et al. (2003) highlighted that focal adhesion points act as mechanosensors responsible for the signalling cascade within the cell. Thus, it is no doubt that cell adhesion events are important in controlling various cellular functions such as differentiation, wound healing, cancer proliferation and metastasis (Chaudhuri et al., 2009; Puech et al., 2006).
As a living unit the cell adapts continuously to its microenviroment in an attempt to maintain an overall healthy state. In fact, living cells in the human body are con-stantly subjected to mechanical stimulation throughout life. The changes of a cell in response to the environment can be of biochemical as well as biomechanical nature. The stresses and strains can arise from both the external environment and internal physiological conditions. Depending on the characteristics of the mechanical stimuli, cells will respond in a variety of ways altering their structure and consequently their functions. For example mechanical compression of chondrocytes modulates pro-teoglycan synthesis, strongly suggesting that the structure and function of many liv-ing cells depend directly on their global and local mechanical environment
apop-6 tosis. Likewise, forces generated within the cell, for example during cytokinesis, have a biological implication. Although the importance of mechanical forces in biology is not a new concept, it is currently attracting more recognition for its contributing in several emerging biomedical fields, such as molecular biology and nanobioengineer-ing (Pellnanobioengineer-ing & Horton, 2008). Recent advancements in technology allow the detection of these forces, yet we are only in the first steps of decoupling forces of specific in-terest from such a complex mechanochemical environment. Nevertheless, it is evi-dent that mechanical cues are equally important for performing major cellular tasks, such as motility, division, intracellular secretion etc, as the biochemical cues (Bao et al., 2009). In addition the cell responds to the biochemical environment by continu-ously changing its structure and morphology. Changes in deformation provide impor-tant information about the normal and diseased states of the cell (Bao & Suresh, 2003). Any changes of the resistance of the cell to elastic deformation can be meas-ured and expressed as changes in the Elastic modulus E or Young's modulus. Hence, measurements of single cell mechanical properties can form the base for a correlation between morphological/structural defects with physio/pathological states.
7 such studies. This is due to the difficulty in decoupling the response of a single cell from the response of the complete cell population, tissue or organ (Van Vliet et al., 2003). After all, the structural integrity of tissues or entire organs arises from the mechanochemical interactions between the cells and the ECM (Lim et al., 2006). Therefore, elasticity and responses of single cells to external forces, as well as ad-hesion forces between cells, have attracted tremendous attention in the modern bio-engineering research (Lulevich et al., 2006). Figure 1.2 shows an overview of Young’s modulus for different biological materials.
Figure 1.2 The Young’s (elastic) moduli of different biological materials, image adopted from Alonso & Goldmann, (2003).
8 may be useful for possible applications in clinical diagnostics or even therapy of cer-tain types of diseases (Lim et al., 2006). Puech et al (2005) measured the unbinding forces of melanoma cells (Wistar Melanoma 115) from a fibronectin coated surface using atomic force microscopy to investigate the effect of the arginine-glycine-aspartic acid (RGD) blocking agent, suggesting that chemical agents have an impact on the adhesive cell-substrate properties.
9 to the guidance and regulation of major cellular functions, including motility and dif-ferentiation (Zhu et al., 2000; Bao et al., 2009; Kam & Roy, 2010).
10 Figure 1.3 A systematic sketch of cell nano-biomechanics associated with physio-logical and pathophysio-logical processes, which are important for the future progress in nanomedicine.
[image:36.595.130.474.86.346.2]11
1.3 Mini-Review of Nanomechanical Tools
To date, there exist a variety of testing techniques and associated models in the field of experimental nanomechanics of single cells. As well described in several compre-hensive reviews in the literature (Bao & Suresh, 2003; Van Vliet et al., 2003; Lim et al., 2006; Liu, 2006), these techniques include optical tweezers (OT), and its varia-tion optical stretcher (OS), atomic force microscopy (AFM), nanoindentavaria-tion (NI), mi-cropipette aspiration (MA), magnetic tweezers (MT) and its variation magnetic twist-ing cytometry (MTC) and biomembrane force probe (BFP). Although the fundamental principal of these techniques is to measure the deformation of biological cells under an applied force, the developed instruments vary in their operating principles, cell manipulation, force and displacement maximum resolutions, and amount of defor-mation (Van Vliet et al., 2003). Figure 1.4 shows the force range of important cellular processes with respect to the range of common nanomechanical instruments, while in Figure 1.5 the schematics of common experimental techniques are represented.
12 In OT an attraction force is created between a dielectric bead of a higher refractive index than the suspending medium and a highly focused laser beam that attracts the bead towards the focal point of the trap. In a widely used version of OT, two mi-crobeads are attached to the opposite ends of a cell (Figure 1.5a). OT has been ef-fectively used for stretching, rotation and folding, as well as calculating the relaxation time of RBCs (Van Vliet et al., 2003, Zhang & Liu, 2008). Operating an AFM in force spectroscopy (AFM-FS) mode and with suitable cantilever tips, AFM can be used to indent specific points on the cell surface (Figure 1.5b) (Franz & Puech, 2008). The elastic modulus of a single cell can be calculated by fitting the indenta-tion curve with an appropriate theoretical model.
13 Kasas & Dietler (2008) have reviewed the application of AFM indentation for measur-ing the mechanical properties of numerous cell types. In MA (Figure 1.5c), a micro-pipetter is used for drawing a part of the cell into a capillary under the application of negative pressure, while the length of membrane sucked into the micropipette is re-corded optically (Bao et al., 2003). MA has been used to study elastic properties of soft cells, such as neutrophils and red cells, as well as harder cells such as teno-cytes (Hochmuth, 2000; Qi et al., 2006). BFP is a related technique in which a bead is attached to the sucked cell that serves as the soft spring of a force transducer (Figure 1.5c) (Van Vliet et al., 2003). In MTC a magnetic bead that is attached to the surface of the cell, is twisted under the influence of a magnetic field causing defor-mation of the cell (Figure 1.5d). By measuring the rotational frictional coefficient of the bead, viscoelastic properties of the cytoskeleton and cell’s surface have been examined (Bao et al., 2003; Van Vliet et al., 2003).
Despite the variation of the means by which mechanical properties are examined, the fundamental principle among them is similar, that is to determine cell deformation under an applied load. However, direct comparison of the mechanical properties of the tested samples, as determined by the different techniques, is often scarce. This is mainly due to the diversion in assumptions during experimental procedures, sam-ple preparation as well as the dependency of certain geometrical parameters of each technique, e.g. the contact area between the sample and the loading medium. Therefore, the most suitable for each individual experiment will be determined by the requirements of a situation, the type of application and the budget.
14 level. In addition by specific chemical modification of the AFM tip, the instrument can be effectively used for studying cell-to-cell/substrate adhesion. A significant advan-tage over the other methods is that it allows high resolution force measurements (~pN) over a large dynamic range (~5pN to ~100nN) for displacements up to 100μm. Therefore, it can be effectively used in cellular adhesion studies to resolve the un-binding events between single ligand-receptor interactions, while providing sufficient force and displacement ranges to ensure detection of maximum unbinding forces and complete cell-cell and cell-substrate separation (Chaudhuri et al., 2009; Frie-drichs et al., 2010). Moreover, the AFM tip can be fitted with either a sharp or spheri-cal tip, depending on the measurement of lospheri-cal or whole cell elasticity. Since a spherical probe indents a much larger area of the sample than the sharp tip does, thereby Young’s modulus of single cells can be calculated from the force-displacement curves under spherical indentation. In this report the focus will be on the application of AFM based force spectroscopy to experimentally characterise physiological and pathological phenomena of biological cells, by quantifying adhe-sion forces and elasticity of single cells.
1.4 Atomic Force Microscopy
15
1.4.1 AFM Basics
Binning et al. (1986) first developed the AFM introducing a powerful tool that could provide 3-D images of the surface topography of biological samples in both liquid and gaseous environment. Soon, AFM emerged as a powerful tool to quantify the mechanical and interfacial properties of cells and to date it is commonly used in modern bioengineering research as a high-end instrument for measuring a relatively wide range of biological forces, from pN to nN (Binning et al., 1986; Lulevich et al., 2006; Franz & Puech, 2008; Ikai, 2008; Chaudhuri et al., 2009).
16 Figure 1.6 Basic components of AFM. During force spectroscopy experiments the cantilever is stationary in x-y direction but ramped at a given position in z-direction. A laser is used to read on a diode the deflection of a very soft cantilever equipped with a sharp tip. Mechanical contact is controlled via feedback between the piezo and the photodiode (Franz & Puech, 2008; Van Vliet et al., 2003).
1.4.2 Force Spectroscopy in Biology
[image:42.595.148.461.76.329.2]17 the Hertz model, although it is valid for small indentation depths (Carl & Schillers, 2008). Kasas & Dietler (2008) have reviewed the application of AFM indentation for measuring the mechanical properties of numerous cell types, such as cardiocytes, osteoblasts, fibroblasts, erythrocytes and cochlear hair cells. However, determination of Young’s modulus absolute values is still very challenging as there is no
appropri-ate theoretical model to accurappropri-ately describe the complexity of biological samples.
Moreover, the effects of adhesion force on the tip/indenter must be taken into
count in AFM force-displacement curves. An indentation model that takes into
ac-count the effect of tip-cell adhesion force in nanoscale indentation when using
py-ramidal tips has been recently proposed (Kasas & Dietler, 2008; Sirghi et al., 2008).
Wojcikiewicz et al. (2004) studied the compliance of 3A9 clonal T-cells (10µm in di-ameter) assuming that the cell is an isotropic elastic solid and the AFM tip is a rigid cone, while Young’s modulus was calculated in accordance with a modification of the Hertz model proposed by Love and Hertz.
Furthermore, AFM is a valuable tool to measure the mechanical forces between ad-hesive cells (Kuznetsova et al., 2007). The predictive, diagnostic and therapeutic role of adhesion molecules, such as CAMs, in cardiovascular (Jaitovich & Etcheverry, 2004) and Alzheimer's disease (Wennstrom & Nielsen, 2012) has been addressed. Chaudhuri et al (2009) studied leukocyte to endothelial cell adhesion using AFM combined with side-view fluorescent imaging, which performs in-situ imaging of cel-lular deformation on the loading axis. The major advantage of AFM lies in its capaci-ty that it allows studying the mechanical properties of biological materials under both
18 and force resolutions. This made possible by introducing an optical deflection system and a fluid cell chamber into the AFM instrumentation (Franz & Puech, 2008).
1.4.3 Application of AFM on Single Cell Elasticity
19 the E values were also underlined in the study. One such issue is the chemical im-mobilisation of the substrate, since firm contact between cells and substrate is re-quired. However, chemical changes in the environment affect the mechanical proper-ties of living cells. A method to overcome this difficulty, by providing mechanical im-mobilisation by placing the cells into microwells, was suggested by Rosenbluth et al. (2006). In this study the deformability of lymphoid leukemia cells was investigated. To test the effect of deformation rate during experiments, commercial pyramidal AFM tips and an indenter fitted with a 10μm diameter spherical bead were used at various piezo extension rates. The size of the cells was significantly smaller from the mi-crowells, to avoid constrains by the walls during mechanical testing. The data were analysed using Hertz and liquid droplet models to investigate which model describes best the sample cell lines. The results showed that the Hertz model fit the data sig-nificantly better than the liquid droplet model at low deformation rates when testing leukemia cells.
20 were performed by using a standard unmodified pyramidal cantilever (0.05N/m), and by using the same cantilever modified with a spherical tip. The results suggested that measurements with the spherical tipped cantilever characterised the elasticity more correctly than measurements with pyramidal tipped cantilevers that provided an overestimation of the measured elasticity. Given such drawbacks in the determina-tion of single cell elasticity, A-Hassan et al. (1998) discussed whether absolute val-ues of elastic modulus can be acquired by AFM indentation experiments. They have examined epithelial madine-darby canine kidney (MDCK) cells cultured in monolay-ers, addressed the issues of tip-sample contact point and geometry, and suggested an approach for analyses of AFM force displacement (F-d) curves to overcome these experimental uncertainties. Essentially, they performed F-d curves across a single cell and calculated relative variations of E, by assuming a relationship between the indentation work for a predetermined indentation force and the elastic constants along the indentation points (force integration to equal limits). In addition, the ability of AFM to generate reproducible F-d the curves at scan rated <25μm/s, as long as the measurements are performed at the same position of the cell, was demon-strated. Besides, scanning of the surface of a cell using the AFM either in contact or tapping mode provides information about local surface elasticity at each point of con-tact. The differences of cantilever oscillation can produce a map of the relative E of cell surface.
Another major challenge in the mechanical characterisation of soft biological cells is
the fitting of the acquired data to an appropriate mathematical model (Kasas &
meth-21 ods. Although that the values for control and sheared cell calculated by finite element modelling were higher in comparison to Hertz fitting, the tendency of the E modulus between control and sheared cells was the same. More importantly, this shows that
E modulus can be used as a relative indicator/parameter in comparison experiments and since AFM measurements can be performed in near physiological conditions, this tool is useful to study a variety of biological phenomena including physiological versus pathological conditions of cells.
22 modulus is smaller at a higher temperature. The authors concluded that both loading rates and temperature need to be considered when performing mechanical tests of single cells using AFM. Cross et al. (2007) studied the stiffness variations of metas-tatic lung cancer cells, obtained from pleural effusions of patients with metasmetas-tatic ademocarcinoma, using AFM. Measurements were performed at 27ºC using a con-stant speed. The results suggested that metastatic cancer cells were 70% softer than normal cells, when compared to other pleural effusions from patients with dif-ferent clinical histories.
Rotsch et al. (2000) investigated the importance of actin network for the mechanical stability of living cells by using drugs (Cytochalasin B and D, Latrunculin A) to dis-semble the structure of the cell. During drug action, AFM-based elasticity measure-ments were performed by recording time series of force maps on the cells and the force-displacement curve data were analysed off-line. The results proved that disag-gregation of F-actin resulted in a loss of cell rigidity but treatment with drugs that im-pacted microtubules had no effect on elasticity. Finally, the authors concluded that the actin network is primarily responsible for the elastic properties of living cells.
23 on the mechanical model for E determination and should be carefully defined before the experiments or during analysis of F-d curves. In addition, changes in elasticity indicate CSK reorganisation, a phenomena that plays a significant role in cell signal-ling, cell-to-cell adhesion and various cell processes such as motility, division and mitosis.
1.4.4 Application of AFM on cellular adhesion
AFM-FS was primarily used as an assay to quantify the molecular forces between single isolated receptor - ligand binding (Friedrichs et al., 2010). However, since the functions of surface receptors in isolation were different from their in vivo equivalent, AFM was applied as a single cell force spectroscopy (SCFS) tool to quantify surface ligation between living cells. AFM-SCFS allows different experimental set-ups, most commonly including
(a) Adhesion of a tipless-, bead-coated cantilever to an immobilised substrate cell,
(b) Adhesion of a cantilever-attached cell to a coated surface, and
(c) Adhesion of a cantilever-attached cell to an immobilised substrate cell.
24 study suggested that the chemical wearing out of the cantilever was minimised for contact forces less than 40pN. Another major drawback of this method is the spread-ing of receptor or ligand of interest across the surface of the cantilever, affectspread-ing strongly the local ligand-receptor binding density and can lead to data scattering over time (Friedrichs et al., 2013).
25 Type (c) configuration, which is considered a special application of (b) (Friedrichs et al., 2013), was the most challenging set-up in terms of sample preparation and ex-perimental procedure. However, since the adhesion molecules are functioning in situ, this method is considered as the most promising method to generate results in near physiological conditions. In addition, since the local geometry of both contact surfaces is of the same nature, differences in spread area between the cantilever-attached system and substrate-cell are eliminated. Nevertheless, continuous obser-vation of the morphology of the cantilever-attached cell is required. A drawback of this configuration is the procedure for immobilisation of a cell to the cantilever, since suspended cells tend to stick to the substrate cells than the cantilever. To overcome this difficulty, parts of the substrate can be coated with trypsin, an enzyme used for harvesting of cells. Furthermore, although single cell-to-cell adhesion measurements provide information about receptor-ligand interactions in their natural environment, this type of set-up has the disadvantage of being time consuming since only one in-dividual substrate cell can be characterised at each time. In addition, long cell-to-cell contact times should be avoided (<20mins), due to the thermal drift of the AFM (Friedrichs et al., 2010).
epithe-26 lial cells of the proximal tubule human kidney cell line (HK2). Localisation and distri-bution of E-cadherin was assessed by analytical techniques prior to SCFS experi-ments. A single suspended cell was attached to the end of a tipless cantilever using poly-l-lysine (25μg/ml) and fibronectin (20μg/ml) and subsequently brought into con-tact with a substrate cell using consistent values for concon-tact force and time (1nN, 10sces) throughout the experimental series. Changes in whole cell morphology and CSK re-organisation indicated the interplay between adhesion and mechanics.
27
1.5 Diabetes Mellitus
This section covers the essentials of pancreatic physiology and provides a basic background of physiological versus pathological conditions of diabetes and diabetic nephropathy. The biological context for the research questions associated with the secretion function of β-cells and the fibrotic changes of renal proximal tubule in chronic kidney disease is also covered.
1.5.1 Pathophysiology of the Endocrine Pancreas
28 Figure 1.7 A microscopic section of normal pancreas. Lighter staining cells, compare to exocrine tissue, in the centre are identified as the 'islet of Langerhans'(original magnification x350). Image from Bilous & Donelly (2010).
The metabolism and other energy-requiring processes of the cells are basically rely-ing on receivrely-ing a continuous supply of carbohydrates, such as glucose, which will get oxidised (burned) inside the cell (Pocock & Richards, 2009; Cohen & Wood, 2000). Therefore, it is essential that the amount of glucose in liquid blood (plasma glucose), is maintained within the normal range (4-8 mmol/l). Hormones produced by the pancreas, such as insulin and glucagon, provide minute-to-minute regulation of glucose requirements. However, insulin is essentially the only hormone that acts to reduce the concentration of blood glucose (Pocock & Richards, 2009). As anticipated insulin impairment inevitably leads to elevated glucose concentrations in the blood-stream (hyperglycamia) and sugar excretion in the urine (glycosuria) (Cohen & Wood, 2000; Bilous & Donelly, 2010).
29 Donelly, 2010). Based on the aetiology of diabetes can be classified into two major categories: Type 1 diabetes, also called insulin dependent, is characterised by β cell destruction resulting in complete insulin deficiency, and Type 2 diabetes, or non-insulin dependent, in which reduced secretion and loss of non-insulin sensitivity/response is observed (Zimmet et al., 2001; Pocock & Richards, 2009; Bilous & Donnelly, 2010).
Type 1 is less common (5-10% of diabetic population), but it is considered to be more severe (Cohen & Wood, 2000; Shaw et al., 2010; Zhang et al., 2010). Type 1 diabetes can be classified into two main types: 1a or autoimmune and 1b or idio-pathic (Bilous & Donnelly, 2010). The islet fails to secrete normal amounts of insulin because of the progressive destruction of the β cells by autoreactive T cells (Yoon & Jun, 2005). It occurs by the age of 30-40 years old (Pocock & Richards, 2009; Cohen & Wood, 2000) and especially in children (Scanlon & Sanders, 2002), while the onset of the disease is connected to genetic predisposition (Castano & Eisen-barth, 1990).
20-30 40%, a >80% reduction in insulin is observed (Bilous & Donnelly, 2010). Additional functional defects such as decreased communication via surface ligation should be investigated.
1.5.2 Historical Background & Implications
Even though diabetes was ignored in Europe in the past, Thomas Willis, an English physician, noted the effects of diabetes in the urine in the 17th century. Later on, in 1889, Minkowski and Mering from Strasbourg connected the cause of this disorder with pancreas, by removing the organ from a dog. The description of a pancreas as small clusters of cells was completed by Paul Langerhans in Berlin. The function of the cells was still unknown until Edouard Laguesse in France (1893) suggested that the islet cells were endocrine tissue of the pancreas that produced an hormone for glucose regulation and called the cells 'islets of Langerhans'. Insulin was discovered by Banting and Best in 1921 at University of Toronto. This discovery led immediately on the treatment of the first diabetic patient in 1922 by extracting and purifying insulin from pancreas. Today, human insulin can be produced by modern genetic engineer-ing techniques and drugs that stimulate both insulin secretion and sensitivity are be-ing developed. Indeed, there is intensive interest in convertbe-ing research into thera-pies for diabetes mainly due to the serious implications of the disease (Luft, 1989; Bilous & Donnelly, 2010).
31 concern with serious socioeconomical consequences. Mortality caused by ketoaci-dosis and coma due to absolute deficiency of insulin is high in UK and other devel-oped countries. Long-term micro-vascular implications include diabetic retinopathy, diabetic nephropathy and dry gangrene. Diabetes is the most common cause of blindness in those of working age and the most common single cause of end-stage renal failure worldwide (Scanlon & Sanders, 2002; Bilous & Donnelly, 2010).
At the moment diagnosis of diabetes is accomplished by detecting chronic hypergly-caemia. However, new methods for early diagnosis are absolutely necessary since approximately 20% of new patients with type 2 diabetes have already presented vascular implications. This means that the exact onset of the disease occurred al-most 5-6 years before the serious implications of the disease have started to develop (Bilous & Donnelly, 2010). Cardiovascular complications due to uninhibited glucose fluctuations may increase 3 to 8 fold (Norhammar et al., 2002). Such important clini-cal problems necessitate the development of novel therapies for the treatment of disease and/or prevention of its implications.
1.5.3 Physiological Secretory Function & Islet Architecture
32 Insulin is responsible for the transport of glucose through the plasma membranes inside the cell in order to be metabolised for energy. The rate at which excess glu-cose is changed into fatty acids by the liver can also be increased by insulin. By per-forming these actions, as well as by promoting the use of glucose for energy produc-tion in the bloodstream, insulin manages to reduce the concentraproduc-tion of sugar in the blood. In addition, by increasing the uptake of amino acids into cells and by convert-ing them into proteins, insulin contributes to the metabolic function of the cell (Cohen & Wood, 2000).
Adjacent β cells are coupled by gap junctions that allow the direct passage of mole-cules and electrical currents. Gap junctions are formed by transmembrane proteins and are important in cell-to-cell communication pathways for the coordination of insu-lin secretion in the pancreatic islet (Benninger et al., 2011). Since cell-to-cell adhe-sion leads the formation of gap junctions, enhanced cellular adheadhe-sion may improve cell communication and secretion responsiveness within the islet.
33 adjacent cells apart from causing considerable reduction in insulin secretion (Rogers et al., 2007). Alteration of the pseudoislet architecture was substantial and was ac-companied by a loss of the adhesive properties as indicated by the attenuation of dye transfer between adjacent cells. Their results suggested that there is a strong functional consequence in regulating intercellular communication via gap-junctions following neutralisation of E-cadherin. Thus, it may be implied that E-cadherin medi-ated cell adhesion has important repercussions for the islet function in terms of glu-cose responsiveness and insulin secretion. It is therefore important to develop an experimental protocol to determine quantitatively the changes in adhesion forces be-tween β cell-to-cell adhesion and elucidate if an increase in E-cadherin improves the function of the islet by enhancing cell-to-cell communication.
It is well reported that the higher glucose-evoked insulin secretion of mouse insuli-noma MIN6 cells when organised as pseudoislets, is mediated by enhanced cell-to-cell interactions and/or elevated expression of gap-junction proteins, such as E-cadherin (Hauge-Evans et al., 1999; Calabrese et al., 2003; Brereton et al., 2006; Kelly et al., 2010). An appropriate model that resembles function of β islet cells along with a switch to increase E-cadherin expression were identified for the purpose of this study.
1.5.4 The MIN6 Model Islet
interac-34 tions occur. In contrast, a well established cell line for resolving mechanisms of glu-cose-evoked insulin secretion characteristics, such as the mouse insulinoma cell line (MIN6) (Ishihara et al., 1993), offer a continuous supply of unlimited growth homoge-neous sample material. In addition, cell lines offer an animal-free opportunity for ex-perimental manipulation without ethical concerns and therefore have the added vantage of being subjected to pathophysiological treatment. Moreover, the major ad-vantage of using a clonal cell line is the ability to control the consistency and repro-ducibility of experiments (Skelin et al., 2010). However, special cell culturing skills are required to guarantee the proper preservation of the cell line structure and func-tion. In fact, the disadvantage of being amenable to changes of their characteristics is derived from their own ability to grow continuously (Skelin et al., 2010).
Although MIN6 cells morphologically resemble primary islets, they do show differ-ences in the insulin secretion response when compared to primary β cell. Kelly et al. (2010) reported enhanced response to glucose when treated as pseudoislets. In ad-dition, the glucose-evoked secretory response of MIN6 cells is higher when they are cultured as pseudoislets rather than monolayers in a culturing substrate (Hauge-Evans et al., 1999). In this project MIN6 cells were cultured in monolayers due to the experimental requirements of AFM-SCFS.
1.5.5 The Extracellular Calcium-Sensing Receptor (CaSR)
appro-35 priate counter-regulatory responses into a neighbouring cell to regain Ca2+ -homeostasis (normocalcaemia). This is accomplished by regulating the secretion of parathyroid hormone and urinary calcium concentration (Brown, 2007). Since CaSR is directly involved with the propagation of signals, the receptor has an significant function in cell-to-cell coupling and communication.
36 The role of CaSR in improving function of β islet cells by synchronisation of insulin release within the islet is achieved through enhanced cell-to-cell communication (Hauge-Evans et al., 1999; Jones et al., 2007; Kitsou-Mylona et al., 2008; Hills et al., 2012b). It is firmly established that CaSR is expressed in pancreatic β cells where it is thought to improve the functional responsiveness of the β cells, by enhancing cell-to-cell communication, and promote insulin secretion. In a study using MIN6 cells, Rogers et al. (2007) suggested that apart from playing an important role in the for-mation of pseudoislets, E-cadherin facilitates their function by increasing gap junc-tion communicajunc-tion. These data imply that E-cadherin mediated cell adhesion has important repercussions for the islet function in terms of glucose responsiveness and insulin secretion. However, the association between cell-to-cell communication and cell-cell contact or adhesion remained unclear (Hills et al., 2012b). The functional mechanism underlying intercellular communication between β cells through E-cadherin upon CaSR activation has been investigated in this research project.
1.5.6 CaSR Activation
37 Although various ligands activate CaSR, the Ca2+ remains the main agonist of the receptor (Brown & MacLeod, 2001). Activation of the receptor using a phenylal-kylamine agonist (calcimimetic) is accomplished by increasing the affinity of its ligands for Ca2+, having the advantage of avoiding the high number of non-specific events (Hills et al., 2012b). Activation of CaSR using calcimimetics was reviewed by Trivedi et al. (2008), while the enhanced insulin secretion functions was suggested by Gray et al. (2006). Direct measurements of extracellular spaces surrounding β cells using Ca2+-sensitive microelectrodes (Gerbino et al., 2012), support the con-cept that local 'hot spots' of extracellular Ca2+ activate the CaSR on neighbouring cells (Hills et al., 2012b). In addition, calcimimetics were used to increase the secre-tory response of glucose up to a maximum level in pancreatic of rats (Straub et al., 2000). The use of calcimimetics for CaSR activation in the pancreas results in a transient increase of insulin secretion without the need for stimulation by certain glu-cose concentration. The fact that insulin release is rising in the absence of pre-stimulus activation by glucose, highlights that CaSR may has a key role in the secre-tory function of primary β cell islets (Gray et al., 2006).
1.6 Diabetic Nephropathy
38 Diabetic nephropathy (DN) accounts for approximately 50% of those patients pre-senting an end stage renal failure and is the most common cause of entry into the renal replacement therapy programme. While multiple structural and functional changes are associated with DN, it is as well characterised by an accumulation of ECM in both the glomerular mesangium and tubular interstitium. Continuous accu-mulation of excessive fibrotic deposition, eventually leads to a reduced function of renal excretion. Renal fibrosis can be identified by the activation of phenotypical transformations. The phenotypical fibrotic change of tubulointerstitial fibrosis is the crucial pathology underlying progressive chronic kidney disease in diabetes. Central to this process is epithelial-to-mesenchymal transition (EMT) or the trans-differentiation of tubular epithelial cells into myofibroblasts (Hills et al., 2012a). Un-derstanding early signals that control deposition of fibrotic material in the interstitium is essential for the development of therapies that could alleviate the malignant trans-formation of epithelial cells to fibroblasts.