University of Warwick institutional repository: http://go.warwick.ac.uk/wrap
A Thesis Submitted for the Degree of PhD at the University of Warwick
http://go.warwick.ac.uk/wrap/73865
This thesis is made available online and is protected by original copyright. Please scroll down to view the document itself.
Methods for Crystal Growth
and Dissolution Processes
Amelia Ruth Perry
Thesis submitted for the degree of
Doctor of Philosophy
Electrochemistry and Interfaces Group, Department of Chemistry,
University of Warwick.
0.1 Acronyms . . . xiii
0.2 Glossary of Symbols . . . xv
1 Introduction 1 1.1 Abstract . . . 1
1.2 Crystals . . . 2
1.2.1 Applications of Crystal Nucleation, Growth and Dissolution . 2 1.2.2 Theory and Background . . . 5
1.3 Applications of Crystal Growth in this Thesis . . . 13
1.3.1 Pharmaceutical Crystals . . . 13
1.3.2 Barite Scale . . . 21
1.4 Mass Transport and Surface Kinetics . . . 23
1.4.1 Bulk Crystal Growth Studies . . . 25
1.4.2 Micro-crystals . . . 27
1.5 Electrochemistry . . . 29
1.5.1 Electron Transfer at an Electrode Surface . . . 29
1.5.2 Ultramicroelectrodes (UMEs) . . . 31
1.5.3 Scanning Electrochemical Microscopy . . . 33
1.5.4 Nanopipettes . . . 37
1.6 Additional Microscopy Techniques . . . 38
1.6.1 Optical Microscopy . . . 38
1.6.2 Interferometry . . . 42
1.6.3 Atomic Force Microscopy . . . 43
1.7 Modelling . . . 49
1.8 Thesis Aims . . . 50
2 Experimental Methods 53 2.1 Chemicals . . . 53
2.2 Materials . . . 53
2.3 Electrodes . . . 54
2.3.1 UME fabrication and characterisation . . . 54
2.3.2 Nanoprecipitation experiments . . . 57
2.4 Sample Preparation . . . 57
2.4.1 Functionalisation of Glass . . . 57
2.4.2 Crystal Seeding . . . 59
2.5 Instrumentation . . . 59
2.5.1 Optical Microscopes . . . 60
2.5.2 Atomic Force Microscopy . . . 60
2.5.3 Interferometry . . . 62
2.5.4 X-ray di↵raction . . . 62
2.5.6 Flow Cells . . . 66
2.6 Software . . . 68
2.6.1 Finite Element Method Simulations . . . 68
2.6.2 Image Processing . . . 70
3 Plane-Resolved Kinetics of Salicylic Acid Crystals 74 3.1 Abstract . . . 74
3.2 Introduction . . . 75
3.3 Experimental . . . 79
3.3.1 Solutions and Samples . . . 79
3.3.2 Crystal Growth Investigations . . . 80
3.4 Simulations and Modelling . . . 82
3.5 Results and discussion . . . 87
3.5.1 Characterisation of Salicylic Acid Micro-crystals . . . 87
3.5.2 Determination ofin situCrystal Growth Rates and Interfacial Concentrations . . . 87
3.5.3 Hollow Features in Crystals . . . 97
3.6 Conclusions . . . 103
4 Scanning Electrochemical Microscopy of the Dissolution of Salicylic Acid Micro-Crystals 105 4.1 Abstract . . . 105
4.2 Introduction . . . 106
4.3 Experimental . . . 110
4.3.1 Solutions, samples and electrodes . . . 110
4.3.3 Imaging . . . 113
4.4 Simulations and Modelling . . . 114
4.4.1 Equilibria Involved in Crystal Dissolution . . . 114
4.4.2 Finite Element Method . . . 116
4.5 Results and discussion . . . 119
4.6 Conclusions . . . 127
5 Nucleation of Barite on Foreign Surfaces at High Supersaturations128 5.1 Introduction . . . 130
5.2 Experimental Methods . . . 134
5.2.1 Material and Substrate Preparation . . . 134
5.2.2 Optical Visualisation Using a Flow Cell . . . 134
5.2.3 Observation of Crystal Volume distribution using atomic force microscopy (AFM) . . . 136
5.3 FEM simulations . . . 137
5.4 Results and Discussion . . . 141
5.4.1 Time Lapse Videos . . . 141
5.4.2 AFM Analysis . . . 144
5.4.3 Results of FEM Model . . . 148
5.4.4 Discussion of crystal orientation . . . 150
5.5 Conclusion . . . 150
6 Nanoprecipitation of Barite using Ion Conductance 152 6.1 Introduction . . . 153
6.2 Experimental . . . 156
6.2.2 Nanopipettes . . . 157
6.2.3 Instrumentation . . . 157
6.2.4 Current Measurements . . . 159
6.3 Results and Discussion . . . 160
6.3.1 Varying the negative potential . . . 161
6.3.2 Transients with inhibitors . . . 163
6.3.3 Two stages of the crystal nucleation . . . 169
6.4 Conclusion . . . 172
1.1 Free Energy Diagram for nucleation . . . 7
1.2 Illustration of classical nucleation theory compared to a two-step nu-cleation process . . . 8
1.3 Illustration of a growth unit combining with a crystal lattice via the KSV mechanism . . . 10
1.4 Diagram showing how a screw dislocation can form a mismatch in planes . . . 11
1.5 Illustration of the birth and spread model of crystal growth . . . 12
1.6 Energy diagram showing the energy change for a typical crystal sys-tem with stable and metastable polymorphs from nucleation from solvent . . . 15
1.7 The crystal structure of the unit cell of salicylic acid crystals . . . 19
1.8 The crystal structure of the unit cell of barite . . . 22
1.9 Schematic showing the inner and outer Helmholtz planes for the area close to an electrode surface. . . 26
1.10 Diagram showing the di↵usion fields observed for (a) a macro crystal with some planar di↵usion and (b) a micro-crystal with a hemispher-ical di↵usion field . . . 28 1.11 Processes which occur close to the surface of an electrode. . . 29
1.12 Energy level diagram showing metals with di↵erent applied potentials 30
1.13 Illustration of a UME. . . 31
1.14 Graph showing the normalized current for the cases of positive and negative feedback in SECM. . . 34
1.15 Diagram showing the di↵erence between scanning at a constant height and a constant distance. . . 36
1.16 The topography, the UME path followed using IC and the current measured for (a) a uniformly active surface with topographical fea-tures and (b) a flat surface with electrochemically active regions. . . . 37
1.17 Schematic showing the set up for SICM. . . 38
1.18 Diagram showing how light is transmitted through an optical micro-scope . . . 39
1.19 The di↵raction patterns produced when light passes through an aper-ture. . . 41
1.20 Diagram showing a typical interferometer, used to profile surfaces. . . 42
1.21 Diagram showing a typical set up for an AFM . . . 44
1.22 Plot showing the Lennard-Jones potential including the parameters and ✏. . . 47
1.23 Force curves from an AFM . . . 48
2.1 Diagram showing how glass surfaces were functionalised with PLL and then PGA . . . 58
2.2 Figure showing typical trace and retraces for a line scan in an AFM image. . . 61
2.3 Plot showing the results of XRD of a sample of salicylic acid crystals seeded on PLL on glass. . . 63
2.4 Schematic showing the set-up for IC-SECM. . . 64
2.5 Schematic showing a hopping mode scan. . . 65
2.7 Plots showing a typical mesh inside a FEM geometry, and a concen-tration plot. . . 69
2.8 Grey-scale images showing the e↵ect of changing the rolling ball ra-dius when performing a background subtraction. . . 70
2.9 Grey-scale image and histograms for images with and without con-trast enhancement. . . 71
2.10 Binary images showing the results of particle analysis by image pro-cessing. . . 72
3.1 Morphology of the salicylic acid crystals and the crystal structure for each important face. . . 80
3.2 Time sequences for crystals during dissolution and growth experi-ments, taken by optical microscopy. . . 81
3.3 FEM of a typical salicylic acid crystal during growth and dissolution. 83
3.4 Plots showing the change in size of the two crystals in Figure 3.2 over time, where the (001) face is represented by red and the ((¯110) face is represented by blue. . . 88
3.5 Plots showing how the flux per unit area into the crystal faces varies for change in bulk concentration. . . 91
3.6 Examples of results of FEM simulations for dissolution and growth. . 93
3.7 Plots showing the variation of concentration from the centre of each face. . . 94
3.8 Optical microscopy and VSI images showing hollow features in crystals. 98
3.9 Plot showing the crystal growth on both sides of a crystal, on which one side a large hollow feature appears. . . 99
3.10 Cartoon showing the possible mechanism of production of hollow fea-tures in crystals. . . 101
4.1 A schematic describing the experimental method and reactions oc-curring for HIC-SECM on the (110) face of salicylic acid. . . 108
4.3 CV showing the reduction of protons at the surface of a UME. . . 112
4.4 The geometry of the FEM model used to simulate approach curves at various values of dissolution rate. . . 116
4.5 A representation of two typical 20⇥ 20⇥ ⇡5 m scans of a salicylic acid crystals. . . 119
4.6 The topography of crystal 1. . . 120
4.7 The current measured in bulk solution during the period of a HIC-SECM scan. . . 122
4.8 Histograms showing the spread of calculated kdis values. . . 123
4.9 The predicted morphology of the crystal and the orientation of sali-cylic acid molecules with respect to the (110) face. . . 126
5.1 Set up for flow cell experiments, including the design of the flow cell. 135
5.2 Figure showing the results of a 2D axisymmetric FEM model of mass transport in the flow cell used for barite nucleation and growth. . . . 137
5.3 A selection of time lapse images for the flow cell experiments shown over 45 minutes for a concentration of barium sulphate of 0.2 mM. . . 141
5.4 Results of particle analysis of time lapse images from flow cell exper-iments . . . 143
5.5 Peak force tapping AFM images showing typical areas of the samples for flow cell experiments of 15, 30 and 45 minute runs for a concen-tration of 0.2 mM. . . 145
5.6 The average unit volume per unit area for AFM samples from flow cell experiments. . . 145
5.7 The molar volume of material deposited on the surface during a flow cell experiment over time. . . 146
5.8 AFM image showing the morphology of a single micro-crystals seeded on PGA . . . 149
6.2 Transient observed when the quasi-reference counter electrode (QRCE) potential is flipped from a positive potential to a negative one to in-duce nanoprecipitation, for di↵erent biases. . . 162 6.3 Plot showing the current transient observed for di↵erent inhibitor
concentrations. . . 164
6.4 Molecular structures of NTMP and HDTMP. . . 167
6.5 Plot showing the time for complete blocking of a nanopipette when di↵erent concentrations of inhibitor are added to the bulk solution containing barium ions. . . 168
2.1 List of Chemicals . . . 54
2.2 List of Materials . . . 55
2.3 Typical settings used for AFM images which characterise barite par-ticles on a glass slide. . . 62
6.1 pKa values of phosphonate inhibitors . . . 166
WORK
This thesis is submitted to the University of Warwick in support of my application for the degree of Doctor of Philosophy. It has been composed by myself and has not been submitted in any previous application for any degree.
The work presented (including data generated and data analysis) was carried out by the author except in the cases outlined below:
UME fabrication, detailed in Section 2.3.1, was done by Robert Lazenby.
Figure 4.9 was produced with the help of Maria Adobes-Vidal.
Some flow cell experiments were performed by Hannah Colledge.
Experiments detailed in Chapter 6 were performed alongside David Perry.
Parts of this thesis have been published by the author:
Perry, Amelia R., Massimo Peru↵o, and Patrick R. Unwin. ‘Quantitative plane-resolved crystal growth and dissolution kinetics by coupling in situ optical mi-croscopy and di↵usion models: the case of salicylic acid in aqueous solution’Crystal Growth & Design 13(2) 2013 614-622.
Amelia R. Perry, Robert A. Lazenby, Massimo Peru↵o, Kim McKelvey, Micheal E. Snowden and Patrick R. Unwin. ‘Hopping Intermittent Contact-Scanning Electro-chemical Microscopy (HIC-SECM) to Investigate Dissolution Kinetics of Salicylic Acid Crystals in Aqueous Solution’ submitted to Crystal Engineering Communica-tions.
0.1
Acronyms
AFM atomic force microscopy
API active pharmaceutical ingredient
BCF Burton Cabrerra Frank
Theory about crystal growth describing how screw dislocations can emerge on a crystal surface from a defect.
CNT classical nucleation theory
FEM finite element method
HDTMP hexamethylenediamine tetra(methylene phosphonic acid)
HIC hopping intermittent contact
IC intermittent contact
KSV Kossel, Stranski and Volmer
Theory describing the crystal surface as a series of terrace surfaces, ledges and kinks
NTMP nitrilotris(methylene)triphosphonic acid
PDE partial di↵erential equation
PGA poly-L-glutamic acid
PLL poly-L-lysine
QCM quartz crystal microbalance
QRCE quasi-reference counter electrode
RDE rotating disk electrode
SCE saturated calomel electrode
SAM self assembled monolayer
SECM scanning electrochemical microscopy
SICM scanning ion conductance microscopy
SPM scanning Probe Microscopy
STM scanning tunnelling microscopy
UME ultramicroelectrode
VSI vertical scanning interferometry
0.2
Glossary of Symbols
aj activity of species j
a UME radius
c concentration
d tip-substrate separation
dsp spacing of planes in a crystal lattice
D di↵usion coefficient E potential
E standard electrode potential F Faraday’s constant
Fc force
G Gibbs free energy
i current
I normalised current J interfacial flux
Ka acid dissociation constant
kdis dissolution rate constant
kB Boltzmann’s constant
kb backward reaction rate constant
kf forward reaction rate constant
ksc spring constant
Ksp solubility constant
m mass
n number of electrons transferred NA numerical aperture
nint integer number
nr refractive index
n unit normal vector p pressure
pKa logarithmic acid dissociation constant
r particle radius R ideal gas constant RG RG value of electrode S supersaturation ratio T absolute temperature u fluid velocity
v velocity field V potential energy z charge on species
↵ electron transfer coefficient
✓ angle
wavelength
µ dynamic viscosity
⇢ density
The aim of this thesis was to investigate crystal nucleation, growth and dissolu-tion processes, focussing particularly on the behaviour of the crystal surface. To facilitate this various methods of microscopy were used, as well as electrochemical techniques, with the goal to separate mass transport towards the crystal surface and the processes which occur close to the crystal surface, and measure intrinsic growth/dissolution rates.
In order to do this, crystal systems were screened for their relevance to applications in industrial processes, and those chosen were related to pharmaceutical crystalliza-tion and scale formacrystalliza-tion in o↵ shore oil wells. For each system, di↵erent methods of electrochemical measurement and microscopy were investigated to chose a technique which works best for the problem in hand. Further to the experimental data pro-duced, these were supported by mass transfer models, with the aim of finding out more quantitative information about the surface behaviour of the crystal systems observed.
Firstly, salicylic acid micro-crystals were observed in aqueous solution by optical microscopy to visualise growth/dissolution rates of individual faces. It was found from finite element method (FEM) simulations that the most active (001) face was strongly mass transport controlled, and that the (110) and (¯110) were closer to the surface controlled regime. Salicylic acid crystals were further analysed by scanning electrochemical microscopy (SECM) using 3 dimensional (3D) scans containing a series of approaches to the surface. By inducing dissolution on the crystal surface, and measuring a change in ultramicroelectrode (UME) current, the dissolution rate constant of the (110) face of salicylic acid was determined for this heterogeneous surface.
Barite nucleation and growth was observed by optical microscopy, using a flow cell
INTRODUCTION
1.1
Abstract
This thesis is concerned with crystal growth and dissolution using methods of
imag-ing and microscopy to focus on the surface and interfacial properties of crystals. In
particular, we aim to investigate the e↵ect of mass transport and surface kinetics of
all systems studied, which were selected due to their applications to pharmaceutical
production, as well as tackling issues encountered as a result of scaling in o↵-shore oil
rigs. Various methods of microscopy will be introduced and the strengths, as well of
the shortcomings of each technique will be assessed based on the data obtained.
Or-ganic salicylic acid single crystals are analysed during growth and dissolution by
op-tical microscopy to observe their mass transport behaviour, and the surface kinetics
are further probed using scanning electrochemical microscopy (SECM). The
nucle-ation process of barite is observed using hydrodynamic flow and optical microscopy,
and then by following precipitation in a nanopipette using ion conductance.
This chapter covers the principles behind crystal nucleation, growth and dissolution
and outlines the theoretical background of the experimental techniques utilized in
this thesis.
1.2
Crystals
1.2.1
Applications of Crystal Nucleation, Growth and
Dis-solution
The formation of crystals from solution is a topic which has interested scientists for
generations, but it is surprisingly relatively poorly understood considering this. It
would be of great benefit to many industries to gain a better understanding of the
growth and dissolution of crystalline material in order to control nucleation, size
and morphology of crystals [1], which impacts on other properties; from availability
to strength, for example.
Many biological processes utilize the formation of solid particles, sometimes in an
amorphous state [2, 3], but often a degree of crystallinity is necessary in order for
and teeth requires hydroxyapaptite rods [8, 7] to form within an organic matrix to
produce a material which can undergo stress and strain readily. The shells of many
molluscs are formed from similar matrices containing calcite [9,10,11,12], the most
stable form of calcium carbonate [13, 14]. By replicating and understanding the
behaviour of these materials in a laboratory settings, we would be a step closer
to being able to protect these structures for environmental or personal health. It
is also vital to investigate how to inhibit or enhance growth of materials such as
hydroxyapatite [15, 16, 17] and calcite [18, 19, 20, 21]. There is also research into
crystal growth and dissolution processes of organic materials which occur naturally
in biological systems [22, 23, 24]. For example, the investigation of uric acid which
contributes towards the problem of kidney stones [25].
In the construction industry the building materials used often contain crystalline
materials [26,27, 28] (in cement or plasterboard, for example) and it is essential to
be able to predict possible dissolution processes of these crystals in order to predict
how they may weather under various environmental conditions, and if it is possible
to slow down these undesirable e↵ects [29]. For example, there has been much
research into the dissolution of gypsum [30], the main crystalline form of hydrated
calcium sulphate. Gypsum is often used, along with its derivatives, as an additive
to cement, giving the material strength and allowing it to set quickly.
The oil well business, as well as construction industries are also very interested in
scaling may occur. There is a common problem in oil wells where various kinds of
scale appear [31, 32, 33, 34]. For example, gypsum [35], as well as calcite [36, 37],
is observed along with other sulphates such as barite and strontium sulphate, and
there is great interest in controlling this process by altering the surface e↵ects and
the additives present. The problem of barite scale is of particular interest in this
thesis and will therefore be discussed later in more detail.
In the fine chemical industries, in particular for the production of food or
phar-maceuticals [38, 39, 40, 41] it is necessary to produce crystals built from organic
materials [42,43]. The case of the pharmaceutical industry is analysed in particular
in the current study, due to the fact that the pharmaceutical industry contributes
to a huge amount of research and development of medicine in the developed world.
Oral administration is the safest, cheapest and easiest method of drug delivery, and
is therefore also the most popular. In order to control the production of these
ma-terials, and to deliver an e↵ective drug dose, it is imperative that the growth and
dissolution behaviour and kinetics are well understood. This area is also of great
interest to this thesis and will also be described in greater detail below.
A primary goal of this thesis is to develop and apply methods that control the
conditions under which crystal growth occurs by drawing on configurations where
di↵usion (and mass transport generally) in the system is well understood using
theories derived from the field of electrochemistry [44]. By doing this we are able
being investigated, using mathematical models [45,46,47] to further draw out
quan-titative kinetic information. All systems are visualized using modern microscopic
techniques to observe systems on the micro-scale and the nano-scale, techniques
where, again, mass transport of the system is well defined or may be easily
mod-elled. Techniques include observation of single crystals by optical microscopy, atomic
force microscopy (AFM) [48, 49], interferometry and SECM.
1.2.2
Theory and Background
Supersaturation and Undersaturation
The discussed equations in this section will describe the following generalized crystal
system [50, 51], in which A and B are dilute species in an ionic solution, and come
together to form a crystal with a formula AB. In an aqueous solution the equilibrium
which exist is as follows in Equation 1.1 [51]:
Am(aq)+ + Bn(aq) ⌦kf
kb
AB(aq) (1.1)
wherekf andkb are the forward and backward reaction rate constants, respectively.
S of higher than unity. The supersaturation ratio is defined as follows:
S = (m+n) ra
AaB
Ksp
(1.2)
where Ksp is the solubility product of AB and aA and aB [52, 51] are the activities of Am+ and An respectively. A solution is supersaturated if it has a concentration
equal to, or higher than the solubility product (S 1) [53, 51].
Nucleation
Nucleation is defined as a distinct change from one phase to another [54]. In the
case all crystal systems discussed in this thesis, this involves a phase change from a
solution (phase I) to a solid (phase II) [55] where the driving forces are the
concen-tration [56, 57] (supersaturation, as discussed above) and the surrounding
temper-ature [53]. In order to control the habit of the resulting crystal, it is necessary to
understand the fundamentals of nucleation, as these early stages of nucleation and
growth have great bearing on the structure of the crystal produced. This is
chal-lenging to determine experimentally, as an initial nucleus which defines the phase
change to the solid state is approximately 100-1000 atoms in size [57], and therefore
it is impossible to observe it’s morphology at this stage.
Fr
ee Ener
gy (
∆
G
)
r
∆
G
s
∆
G
v
∆
G
[image:27.595.142.454.114.318.2]critical
cluster size
Figure 1.1: Graph showing free energy diagram for nucleation.
form, as described in Equation 1.3 [52, 58]:
J /e G/kBT (1.3)
where G is the Gibbs free energy of the system, kB is Boltzmann’s constant, and
T is the temperature. G is equal to the sum of the surface free energy Gs and
the volume free energy Gv. This is also illustrated in Figure 1.1. r is the radius
of the particle, which is modelled as a perfect sphere (due to a sphere having the
lowest possible surface tension, and therefore being the most energetically stable
nucleus shape) [58, 59]. Gv is the free energy term for a phase change from liquid
to solid and is proportional to the volume of the particle (r3). G
sdescribes the free
energy change for the formation of the surface, which is proportional to the particle’s
Classical Nucleation Two Step Process
Figure 1.2: Illustration of classical nucleation theory compared to a two-step nucleation process
and cause an increase in the free energy of the system. If the resulting nucleus is
larger than the critical radius, r⇤, a value which will depend on the thermodynamic conditions of the system, the activation barrier for nucleation has been overcome,
and the nucleus will continue to grow, as the volume term then dominates, causing
a drop in Gibb’s free energy [54].
CNT has some limitations, in that it assumes that the particles produced are
or-dered within the modelled spherical particles, in the same uniform fashion as an
established crystal. Surface e↵ects are dismissed, which is an important
considera-tion when nucleus size is small [60, 51], and one monomer is added at a time. The
two-step process was introduced to amend some of these short comings, and address
the fact that nucleation is based on the complexity between kinetic and
thermody-namic e↵ects. The di↵erences between these two proposed theories are illustrated
The two-step process describes small, amorphous clusters being formed as a
precur-sor to nucleation of the final crystal structure. These clusters do not have the same
crystallinity as the final crystal, and the lack of order means that their structure
results in less of a decrease in Gibb’s free energy compared to that of the crystalline
product in relation to that of the reagent solution. However, kinetically this route is
more energetically favourable, due to the fact that the activation energy required to
produce these clusters is lower than that required to form a crystalline nucleus from
scratch, as described by CNT. It is therefore possible for nucleation to occur by the
two-step process even in under saturated solutions, as was observed by Gebauer [61].
This intermediate state is known as a metastable form [62], and also explains why
polymorphism occurs; a phenomenon whereby a crystal may have more than one
form, and may exist in the metastable form before transforming into a more stable
form.
Crystal nucleation can be classified as either heterogeneous or homogeneous [54].
The Gibb’s free energy for heterogeneous nucleation Ghet is lower than that of
homogeneous nucleation Ghom due to a property known as wetting. In general,
a crystal on a surface will have lower surface energy than a crystal in solution,
this makes crystal growth more favourable in the heterogeneous case. This gives a
larger value for the rate of nucleation [63], which agrees with observation because
crystals have a higher tendency to nucleate on imperfections even at much lower
supersaturations than is possible for homogeneous nucleation. However, depending
Figure 1.3: Illustration of a growth unit combining with a crystal lattice via the KSV
mechanism. (a) a growth unit, depicted here as a cube, di↵uses to the terrace surface
from bulk solution and becomes adsorbed, (b) The growth unit is mobile on the terrace and migrates to a ledge, (c) Finally, the growth unit is incorporated into a kink on the crystal surface.
surfaces favour the nucleation of a particular crystals, for example, if the charge on
the surface allows for a crystal of a particular unit cell to nucleate, but it is possible
that a substrate can also inhibit this growth. The e↵ect of surface modification on
the habit of crystal nucleation will be further investigated in Chapter 5.
Crystal Growth
In order for crystal growth to occur following the establishment of a crystal nucleus,
a series of steps must occur for the incorporation of a growth unit from the solution
to the crystal lattice [54, 51, 64, 65]. it is not well understood what the form of
this growth unit is, it may be an ion or a molecule, or a cluster of either, and
it may vary depending on the system. The first step involves the mass transport
of the growth unit from bulk solution to the solid-liquid interface, after which the
molecule is adsorbed onto the terrace surface. This is illustrated in Figure 1.3a.
Figure 1.4: Diagram showing how a screw dislocation can form a mismatch in planes
of freedom when it meets the terrace. Further incorporation into the lattice of the
crystal then occurs as the growth unit has mobility on the surface terrace, and then
attaches to the ledge as illustrated by Figure 1.3b, and loses a second degree of
freedom due to the additional point of attachment of the crystal lattice. Finally,
the growth unit loses a third degree of freedom by attaching to a kink, as shown in
Figure 1.3c [52,64]. The processes following the mass transport step are collectively
described as the surface kinetics of crystal growth. Whichever of these steps is the
slowest is the one that determines the rate of crystal growth. In the case of crystal
dissolution, the same process occurs in reverse.
As discussed, the most energetically favoured endpoint of a growth unit is to attach
to a kink on the crystal surface, and this is generally the mechanism by which
crystal growth can continuously propagate by the addition of further units and the
production of layers of the crystal. This is known as the KSV model [66,67,68]. This
theory is further extended by the BCF theory [69,70,71] in which crystal growth is
modelled as the movement of steps across the surface [52, 56,72]. BCF theory goes
on to explain that a defect on the surface, such as an absent atom, a foreign atom or
(a)
(b)
[image:32.595.146.454.128.356.2](c)
(d)
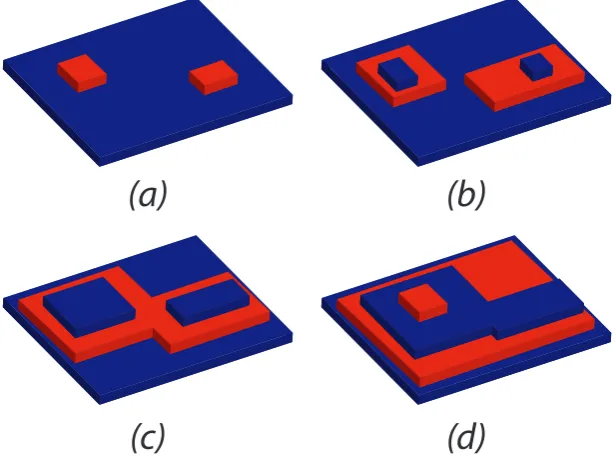
Figure 1.5: Illustration of the birth and spread model of crystal growth, showing poly-nuclear growth
produce a screw dislocation, as illustrated in Figure 1.4. The resulting spiral shape
is an infinite source of steps by which crystal growth can occur continuously. Screw
dislocations have been observed experimentally by techniques such as AFM [73,74].
Theories such as Burton Cabrerra Frank (BCF) and Kossel, Stranski and Volmer
(KSV) are applicable even in systems with small driving forces, such as low
super-saturations. At higher supersaturation, instantaneous nucleation on the surface is
also possible, where a nucleus can form on the crystal surface and continue to
prop-agate in two dimensional layers. This nucleus becomes the source of steps. It is also
possible to have multiple nucleation sites which then merge, as shown in Figure 1.5,
known as poly-nuclear growth [75]. The rate of this microscopic growth, no matter
and therefore the macroscopic morphology of the resulting crystal.
1.3
Applications of Crystal Growth in this Thesis
The following subsections will detail the systems of interest in this thesis. In
partic-ular, crystals with pharmaceutical applications and the behaviour of a well known
organic crystal, salicylic acid, is investigated, and the nucleation and growth of
barite, an undesirable crystal form of barium sulphate which grows as a scale in oil
wells.
1.3.1
Pharmaceutical Crystals
As discussed in Section 1.2.1, the pharmaceutical industry is responsible for a vast
amount of research and development of wide and varied scientific fields. Crystal
growth and dissolution is very relevant to the pharmaceutical industry, as many
drugs, known as active pharmaceutical ingredient (API)s come in a solid form which
is delivered orally and it is regularly the case that a crystalline version of the API is
preferable to the amorphous version for higher physical and chemical stability [40].
Crystallizing the drug also makes it purer. Therefore a great amount of research
exists which aims to understand the kinetics of growth and dissolution of
pharma-ceutical crystalline materials.
control the nucleation and continued growth of the crystal during manufacture. The
conditions under which the crystal nucleates will impact on the structure, habit and
size distribution of the resulting crystals. Factors which may a↵ect this include the
concentration, temperature and pressure of the reaction vessel and the population
of already nucleated crystals and the material which the vessel is made of. Also of
interest when producing a drug is the dissolution kinetics, as the drug will undergo
dissolution upon administration to the patient.
Polymorphism
It is common for organic crystals to exhibit polymorphism, where it is possible for
one chemical to have more than one possible crystalline structure [76, 11, 77, 78,
45, 79], a↵ecting the stability, solubility and dissolution rate of the API. It is
es-sential for the drug manufacturer to understand which of these forms are present
as their behaviour upon administration vary, as the di↵erent crystal shapes may
a↵ect the bioavailability of the API. It is possible to control or suppress the growth
of a particular polymorph by finely tuning the solvent used, the temperature and
supersaturation, or by using additives which inhibit or encourage a particular
mor-phology [80]. As discussed in Section 1.2.2, adjusting the conditions during
nucle-ation can have an e↵ect on whether the nucleation acts via the thermodynamically
favourable route, to immediately produce a stable form of the crystal, or if
kinet-ics are more relevant and the crystal may nucleate by first being produced in it’s
Reagants in solution
Kinetic (metastable) crystal
Thermodynamic (stable) crystal ΔGa, k
ΔGa, td
ΔGk
[image:35.595.146.463.125.385.2]ΔGtd
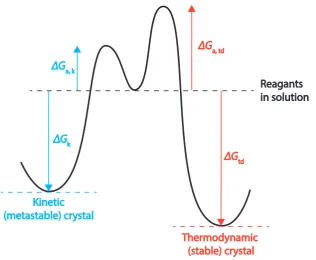
Figure 1.6: Energy diagram showing the energy change for a typical crystal system with stable and metastable polymorphs from nucleation from solvent
Otswald rule describes the series of metastable phases which the crystal will undergo
before achieving thermodynamic stability [81].
For many pharmaceuticals it is desirable to produce the most stable form due to
its physical and chemical strength making it unlikely to transform during and after
manufacture. However, there are drugs which require a metastable form of the API
to be administered, due to the typically higher solubility and greater dissolution
rate, for more sparingly soluble pharmaceuticals. When this is necessary, a major
challenge is to completely prevent the stable form from growing, and prevent
trans-formation from the metastable to the stable drug over time, by choosing appropriate
accu-rately during large scale plant production[82, 83]. Further discussion on the trials
of scaling up production will be discussed below in Section 1.3.1
Cocrystals
As well as using metastable polymorphs to improve the solubility of
pharmaceuti-cal crystals with poor bioavailability, various other approaches may be used [84].
Sometimes the amorphous form of the API is used, which has the advantages that it
dissolves easily and is more compressible to be easily formed into a tablet. However,
as previously discussed, the amorphous form is less chemically and physically stable.
One approach is to produce the API as a salt, this can make it more bioavailable,
but there are still some APIs which are unsuitable to be formed into salts.
A relatively new approach to this problem is to produce cocrystals, which are
multi-component crystal systems which are joined by hydrogen bonds or other non-covalent
interactions [84]. The API is combined with a substance which is regarded as safe
for consumption, for example a food preservative or a biomolecule, known as the
cocrystal former (CCF). A suitable CCF is selected and the cocrystal designed based
on the rules of hydrogen bonding by Etter [85,86]. Although cocrystallization is not
yet a concept that is widely used in manufacture of pharmaceuticals, there has been
much research into looking at organic cocrystals containing APIs [87,88,89,90]. As
with metastable polymorphs, great care has to be taken to ensure that the correct
Scaling Up of APIs
A major challenge in drug production is the scaling up of crystallization from small
scale production in a laboratory where micro-milligrams of the API is produced, to
plant production for commercial purposes with resulting kilograms-tons of API [40,
90]. Most crystallization processes in the pharmaceutical industry involve either
cooling or the addition of an antisolvent or a reactant. The scaling up must be done
in such a way that the properties are reproducible in size, shape, form and purity,
and to ensure that this happens at a reasonable cost to make the drug profitable.
This is made even more difficult by the fact that the process often has to be adapted
to existing vessels which are not custom designed for the particular reaction. The
time taken for complete crystallization in large scale production is much longer, as
there is a large volume of slurry, and this increases the probability of an undesirable
morphology will form. Also when reactants are added to the mix, it is essential
that any increase or decrease in temperature is controlled so that the conditions
under which nucleation and growth occur are as similar to laboratory conditions as
possible. Many industrial crystallizers contain an impeller which rotates to mix the
slurry, nucleation on the blades and damage to the existing crystals during stirring
is undesirable.
Initial approaches to crystallization on a large scale involves a batch crystallizer [59],
which is a vessel containing a large volume with a mixer. The shortcomings of this
and morphology. The crystals produced during nucleation a↵ect the ease of processes
further along drug manufacture, for example during filtration, drying and milling of
the finished product.
There is now some move towards to a continuous flow system [59], where a steady
state is reached and the reagent or antisolvent is added at various points along the
crystallization process [91, 92]. Despite the difficulty in development of this kind of
system, they allow for much greater control and efficiency. Continuous processors
are typically smaller in footprint and mass of material and for this reason usually
cheaper to buy and store. Often in batch crystallizers the drugs will be milled in
order to improve the biovailability by decreasing particle size, this agitation can risk
a solid state transformation and the addition of a process will increase costs to drug
production. They come in two main forms, one where a series of batch systems
are used, most appropriate for crystal systems with slower kinetics. They tend to
be cheaper and easier to maintain, but are less efficient than plug flow reactors,
which continuously flow the material along a single crystallizer, adding the reagent
or antisolvent at each stage. These kinds of crystallizer are more appropriate for
crystals with faster kinetics which happen over shorter periods of time.
Salicylic Acid
Salicylic acid (2-hydroxybenzoic acid) is a well known pharmaceutical with pain
[100]
[010]
[001]
Figure 1.7: The crystal structure of the unit cell of salicylic acid crystals. The white spheres represent hydrogen atoms, black represent carbon, red represent oxygen.
much more commonly seen as its derivative, aspirin (acetylsalicylic acid). However,
salicylic acid itself is still commonly used to treat many skin ailments. The crystal
structure of the one known polymorph of salicylic acid is monoclinic, and in fact,
almost cuboidal with unit cell dimensions of a = 11.52, b = 11.21, c = 4.92 ˚A, = 90 50’, as determined by Cochran [93] and further refined by Sundarlingam [94].
The unit cell of salicylic acid is shown in Figure 1.7.
A large percentage of studies into the kinetics of salicylic acid involve batch
sys-tem [95,96,97,98], similar to the ones used in pharmaceutical production, discussed
above. The crude nature of these systems means that crystal nucleation and growth
is not well controlled and there is a large variation ion the size, morphology and
crys-tal growth over time, which means that surface kinetics and mass transport e↵ects
are not well separated. It was iterated in some of these studies [96, 95] that the
system was mass transport controlled.
A better attempt at separating mass transport and kinetics of the dissolution of
salicylic acid was observed by Compton et al [99, 100, 101], in their studies which
observe planes of salicylic acid using AFM using a hydrodynamic flow cell. In
these studies the surface flux was measured and it was suggested that a surface
controlled process was in operation. This was questioned in our article [102] where
plane resolved kinetics of whole salicylic acid were deduced from a combination of
optical microscopy videos and finite element method (FEM) simulations, due to
the discrepancy in measured flux and the observation of dissolution in a saturated
solution. The work done in that particular article will be detailed in this thesis in
Chapter 3.
In Chapter 4 the dissolution kinetics of salicylic acid is further investigated. Here
we resolve quantitative rate constants of the dissolution of the (110) face of salicylic
acid by measuring the current response when a SECM ultramicroelectrode (UME)
is approached toward the crystal surface whilst held at a reducing potential. The
1.3.2
Barite Scale
Another system studied in detail in this thesis is barium sulphate (BaSO4). The
uses of barium sulphate are diverse, and mostly take advantage of the high density
of barium sulphate. It is added to drilling fluid in the production of boreholes, as
a radiocontrast agent in radiography, for a ‘barium meal’, and as a white pigment
in paint. However, the interest in the field of crystal growth and dissolution is an
undesirable quality; namely barite, the only possible morphology of barium sulphate,
forming in oil wells and causing scale and blockages [103, 104].
The unit cell of barite is orthorhombic with a pyramidal point group and dimensions
a = 8.884(2) ˚A, b = 5.457(3) ˚A, c= 7.157(2) ˚A; A = 4, as is shown in Figure 1.8, as was determined by Hill [105].
Formation of Barite Scale
Barite is rather insoluble in aqueous solution, with a Ksp value of 1 ⇥ 10 10 [106,
107,108] leading to the ease of formation even in very low concentrations of barium
and sulphate in solution. Of all scales which form in oil wells, barite is one of the
most insoluble and resistant to chemical treatments, so research into the prevention
and removal of barite is very valuable. Barite formation occurs when the formation
water occurring naturally mixes with sea water, which has a high sulphate content.
(100)
(001)
(010)
approaches such as drilling or chemical methods such as removal by acid. Now
that the issue is well documented, much research into these systems involve the
prevention of nucleation and continued growth of the mineral by
functionaliza-tion of the surface and using additives which inhibit the process in the formafunctionaliza-tion
and sea water. Functionalization is often performed using self assembled
mono-layer (SAM)s [109,110, 111]. Chemical inhibitors commonly used include
phospho-nate [112,113, 114,115] molecules to either chelate barium ions in solution, or bind
to the emerging crystal structure.
Much existing literature observes nucleation islands of barite by use of AFM [116,
117, 118, 119], but the approaches in this thesis focus on optical microscopy
com-bined with image processing, and the use of a nanopipette to observe nucleation
processes of barite particles.
1.4
Mass Transport and Surface Kinetics
During any surface process, the overall rate is dependent on two main processes.
The first is mass transport of species to the surface, and the second is the surface
reactions required to allow the process to happen [44]. These theories are applicable
to both crystal growth and dissolution, and electrode reactions (discussed further in
Section 1.5)
terms for di↵usion, convection and migration (in that order) in the system to
cal-culate the flux, J of species of concentration, c:
J = Drc+uc zF
RTDcr (1.4)
where D is the di↵usion coefficient of the species, u is the fluid velocity, z is the charge on the species, F is Faraday’s constant, R is the ideal gas constant, T is the
absolute temperature and is the electric field strength. Di↵usion describes the
movement of the species due to a di↵erence in concentration, with a tendency for
the species to travel from a high concentration to a low concentration, as described
by Fick’s 1st Law [120], as follows:
J = D@c
@x (1.5)
where x describes a length dimension. Convection is caused by the movement of species due to turbulence in the system, and migration is due to the movement of
charged species caused by an electric field.
For crystal growth and dissolution, the process of adsorption and incorporation of
growth units is described in Section 1.2.2. For electrochemical reactions involving a
by:
O +ne ⌦R (1.6)
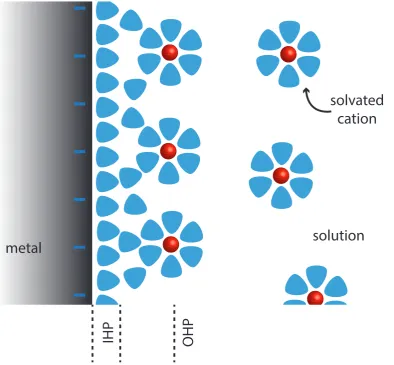
where O is the oxidized species and R is the reduced species, for a process where n electrons,e are transferred from the electrode. Prior to this any necessary chemical reactions must occur at the surface and the species may be adsorbed, or approach
close to the electrode (at the outer Helmholtz plane) [120, 44]. This adsorption is
illustrated in Figure 1.9, as is the formation of the inner and outer Helmholtz planes
for cations in aqueous solution, with a negative potential applied to the electrode.
The rate determining step describes the slowest step. For a system where the mass
transport is sluggish, it is described as ‘mass transport controlled’, and when mass
transport is sufficiently high that surface kinetics are slow by comparison, the system
is described as ‘surface controlled’.
1.4.1
Bulk Crystal Growth Studies
There are many studies into crystal nucleation and growth which involve the use of
a batch system in which growth can be measured over time, which is comparable to
those crystallizers used during the manufacture of the drug [38,59,91], as discussed
in Section 1.3.1. These systems are informative for identifying general growth trends
Further
-metal
solution
IHP
OHP
[image:46.595.101.496.227.592.2]solvated
cation
more, the conditions under which drugs nucleate is not well controlled and it is
difficult to determine intrinsic kinetics at all.
1.4.2
Micro-crystals
As was discussed in Section 1.2.2, in order for crystal growth to occur, the first step
is for a growth unit to di↵use to the surface of the crystal before being incorporated
into the surface. If the di↵usion is slow, there is a low concentration of the growth
unit on the surface of the crystal due to the fact that the kinetic step can easily keep
up with the incoming species. During dissolution, the concentration near the surface
will be much higher than in bulk, as is observed by FEM simulations in Chapter 3.
This kind of system is known as a mass transport controlled system. The faster
the mass transport, the closer the interfacial concentration will be to that in bulk
solution. This is synonymous to an electrochemical reaction where the species in
solution must di↵use to the surface of the electrode before electron transfer can
occur.
The concept of micro-crystals is one which is used to describe a crystal with small
dimensions, say of than 100 m, and is a concept which is derived from the field
of electrochemistry and UMEs [44]. If the crystal is larger than this, the di↵usion
across the surface will be planar and the di↵usion will be slow. Both of these cases
are illustrated in Figure 1.10. Close to the edges of the crystal, and more so the
areas will be higher (Figure 1.10a). For a micro-crystal, the di↵usion tends towards a
hemispherical case as species can di↵use from all directions, and di↵usion is high and
well defined (Figure 1.10b). In this regime it may be possible to probe and measure
surface kinetics and in this thesis, many projects aim to produce micro-crystals with
small dimensions [122, 123]. In some systems, di↵erent faces of the same crystal
may have di↵erent characteristics, as the speed of the surface kinetics may vary
for di↵erent crystal structures. Macroscopically this can (and will) determine the
morphology of the crystal [42, 124].
(a)
(b)
Figure 1.10: Diagram showing the di↵usion fields observed for (a) a macro crystal with
some planar di↵usion and (b) a micro-crystal with a hemispherical di↵usion field
Another method often employed to produce higher mass transport is to introduce
hydrodynamic flow, for example, by rotating disk method [125, 126] and channel
flow method [127, 128] to push the species towards the surface of the crystal. This
however has the disadvantage that any kinetics measured are not easy to measure
directly, but rather inferred from the perturbation. There are many examples of
this in literature, and these are often coupled with another method to monitor the
electrochemical measurement. An overview of these are detailed below.
1.5
Electrochemistry
1.5.1
Electron Transfer at an Electrode Surface
R
bulk
O
bulk
R
surf
O
surf
R’
surf
O’
surf
R
ad
O
ad
Surface
Bulk
Electrode
M ass Tr anspor t Chemical R eac tions Adsor ption/D esor ption Electron TransferFigure 1.11: Processes which occur close to the surface of an electrode. Adapted from Bard and Faulkner.
Electron transfer processes occur when an electrode is placed in a solution containing
an electrochemically active species. By applying a potential to the electrode (with
respect to an electrode), the species can undergo oxidation or reduction at the
surface, following mass transport. These processes are illustrated in Figure 1.11. As
described in Equation 1.6, the redox reaction involves the transfer of an electron for
electrode to solution species. If oxidation occurs, it is because the potential is such
Ener
gy
LUMO
HOMO
Electrode Solution Electrode Solution
Fermi Level
Fermi Level
(a)
(b)
Figure 1.12: Energy level diagram showing (a) case where there is insufficient energy (due
to potential applied to electrode) to drive reduction and (b) sufficient energy that electron
transfer can occur, as the Fermi level is tuned by altering the potential.
of the electrons in the electrode. When the lowest unoccupied molecular orbital
(LUMO) of the electrode has a lower energy than the Fermi level of electrons in the
electroactive species, resuction will occur [44]. This is illustrated in Figure 1.12.
When electron transfer is fast compared to the mass transport of the system, the
Nernst equation, as follows, is true at the electrode surface:
E =E + RT
F n ln O
R (1.7)
whereE is the electrode potential andE is the standard electrode potential for the electron transfer reaction in question. When kinetics are more significant,
in Equation 1.6:
kf =k exp ↵
nF
RT(E E ) (1.8)
kb =k exp (1 ↵)
nF
RT(E E ) (1.9)
where k is the intrinsic rate constant of the reaction and ↵ is the electron transfer coefficient.
1.5.2
Ultramicroelectrodes (UMEs)
r
electroder
capillaryRG =
r
electroder
capillaryFigure 1.13: Illustration of a UME illustrating what is meant by the RGvalue.
smaller than the size of the electrode. Typically this applies when the size of the
electrode is smaller than about 100 m. UMEs are made in many di↵erent
geome-tries [129,130], but all UMEs discussed in this thesis are disc shaped and embedded
in an insulating surface. The RG value describes the ratio between the radius of
the active part of the electrode and the radius of the insulating surface, which has
a typical value between 2-20 [131]. Figure 1.13 illustrates the definition of the RG value.
Using the same concepts previously described for micro-crystals, the small
dimen-sions of the UME mean that the di↵usion field observed is hemispherical and well
defined. Mass transport is very high which means that the electron transfer
pro-cesses on the electrode surface are less likely to be mass transport limited [132]. Low
currents are observed when using UMEs and this means that a two electrode set
up is adequate, as charge does not accumulate on the reference electrode, causing a
change in it’s relative potential, with the UME as the working electrode and a
ref-erence electrode. Measurements are performed with a high background electrolyte
concentration (100⇥) than that of the redox mediator. For a disk electrode, the
limiting current, i1, is calculated by solving Fick’s 2nd Law, to give:
i1 = 4naF Dc1 (1.10)
concen-tration of the species in bulk solution (far from any surfaces or other interference).
1.5.3
Scanning Electrochemical Microscopy
SECM is the original electrochemical scanning Probe Microscopy (SPM) technique
originally used by Bard in 1989[133]. The tip (probe) is an UME immersed in
a solution containing the electroactive species and the supporting electrolyte [44].
The UME is placed very closely to an interface of interest and the electrochemical
response is measured. In this thesis SECM is used in an amperometric
configu-ration, which means that a constant potential is applied and the current due to
the electrochemical reaction is measured. The current measured near to the
sur-face will depend on which mode of SECM is used. In the experiments described
in this thesis, ‘induced transfer’ is used. It di↵ers from some other modes such as
tip collection/substrate generation and tip generation/substrate collection because
only the tip (electrode) current is measured. The tip is set to a potential such that
oxidation or reduction of the species of interest occurs, which, in turn, may drive a
process at a nearby surface. To a varying degree, it is also possible that a reduction
or oxidation process can occur at the surface.
Approach Curves
Approach curves are the most simple measurement to take using SECM [134, 135],
1
0
I
T
d/a
O
R
bulk solution
O
R
positive
feedback
O
O
[image:54.595.90.497.115.392.2]negative
feedback
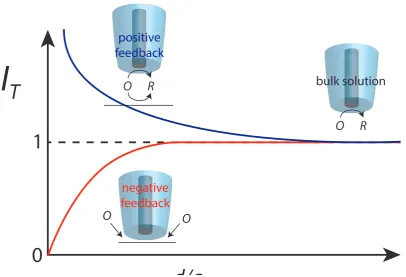
Figure 1.14: Graph showing the normalized current for the cases of positive and negative feedback in SECM. Diagrams illustrating the redox behaviour at the electrode for these cases are also shown.
moving vertically towards the surface [44]. The rate of approach must be sufficiently
slow to avoid convection from being induced by the motion, which could a↵ect the
mass transport of species to the electrode surface. For an inert surface, the electrode
will eventually reach a point where di↵usion to the electrode is hindered by having
the tip-substrate separation close enough that species can not enter the area close
to the electrode as easily. This translates on the approach curve as the current
eventually reaching zero for a perfectly aligned tip. If the surface is conducting, the
regeneration of tip-generated species at this point will lead to a steep increase in
electrode current close to the surface (positive feedback). These two cases are shown
two extremes, especially when regeneration of the species at the surface is a rate
limiting step and the substrate has both active and insulating areas [136].
Scanning and Imaging
It is useful to build a 2 dimensional (2D) map of the surface, to measure the activity
across the surface [137, 135]. In order to do this, the tip can be brought near
to the surface and then scanned in a raster pattern (the tip moves left and right
horizontally across the surface at a steady rate, whilst also moving vertically). The
simplest form is constant height mode where the tip is brought close, and then
scanned at a constant height, as shown in Figure 1.15. However, this is not ideal
if the surface and the tip are misaligned or there are topographic features, as the
tip moving further from the surface will equate to a change in current which is
closer to the bulk value. This means that the contrast of this measured current is
much lower between surfaces of di↵erent activity. If the misalignment is such that
the initial point is a lower than other areas of the scan, it is likely that the tip
will collide with the surface and become damaged. There is also no mechanism of
determining whether change in tip current is due to topography or activity of the
surface. Therefore, constant tip-substrate distance is implemented throughout the
scan by a feedback loop [138, 139, 134].
Traditionally this constant tip-substrate separation is achieved by keeping a constant
constant height
[image:56.595.86.497.106.373.2]constant
distance
Figure 1.15: Diagram showing the di↵erence between scanning at a constant height and a constant distance.
in reality is unlikely to be the case. In this thesis, intermittent contact (IC)-SECM is
used to overcome this issue. IC involves oscillating the UME at a constant amplitude,
and approaching the surface. When the tip-substrate separation becomes very low,
the oscillation of the tip is damped by the presence of the surface. The reduction
in amplitude of the tip oscillation is measured and a feedback loop will use this to
halt the approach curve. Throughout the scan the amplitude is monitored and the
tip is moved up and down to keep it at a constant value, as shown in Figure 1.16.
HIC-SECM (Hopping IC-SECM)[140] is a more modern technique used in this thesis
where the surface is mapped by performing a series of approaches in the scan area.
UME path
surface
current response
(a)
(b)
Figure 1.16: The topography, the UME path followed using IC and the current measured for (a) a uniformly active surface with topographical features and (b) a flat surface with electrochemically active regions.
1.5.4
Nanopipettes
Nanopipettes are also used as electrodes in this thesis. These are small pipettes
pulled to a fine point which contain an electrolyte solution and a quasi-reference
counter electrode (QRCE) inside the pipette, as well as a second in bulk solution, in
which the nanopipette is immersed, as shown in Figure 1.17. As with SECM probes,
the resolution is improved as smaller tip radii are achieved, but nanopipettes are
much easier to fabricate, so smaller tip sizes are achievable, and therefore higher
resolution scans to be produced. The method of scanning using nanopipettes is
called scanning ion conductance microscopy (SICM) [130], as an ions conductance
between the two QRCEs is applied. Therefore, the flux measured is due to migration
of species due to an electric field rather than being due to di↵usion or convection.
SICM is a method which was first implemented by Hansma in 1989 [141].
Various methods are used to maintain feedback of the nanopipettes during a scan,
such as using the change in ion current [142] or by using bias modulation, however
A
[image:58.595.187.416.115.346.2]electrolyte
bath
Figure 1.17: Schematic showing the set up for SICM.
which utilises nanopipettes (Chapter 6), does so using current measurements during
nanoprecipitation, and is not for scanning purposes.
Nanopipettes, and closely related nanopores, have been used to study a range of
systems [143], from biological samples [144, 145, 146], and as is the case in this
thesis, crystal nuclei.
1.6
Additional Microscopy Techniques
1.6.1
Optical Microscopy
Optical microscopes allow the user to view a sample at a high magnification which
sample with
crystal
transmitted
light
condensor
lens
optical
lens
Figure 1.18: Diagram showing how light is transmitted through an optical microscope
of the ability of light to di↵ract and refract when it passes through lenses [147].
A basic schematic of a wide-field microscope is shown in figure 1.18, showing the
most important features. The light from the source first passes through a condenser
which gathers the light and focuses the beam onto the sample and then onto the
objective lens which creates an inverted image of the crystal. The magnified image
passes through the eyepiece where it is magnified to be viewed by a camera (which
has an output to a computer screen). It is possible to reflect all light to the camera,
to view directly by eye, or half of the light to each.
In place between the light source and the condenser is a field diaphragm followed by
an aperture diaphragm. The numerical aperture NA [148] of any optical system is
light:
NA =nrsin✓ (1.11)
where nr is the refractive index of the medium (in the case of the microscope in
air n = 1) and ✓ is the half angle of the cone of light captured by the lens. For a compound microscope the numerical aperture is a summation of the numerical
apertures for the objective and condenser lenses. This depends on a value known as
the angular aperture for each lens ✓obj and✓con respectively [147]. This relationship
is shown in equation 1.12:
NA =nrsin✓obj+nrsin✓con (1.12)
Because the numerical aperture defines the cone of light accepted or emitted by
the lens, it is better to have as large a value as possible. This is because when
the objective lens accepts light from over a wider angle a greater amount of light is
available to form the image [147].
The resolution of images in optical microscopy is limited by the wave properties
of light. When light passes through an aperture it produces a di↵raction pattern
known as an Airy disk [148]. The intensity profile for a point light source being
(a) Intensity distribution of airy disk (b) Intensity distribution for two points
Figure 1.19: The di↵raction patterns produced when light passes through an aperture.
a certain distance dsep, the di↵raction patterns overlap and constructively interfere
as is shown in figure 1.19b. The minimum resolvable separation is as described in
equation 1.13:
dsep =
2N A (1.13)
where is the wavelength of the light used. This proves that a better resolution may
be obtained by either increasing the numerical aperture or decreasing the wavelength
used. For the latter reason the electron microscope was invented, as electrons have
a smaller wavelength than visible light allowing higher magnification. SPM was a
great advance into looking at features on the nano-scale as it does not require light
to be used. SPM can provide a numerical insight into the height information of a
surface, so that 3 dimensional information may be obtained. This is advantageous
1.6.2
Interferometry
CCD
beam splitter
objective lens
focal plane collimating lens
source
[image:62.595.149.458.150.550.2]sample
Figure 1.20: Diagram showing a typical interferometer, used to profile surfaces.
In order to profile crystals of slightly higher dimensions (20-200 m) vertical scanning
interferometry (VSI) was used in the study in Section 3 on salicylic acid crystals. A
typical set up used for surface profiling [149], to reveal surface topography, is shown
in Figure 1.20. The light is typically a point source white light and is passed through
lens which focuses the light onto a sample. Light from both the objective and the
source is received by a CCD, if these beams are in phase an interference pattern is
observed. This also corresponds to when the focal plane from the objective lens is
in line with the surface being profiled. To observe di↵erent depths, the objective
is scanned vertically using a piezo, and from the corresponding interference at each
observed focal plane, a topography map is produced.
1.6.3
Atomic Force Microscopy
AFM is a scanning probe imaging technique developed from the technique of
scan-ning tunnelling microscopy (STM) which relies on the quantum mechanical
phe-nomenon of electron tunnelling [150]. In order for a surface to undergo electron
tunnelling it should ideally be conducting, whereas AFM has the advantage that it
is easily used to study insulating surfaces [151,152].
A typical AFM experimental set up is illustrated [153, 150] in Figure [154]. A tip
is mounted on the end of a cantilever which has a certain spring constant kscgiven
by the manufacturer [155]. The tip is brought into contact with the sample. The
sample is mounted on a piezoelectric scanner which allows the tip to raster scan
the sample across the surface and alter the height, therefore controlling the x, y and z-directions. As the tip comes into contact with the sample it experiences a deflection l due to the force Fc between the two. This deflection is dependent on
shown in equation 1.14: A typical AFM experimental set up is illustrated [153,150]
in Figure [154]. A tip is mounted on the end of a cantilever which has a certain
spring constantkscgiven by the manufacturer [155]. The tip is brought into contact
with the sample. The sample is mounted on a piezoelectric scanner which allows
the tip to raster scan the sample across the surface and alter the height, therefore
controlling the x,yand z-directions. As the tip comes into contact with the sample it experiences a deflection l due to the force Fc between the two. This deflection
is dependent on the spring constant of the cantilever and is determined by Hooke’s
law [156] as is shown in equation 1.14:
sample with
crystal
PZT
scanner
laser
source
AFM
cantilever
[image:64.595.159.450.383.661.2]AFM
tip
photodetector
Figure 1.21: Diagram showing a typical set up for an AFM